The European Central Bank showed policymakers can still pack some punch as the bank’s decision to expand quantitative easing efforts gave a boost to local equity and bond markets in January. The Swiss National Bank also surprised, but in a different manner—removing a floor under the franc/euro exchange rate caused the franc to soar and local stocks to plunge. The earnings season has so far taken a backseat to macro data, but based on releases thus far, the US market is underperforming other markets like Japan, as disappointing energy sector earnings and the stronger dollar take their toll. Crude oil continued to sell off in January, but there are some early indications that supply is adjusting. The drilling rig count is falling and many large energy companies announced significant reductions in planned capital expenditure budgets.
Developments in Europe have taken center stage to start 2015. The main event was the European Central Bank’s (ECB’s) announcement that it would expand both the size (to €60 billion per month) and scope (to include sovereign bonds) of its asset purchases to help generate inflation and spur growth. Further action had been expected given a series of fourth quarter comments from ECB executives, but the size and open-ended nature of the purchases exceeded expectations and were greeted favorably by the markets. Eurozone sovereign bonds returned 2.3% to cap a massive 13.1% return in 2014, while UK gilts returned 5.5% as yields fell to historical lows. European equities (3.9%) reversed much of their 2014 underperformance, led by a 7.4% gain for Eurozone equities. Earnings reports that suggested cheaper currencies are flattering bottom lines also helped. Though a relatively small number of companies have reported, average (year-over-year) profit growth in the fourth quarter was around 14%.
Not all European markets fared so well. Swiss equities (-6.8%) plunged as the Swiss National Bank (SNB) abandoned a floor it had set on the euro/Swiss franc exchange rate. The SNB’s massive purchases of euro-denominated assets to try to suppress the franc had left it increasingly vulnerable to exactly the type of announcement the ECB made just a few days later, suggesting the bank’s timing was not a coincidence. Swiss export sectors such as health care and luxury goods are expected to see earnings suffer from a stronger franc; financials will also suffer from the impact of negative interest rates.
Greek elections at the end of January were watched closely by investors. Given Syriza had campaigned on a platform of rejecting austerity measures and renegotiating Greece’s bailout, its election victory saw local equities and debt sell off heavily. Still, with the majority of Greek sovereign debt held by official sector creditors like the ECB and IMF and equity markets that are dramatically reduced in size, contagion risks were viewed as limited, especially in light of the ECB action a few days prior. Eurozone officials have thus far taken a hard line about amending existing agreements with Greece, but with austerity facing growing political backlash in other peripheral countries, both sides have reasons to compromise.
US equities (-3.0%) struggled in January as lackluster earnings announcements drew attention to stretched valuations. Headlines that around 75% of S&P 500 companies have beaten fourth quarter earnings estimates appear encouraging, but forecasts had steadily fallen and now stand at just 7% for full-year 2014. Earnings growth expectations for 2015 have also fallen, to 4%, as energy sector earnings per share estimates have been cut in half. The strong dollar has taken its toll and was cited by a number of companies to explain weak fourth quarter earnings or revised guidance for 2015. US macro data was mixed during the month and at the margin was more supportive for bonds than for stocks. GDP grew a less-than-expected 2.6% in fourth quarter, though the estimated 2.4% growth for 2014 overall was the best in several years. Healthy December non-farm payroll numbers helped cap what was the best year for US job creation since 1999, though the lack of wage growth suggests that the quality of these jobs could be improved.
As was the case in Europe, US fixed income enjoyed a strong month as the yield on the ten-year Treasury fell almost 50 bps to 1.68%. The benchmark Barclays Aggregate returned 2.1% and longer-dated indexes generated even healthier returns. Demand for US fixed income assets was boosted by developments in Europe, as well the lack of inflationary pressures at home (year-over-year CPI stood at just 0.8% in December) and a mildly dovish Federal Open Markets Committee statement. The drop in interest rates across markets has generated healthy gains for global fixed income investors but presents a conundrum going forward; at one point in January, more than $3.5 trillion of developed markets sovereign bonds had negative yields. Any move by savers from bonds into equities could push valuations higher and generate a near-term pop, but if zero interest rates signal slower growth (and thus earnings), the opportunity may be less appetizing going forward than it appears.
The Bloomberg Commodity Index (-3.3%) continued its recent descent, dragged down by losses on everything from industrial metals to energy. WTI crude oil was down 11.5%, though losses would have been far greater had it not been for a spike in prices the last day of the month—allegedly driven by speculators closing short positions. Supply is starting to adapt to lower prices. The number of oil drilling rigs in the United States has fallen by around 15% in the past three months, and in January many oil companies used earnings calls to announce that capital expenditure budgets would be slashed. These actions will probably take at least six months to start meaningfully reducing supply; the recent escalation of violence in Iraq—should it persist—might bring supply and demand into balance more quickly.
Across other markets, Japanese equities (0.3%) were effectively unchanged for the month despite improving earnings and the Bank of Japan suggesting GDP growth could be boosted this year given lower oil prices. Emerging markets equities (1.4%) outperformed developed world equivalents, with developing Asia (2.3%) again offsetting losses in Latin America (-4.8%). Indian equities (5.9%) led indexes higher as earnings growth is expected to be robust, while China (2.2%) failed to benefit either from cheaper valuations (local equities trade at less than 14 times forward earnings) or news that its GDP grew 7.4% in 2014. Brazilian equities returned -5.5% as things went from bad to worse for oil giant Petrobras; after a corruption scandal last year, low oil prices and a rating downgrade now threaten cash flow and debt dynamics.
Given diverging monetary policy across global central banks, and in particular the events in Europe, it was unsurprisingly a very volatile month for currencies. The US dollar rose 6.7% against the euro and 3.7% against sterling, though it depreciated 8% against the Swiss franc. The Canadian dollar (-8.7%) also plunged versus the greenback as the Bank of Canada announced a surprise rate cut. These currency movements will be highly visible to unhedged US$-based investors in global equities. For example, while Europe ex UK equities returned 4.4% in local currency terms, the US$ return was nearly 400 bps less. While some currencies (e.g., the yen) increasingly look oversold, we continue to recommend that US$-based investors hedge a portion of their international equity positions given the risk of the dollar overshooting and the long-term benefits of reducing portfolio volatility.
European equity and bond markets rose as the ECB announced it would increase its asset purchases to €60 bn per month in a bid to spur inflation and revive growth
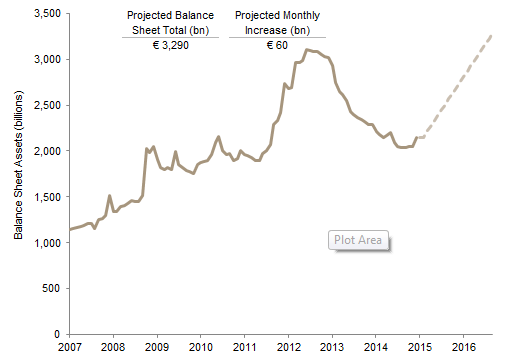
European Central Bank Balance Sheet Expansion
January 31, 2007 – September 30, 2016 • Euro
Sources: European Central Bank and Thomson Reuters Datastream.
Notes: Projections begin after December 31, 2014. The €60 billion increase begins in March 2015.
The Swiss National Bank’s bloated balance sheet made further asset purchases to depress the franc increasingly unpalatable; after the SNB abandoned the floor under the Swiss franc/euro exchange rate, the franc soared and Swiss equities tanked
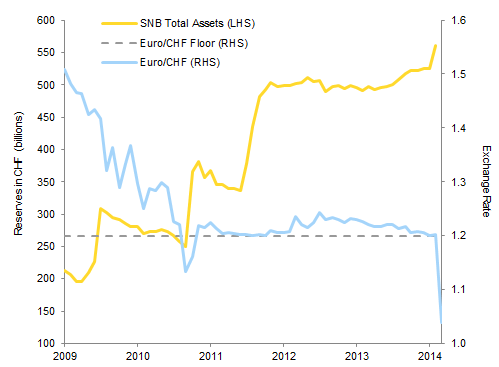
Swiss Franc vs the Euro
December 31, 2009 – January 31, 2015
Sources: Bloomberg L.P., Swiss National Bank, and Thomson Reuters Datastream.
Note: Swiss National Bank reserves are as of December 31, 2014.
Fourth quarter and 2015 earnings expectations have fallen in the United States, bringing attention to stretched valuations. Plunging expectations for the energy sector have played a key role, as has the stronger US dollar
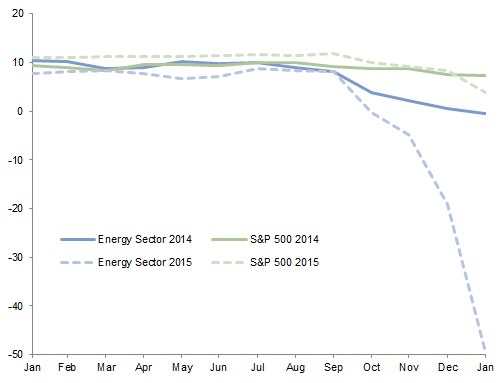
Projected 2014 and 2015 Earnings per Share Growth
January 31, 2014 – January 31, 2015 • Percent (%)
Source: FactSet Research Systems.
US housing starts are recovering but are well below historical averages given low wage growth and slow household formation. More jobs and new households may could help the construction industry recover some of the 1.5 million net jobs it has lost since 2007
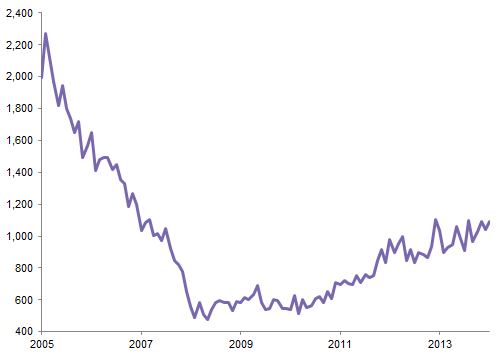
US Housing Starts
December 31, 2005 – December 31, 2014 • Millions
Source: Thomson Reuters Datastream.
Note: Data are monthly.
Weak inflationary data, expanded ECB asset purchases, and a dovish FOMC statement all helped boost US fixed income returns. Equities struggled as 2014’s strong returns have left investors skittish about the potential for further earnings disappointment
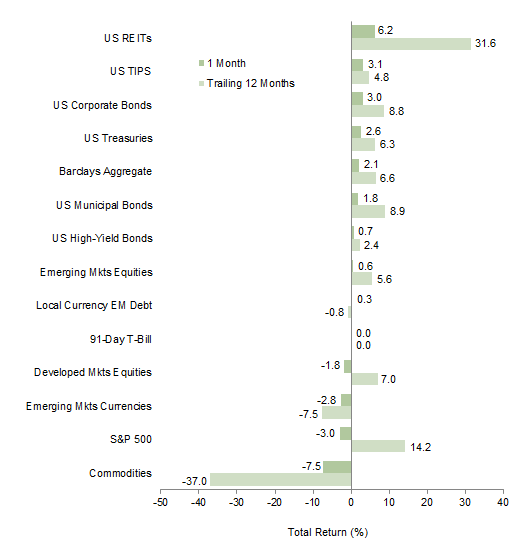
Index Performance (US$)
As of January 31, 2015
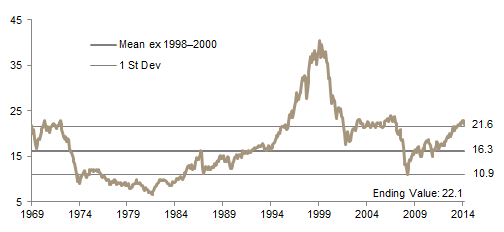
MSCI US Composite Normalized P/E
December 31, 1969 – January 31, 2015
Sources: Barclays, BofA Merill Lynch, FTSE International Limited, J.P. Morgan Securities, Inc., MSCI Inc., National Association of Real Estate Investment Trusts, Standard & Poor’s, and Thomson Reuters Datastream. MSCI data provided “as is” without any express or implied warranties.
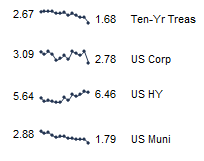
Fixed Income Yields
January 2014 – January 2015
European equities enjoyed their best monthly performance in over a year and erased much of 2014’s underperformance versus US equivalents. A weaker euro also boosted returns on offshore equity markets like emerging markets. Fixed income enjoyed a strong month given the ECB’s announcement and evidence the Eurozone tipped into outright deflation in December
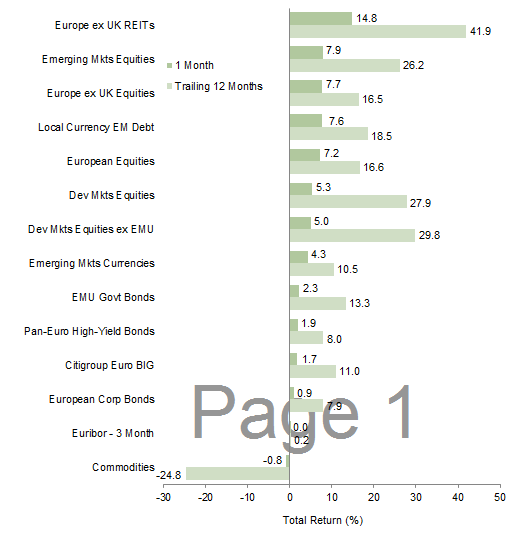
Index Performance (€)
As of January 31, 2015
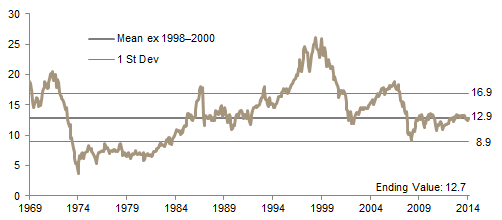
MSCI Europe ex UK Composite Normalized P/E
December 31, 1969 – January 31, 2015
Sources: Barclays, Bloomberg L.P., BofA Merill Lynch, Citigroup Global Markets, EPRA, FTSE International Limited, MSCI Inc., J.P. Morgan Securities, Inc., National Association of Real Estate Investment Trusts, Standard & Poor’s, and Thomson Reuters Datastream. MSCI data provided “as is” without any express or implied warranties.

Fixed Income Yields
January 2014 – January 2015
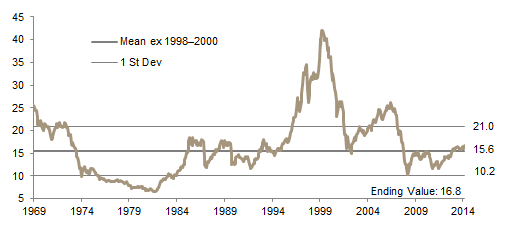
Gilt yields fell to historical lows in January as local inflation is weakening and negative interest rates in the Eurozone boosted the appeal of sterling-denominated bonds. Fixed income indexes enjoyed healthy returns, while equities could not quite keep pace as UK earnings are expected to keep contracting in 2015
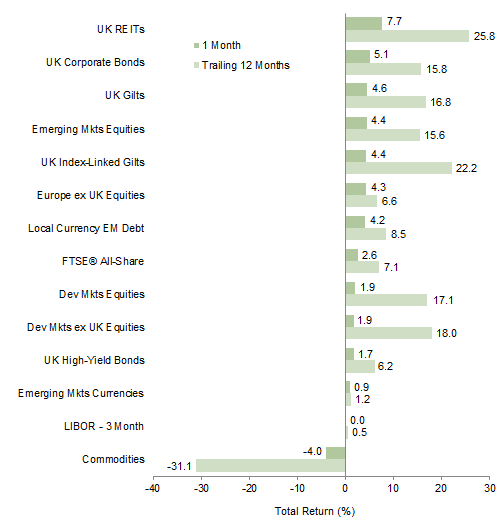
Index Performance (₤)
As of January 31, 2015
MSCI UK Composite Normalized P/E
December 31, 1969 – January 31, 2015
Sources: Bank of England, Barclays, BofA Merrill Lynch, EPRA, FTSE International Limited, J.P. Morgan Securities, Inc., MSCI Inc., National Association of Real Estate Investment Trusts, Standard & Poor’s, and Thomson Reuters Datastream. MSCI data provided “as is” without any express or implied warranties.
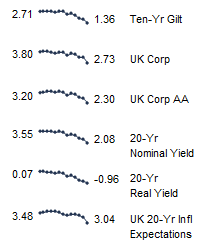
Fixed Income Yields
January 2014 – January 2015
The Canadian dollar sank in January as the Bank of Canada cut rates to help offset the impact of weaker commodity prices on its economy; investors anticipating a similar move from the Reserve Bank of Australia also pushed the Australian dollar lower
The Swiss franc soared against the euro and US dollar as the SNB removed the floor under the franc/euro exchange rate. The euro was lower against most currencies given the ECB’s expanded asset purchases and weak inflation reading
The weakest inflation in over a decade and the lowest gilt yields on record are causing the pound to sell off against a variety of currencies. Fears are also rising about the impact of lower oil revenues on government finances, but cheaper oil may be a net positive to the economy
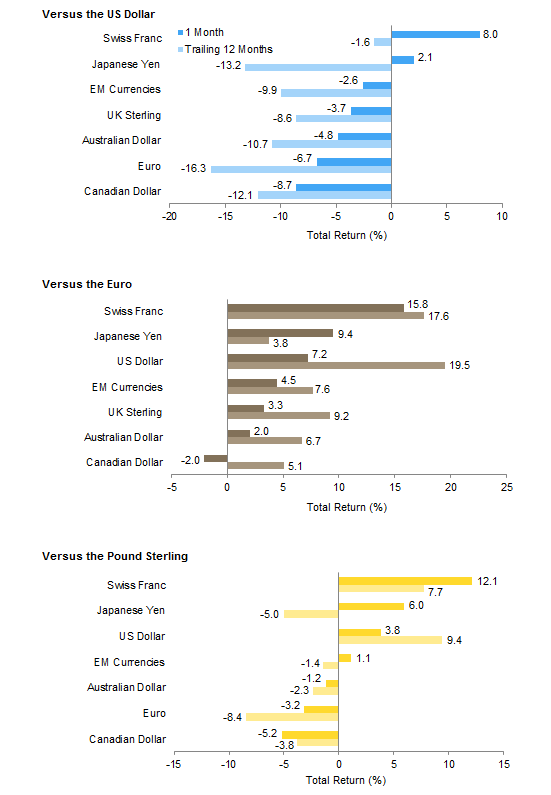
Currency Performance
As of January 31, 2015
Sources: MSCI Inc. and Thomson Reuters Datastream. MSCI data provided “as is” without any express or implied warranties.
Note: EM currencies is an equal-weighted basket of 20 currencies.
Exhibit Notes
Performance Exhibits
Total returns for MSCI developed markets indexes are net of dividend taxes. Total returns for MSCI emerging markets indexes are gross of dividend taxes.
US dollar index performance chart includes performance for the Barclays Corporate Investment Grade, Barclays High Yield Bond, Barclays Municipal Bond, Barclays US TIPS, Barclays US Treasuries, BofA Merrill Lynch 91-Day Treasury Bills, FTSE® NAREIT All Equity REITs, J.P. Morgan ELMI+, J.P. Morgan GBI-EM Global Diversified, MSCI Emerging Markets, MSCI World, and S&P GSCI™ indexes.
Euro index performance chart includes performance for the Barclays Euro-Aggregate: Corporate, Barclays Pan- Euro High Yield, Citigroup EMU Govt Bonds, FTSE® EPRA/NAREIT Europe ex UK RE, J.P. Morgan ELMI+, J.P. Morgan GBI-EM Global Diversified, MSCI Emerging Markets, MSCI Europe, MSCI Europe ex UK, MSCI World ex EMU, MSCI World, and S&P GSCI™ indexes.
UK sterling index performance chart includes performance for the Barclays Sterling Aggregate: Corporate Bond, BofA Merrill Lynch Sterling High Yield, FTSE® British Government All Stocks, FTSE® British Government Index- Linked All Stocks, FTSE® EPRA/NAREIT UK RE, J.P. Morgan ELMI+, J.P. Morgan GBI-EM Global Diversified, MSCI Emerging Markets, MSCI Europe ex UK, MSCI World, MSCI World ex UK, and S&P GSCI™ indexes.
Valuation Exhibits
The composite normalized P/E ratio is calculated by dividing the inflation-adjusted index price by the simple average of three normalized earnings metrics: ten-year average real earnings (i.e., Shiller earnings), trend-line earnings, and return on equity–adjusted earnings. We have removed the bubble years 1998–2000 from our mean and standard deviation calculations. All data are monthly.
Fixed Income Yields
US fixed income yields reflect Barclays Municipal Bond Index, Barclays US Corporate High Yield Bond Index, Barclays US Corporate Investment-Grade Bond Index, and the ten-year Treasury.
European fixed income yields reflect the BofA Merrill Lynch Euro Corporate AA Bond Index, BofA Merrill Lynch Euro Corporate Bond Index, Barclays Pan-European Aggregate High Yield Bond Index, Bloomberg Twenty-Year European Government Bond Index (nominal), ten-year German bund, 20-year European Inflation Swaps (inflation expectations), and the real yield calculated as the difference between the inflation expectation and nominal yield.
UK sterling fixed income yields reflect the BofA Merrill Lynch Sterling Corporate AA Bond Index, BofA Merrill Lynch Sterling Corporate Bond Index, UK ten-year gilts, and Bank of England 20-year nominal, real, and zero coupon (inflation expectations) yields.