Equity markets continued climbing in February. Emerging markets (EM) equities outperformed developed markets (DM) for the first time since September 2023, largely due to Chinese equities gaining nearly 9%. Within DM, Japan and the United States led performance, with both hitting new-all-time highs. For the former, it was the first new peak in 34 years. Investors’ preference for large caps and growth equities also continued. However, bond markets declined, as investors yet again delayed expectations for policy rate cuts, driving yields higher. Lower duration high-yield (HY) assets were the only broad global bond class to post positive returns. Commodities lagged on weak economic data despite a modest increase in oil prices. The US dollar gained, the euro and UK sterling mostly appreciated, while the yen mostly declined.
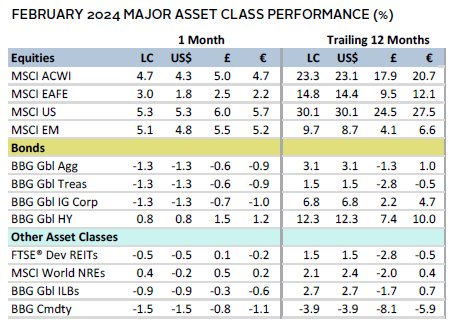
Sources: Bloomberg Index Services Limited, Bloomberg L.P., EPRA, FTSE International Limited, MSCI Inc., National Association of Real Estate Investment Trusts, and Thomson Reuters Datastream. MSCI data provided “as is” without any express or implied warranties.
Note: Local currency returns for the Bloomberg fixed income indexes, the Bloomberg Commodity Index, and the FTSE® Developed REITs are in USD terms.
The Macro Picture
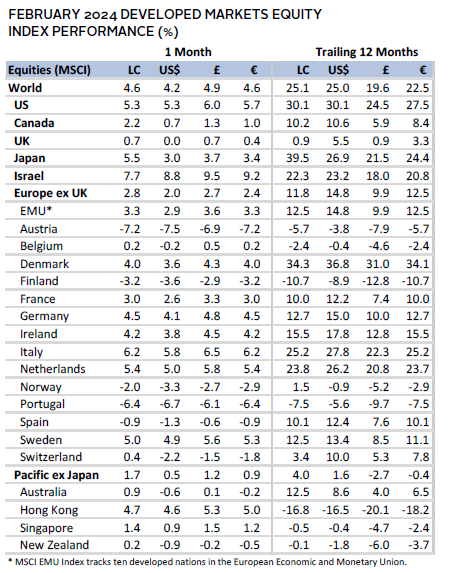
US equities continued to pace broader DM in February. Strong earnings from a handful of large technology companies predominantly drove the rally. The performance came despite higher US Treasury yields, as inflation surprised to the upside. This reinforced the Federal Reserve’s view that the path to lower rates would take longer than markets had priced in Q4 2023. While economic data generally remained resilient, consumer confidence and retail sales underwhelmed, and stress at a regional lender reignited concerns over real estate exposure.
Yields in Europe followed suit as markets adjusted expectations for central bank action despite a softening economic backdrop. The UK economy entered a technical recession in Q4 2023, although inflation in January came in lower than anticipated. Similarly, bund yields expanded, even as the German economy contracted. Nevertheless, the Eurozone avoided a technical recession, as higher growth from Spain and Italy buoyed the region. Japan’s economy also entered a technical recession in Q4. However, inflation data surprised to the upside, and markets priced in greater odds that the Bank of Japan (BOJ) would lift rates out of negative territory in the coming months. While some BOJ commentary supported this view, other economic data remained weak.
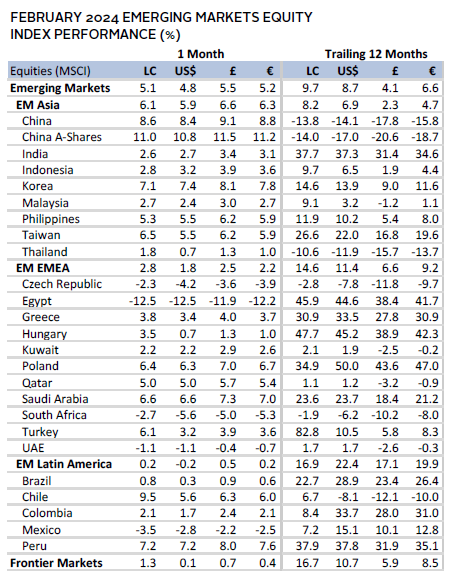
Chinese equities rallied, supporting broader EM performance. Authorities unveiled several stimulus measures targeted at supporting the stock market and property sector. Premier Li Qiang called for “pragmatic and forceful” action to boost investor confidence. Meanwhile, increased travel during the Lunar New Year holiday further boosted investor sentiment. Still, the economic picture remains mired by weak business sentiment, persistent deflation, and ongoing property sector malaise.
Equities
US equities led DM as some large-cap technology companies posted significant returns on strong earnings. Notably, Nvidia advanced nearly 30% in February, helping to propel the market once again to all-time highs. While growth strategies continued to outperform value, returns were broad based, as small caps edged large caps. Among sectors, consumer discretionary and industrials led, while interest rate–sensitive utilities and real estate lagged. Interestingly, recent earnings results attributed the strongest revenue growth in Q4 2023 to real estate, and the weakest to the energy sector. Overall, earnings pointed to 4% growth in 2023, more than double the rate indicated in December 2023.
A hotter-than-expected inflation reading from the Consumer Price Index (CPI) drove yields higher as investors yet again delayed expectations for a policy rate cut. Some investors downplayed inflation concerns as it was largely driven by one-time annual price increases and other technical factors. Others were concerned with stickier shelter inflation, as price gains remained robust. The Personal Consumption Expenditures Price Index, however, was in line with expectations, decelerating to 2.4% year-over-year (YOY), perpetuating the belief that the Fed could cut as soon as June. Parts of the economy did disappoint, with softer-than-expected retail sales declining 0.8% in January, while consumer confidence unexpectedly fell. Although manufacturing PMI hit a 20-month high, new orders for durable goods declined more than expected. The latter was heavily influenced by lower aircraft orders from the troubled Boeing; however, growth in other segments was also lackluster.
European equities lagged the broader DM index, with Europe ex UK outperforming UK equities.
The Eurozone managed to narrowly avoid a technical recession in Q4, and while consumer confidence improved slightly, other sentiment indicators worsened more than expected. Indeed, German industrial production fell by 1.6% in December, and the Eurozone’s February manufacturing PMI remained in contractionary territory for the 20th consecutive month. Data were partly driven by input cost pressures remaining elevated. However, comments from a European Central Bank (ECB) member earlier in the month stated that energy price shocks were fading and that the economy was likely bottoming out, with peak transmission from central bank policy having been likely realized. Headline inflation data released right after month end at 2.6% YOY was slightly hotter than expected, driving the market to price in a probable rate cut in June.
UK equities lagged as data showed the country entered a technical recession in Q4, with GDP shrinking by more than expected at -0.3%. Inflation was lower than expected at 4%, but consumer confidence worsened as strong flash services PMI data pointed to persistent inflationary pressures. Additionally, regulators reduced the energy price cap by 12%, effective in April, but with prices still above pre-Russia/Ukraine war levels, households remain strained. Consumers did get some relief with annual shop-price inflation falling to its lowest rate in nearly two years, largely driven by slower food price increases. Meanwhile, the Bank of England (BOE) expressed optimism, given early signs of economic improvement.
Japanese equities led DM counterparts in local currency terms, hitting their first new all-time highs in 34 years. However, they lagged in US dollar terms as the yen continued to lose ground, depreciating to 150/US dollar in February. The government has previously intervened to support the yen at these levels. The economy entered a technical recession in Q4 2023, contracting 0.4% against expectations of 1.4% growth, driven by disappointing domestic consumption. Declining industrial production and lower imports in January also highlighted ongoing economic weakness. Inflation slowed to 2.2% YOY in January, the softest pace since March 2022, but was still hotter than expected. This added to expectations that the BOJ will lift its policy rate out of negative territory by June. However, rates are unlikely to move materially above zero, failing a robust economic recovery. Wage negotiations will likely be a key factor in determining the degree of tightening, where real wage growth has been negative.
Pacific ex Japan equities lagged other DM markets. Hong Kong stocks led, rebounding after poor returns in January and a decline of nearly 15% in 2023. Investors became more optimistic on policy support for the economy, particularly the property sector. In Australia, the central bank held policy rates at 4.35% in February, but warned that with demand still strong, further rate hikes were possible. While data showed private sector activity rebounded, retail sales were soft. However, with the inflation rate unchanged in January, investors expect the Reserve Bank of Australia is unlikely to hike soon. Meanwhile in New Zealand, the central bank struck a less hawkish tone than its last meeting and left its policy rate unchanged at 5.5%, while lowering the outlook for its peak rate, citing inflation risks were more balanced.
Sources: MSCI Inc. and Thomson Reuters Datastream. MSCI data provided “as is” without any express or implied warranties.
Emerging markets equities outperformed DM, after lagging last month and in 2023. Asia led performance among regions, while Latin America and Europe, Middle East & Africa lagged. China’s positive returns of nearly 9% certainly helped, but gains were generally broad based across most major countries in the index.
Chinese equities rebounded on the introduction of various support measures to help the property sector and stock market. These included certain limits on selling stocks, lowering restrictions on homebuying, and cutting the five-year loan prime rate by 25 basis points (bps), which was more than the 10-bp cut anticipated by the market. These measures came against a backdrop of a faltering economy, including falling housing prices, where secondhand house prices declined at the steepest rate in nine years. Indeed, manufacturing PMI contracted for a fifth consecutive month, largely driven by declines in production and exports. However, services PMI reached the highest level since July 2023. Investors were also encouraged as domestic tourism jumped 19% from 2019 levels during the Lunar New Year holiday.
Tech-heavy Taiwanese and Korean markets were up mid-single digits on enthusiasm for semiconductor demand from artificial intelligence. The potential of stock market reforms in Korea also boosted the market, although the actual unveiling generally under-whelmed. In addition, the Bank of Korea held its policy rate steady, maintaining its growth and inflation outlook. Meanwhile, despite strong performance in recent years, Mexican equities struggled as the Banco de México lowered its 2024 growth outlook, while holding its policy rate steady for the seventh consecutive month. However, the central bank did signal cuts were nearing, as some board members expressed concern against being too restrictive.
Sources: MSCI Inc. and Thomson Reuters Datastream. MSCI data provided “as is” without any express or implied warranties.
Fixed Income
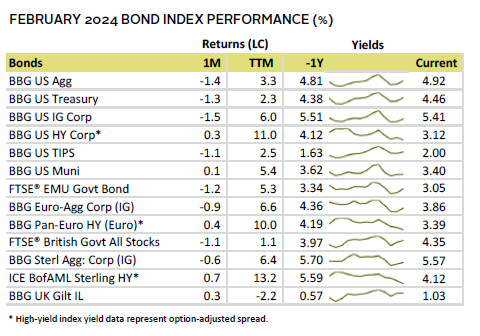
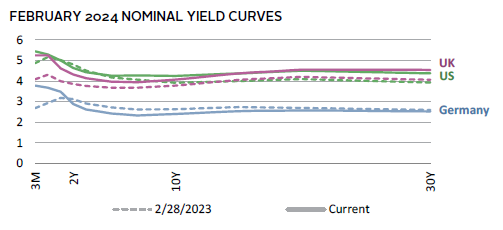
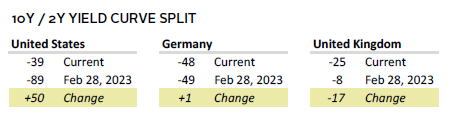
US fixed income assets mostly declined, reversing course from the stellar Q4 returns. Investors yet again delayed expectations for when the Fed would cut its policy rate on a stronger-than-expected inflation reading from the CPI. Market expectations have now converged near the Fed’s latest forecast of 75 bps of cuts in 2024. Yields were higher across the curve, with the two-year yield rising more than the ten-year, widening the ten-year/two-year yield curve inversion to -39 bps. Lower duration HY corporate bonds outperformed their investment-grade (IG) counterparts. Spreads for HY bonds declined by 100 bps YOY, whereas yields for IG corporate bonds narrowed by just 10 bps. Munis also posted positive returns on increased investor demand.
European government bonds also faltered, and together with IG corporates, underperformed HY bonds. The German yield curve inverted further with the two-year bund yields rising more than the ten-year, almost doubling the spread between the two tenures versus January, reflecting investor nervousness about the country’s weakening economic backdrop. UK fixed income assets were mixed, with HY and inflation-linked bonds leading. Investors drove yields higher despite the economy entering a technical recession and core inflation coming in lower than expected. The gilt yield curve became more inverted, even as ten-year gilt yields closed the month above 4% for the first time since November.
Sources: Bank of England, Bloomberg Index Services Limited, Federal Reserve, FTSE Fixed Income LLC, FTSE International Limited, Intercontinental Exchange, Inc., and Thomson Reuters Datastream.
Real Assets
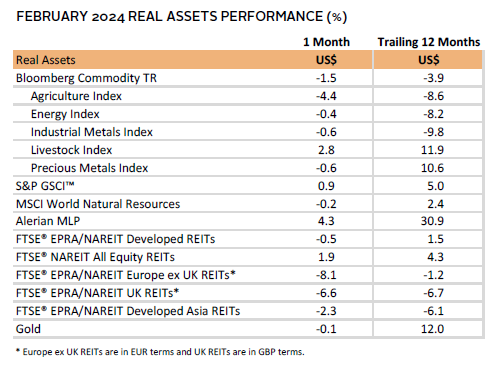
Real assets were mostly weak in February, with signs of lackluster demand and higher yields continuing to weigh on the broad asset class. Commodity futures were mixed. Weak economic data from China and news of two DM countries (Japan and the United Kingdom) entering a technical recession weighed on prices, including industrial metals such as copper.
Oil prices ($83.62 for Brent and $78.26 for WTI) increased moderately in February. The gain was lower than in January, as risk-off sentiment dominated on a weaker global economic outlook. Higher-than-expected inventory builds in the United States also weighed on prices. However, prices remained broadly supported as OPEC+ is expected to prolong its production cuts.
Global natural resources equities posted modest declines as lower metals prices offset support from higher oil prices. Earnings results also weighed on the index as energy and materials companies posted the worst earnings growth of all sectors in Q4 2023.
REITs performance was negative again in February, as the interest rate–sensitive sector contended with higher yields on further delayed expectations of policy rate cuts. In the United States, the real estate sector came in focus, as news of stress at a regional bank brought financing concerns for commercial real estate to the forefront again.
Gold prices ($2,045.45) also came under pressure due to higher yields, offsetting the price gains typically seen in times of geopolitical turmoil. The yellow metal also struggled as the US dollar strengthened.
Sources: Alerian, Bloomberg L.P., EPRA, FTSE International Limited, Intercontinental Exchange, Inc., MSCI Inc., National Association of Real Estate Investment Trusts, Standard & Poor’s, and Thomson Reuters Datastream. MSCI data provided “as is” without any express or implied warranties.
Note: Gold performance based on spot price return.
USD-Based Investors
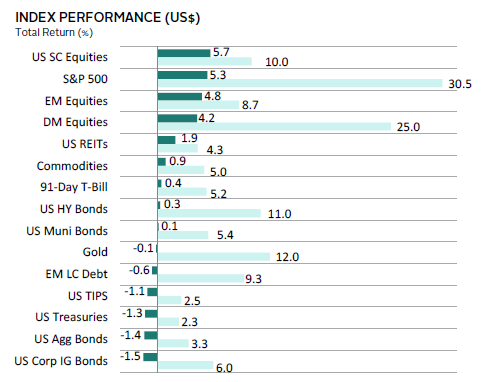
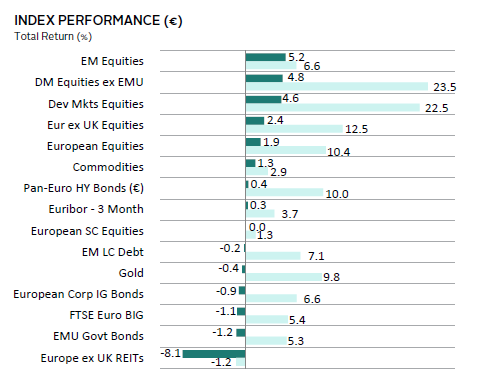
Risk assets were mixed in February. Small-cap equities led on encouraging economic data. Likewise, the S&P 500 touched new all-time highs, driven mostly by a handful of large-cap technology stocks. EM led DM on strong performance in China as the government issued support measures to boost the stock market and economy. Other Asian markets also advanced on technology sector gains. Yields expanded as investors delayed rate cut expectations on elevated inflation, resulting in fixed income assets lagging. Still, lower duration cash and HY bonds gained.
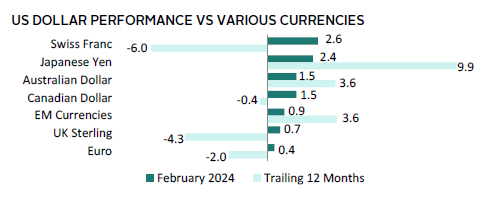
The US dollar broadly advanced as investors yet again delayed expectations of interest rate cuts. This pushed yields higher, improving the interest rate differential to favor the US dollar. The greenback gained most versus the Swiss franc and Japanese yen among the major global currencies we track. Over the last 12 months, it declined the most versus the Swiss franc and UK sterling.
Some investors downplayed inflation concerns stemming from the hotter-than-expected CPI data, as it was largely driven by one-time annual price increases and other technical factors. Others were concerned with stickier shelter inflation, as price gains remained robust. The Personal Consumption Expenditures Price Index, however, was in line with expectations, decelerating to 2.4% YOY, perpetuating the belief that the Fed could cut as soon as June. Parts of the economy did disappoint, with softer-than-expected retail sales declining 0.8% in January, while consumer confidence unexpectedly fell. Although manufacturing PMI hit a 20-month high, new orders for durable goods declined more than expected. The latter was heavily influenced by lower aircraft orders from the troubled Boeing; however, growth in other segments was also lackluster.
Sources: Bloomberg Index Services Limited, FTSE International Limited, Frank Russell Company, Intercontinental Exchange, Inc., J.P. Morgan Securities, Inc., MSCI Inc., National Association of Real Estate Investment Trusts, Standard & Poor’s, and Thomson Reuters Datastream. MSCI data provided “as is” without any express or implied warranties.
EUR-Based Investors
Risk assets were mixed in February. EM stocks led on strong performance in China as the government issued support measures to boost the stock market and economy. Other Asian markets also advanced on technology sector gains. Europe ex UK equities lagged broader DM counterparts as Japanese and US equities continued to lead the group. Yields expanded on the back of investors delaying rate cut expectations in the United States, resulting in interest rate–sensitive Europe ex UK REITs and fixed income assets lagging. Still, lower duration HY bonds and cash gained.
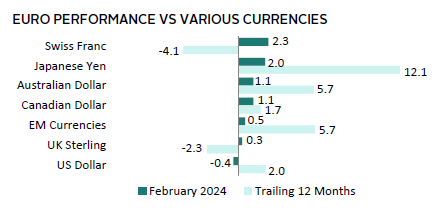
The euro was broadly positive, lagging only versus the US dollar among the major global currencies we track. The common currency gained the most against the Swiss franc and Japanese yen. Over the last 12 months, the euro was mostly stronger, declining only relative to the Swiss franc and UK sterling.
The Eurozone managed to narrowly avoid a technical recession in Q4, and while consumer confidence improved slightly, other sentiment indicators worsened more than expected. Indeed, German industrial production fell by 1.6% in December, and the Eurozone’s February manufacturing PMI remained in contractionary territory for the 20th consecutive month. Data were partly driven by input cost pressures remaining elevated. However, comments from an ECB member earlier in the month stated that energy price shocks were fading and that the economy was likely bottoming out, with peak transmission from central bank policy having been likely realized. Headline inflation data released right after month end at 2.6% was slightly hotter than expected, driving the market to price in a probable rate cut in June.
Sources: Bloomberg Index Services Limited, EPRA, European Banking Federation, FTSE Fixed Income LLC, FTSE International Limited, Intercontinental Exchange, Inc., J.P. Morgan Securities, Inc., MSCI Inc., National Association of Real Estate Investment Trusts, Standard & Poor’s, and Thomson Reuters Datastream. MSCI data provided “as is” without any express or implied warranties.
GBP-Based Investors
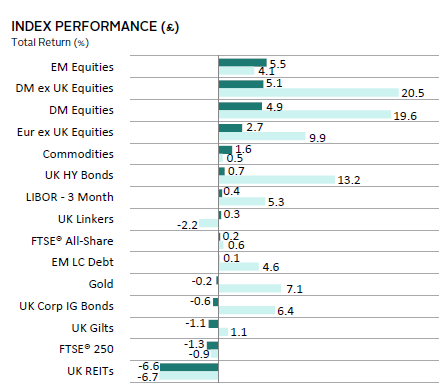
Risk assets were mixed in February. EM stocks led on strong performance in China as the government issued support measures to boost the stock market and economy. Other Asian markets also advanced on technology sector gains. UK equities lagged broader DM counterparts as the economy entered a technical recession. UK gilt yields expanded, resulting in interest rate–sensitive UK REITs and fixed income assets lagging. Still, lower duration HY bonds and cash outperformed.
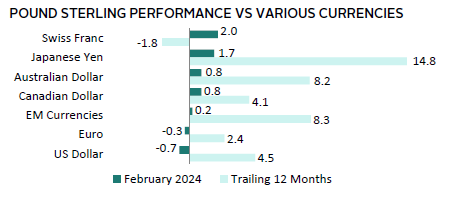
UK sterling was mostly positive, declining only versus the US dollar and euro among the major global currencies we track. Similarly, over the last 12 months the UK sterling mostly strengthened, save for against the Swiss franc. Relatively tighter monetary policy has resulted in interest rate differentials supportive of the UK sterling.
The UK economy entered a technical recession in Q4, with GDP shrinking by more than expected at -0.3%. Inflation was lower than expected at 4%, but consumer confidence worsened as strong flash services PMI data pointed to persistent inflationary pressures. Additionally, regulators reduced the energy price cap by 12%, effective in April, but with prices still above pre-Russia/Ukraine war levels, households remain strained. Consumers did get some relief with annual shop-price inflation falling to its lowest rate in nearly two years, largely driven by slower food price increases. Meanwhile, the BOE expressed optimism, given early signs of economic improvement.
Sources: Bloomberg Index Services Limited, EPRA, FTSE International Limited, Intercontinental Exchange, Inc., J.P. Morgan Securities, Inc., MSCI Inc., National Association of Real Estate Investment Trusts, Standard & Poor’s, and Thomson Reuters Datastream. MSCI data provided “as is” without any express or implied warranties.
Performance Exhibits
All data are total returns unless otherwise noted. Total return data for all MSCI indexes are net of dividend taxes.
USD-Based Investors index performance chart includes performance for the Bloomberg US Aggregate Bond, Bloomberg US Corporate Investment Grade, Bloomberg US High Yield Bond, Bloomberg Municipal Bond, Bloomberg US TIPS, Bloomberg US Treasuries, ICE BofAML 91-Day Treasury Bills, FTSE® NAREIT All Equity REITs, J.P. Morgan GBI-EM Global Diversified, LBMA Gold Price, MSCI Emerging Markets, MSCI World, Russell 2000®, S&P 500, and S&P GSCI™ indexes.
EUR-Based Investors index performance chart includes performance for the Bloomberg Euro-Aggregate: Corporate, Bloomberg Pan-Euro High Yield (Euro), EURIBOR 3M, FTSE EMU Govt Bonds, FTSE Euro Broad Investment-Grade Bonds, FTSE® EPRA/NAREIT Europe ex UK RE, J.P. Morgan GBI-EM Global Diversified, LBMA Gold Price AM, MSCI Emerging Markets, MSCI Europe, MSCI Europe ex UK, MSCI Europe Small-Cap, MSCI World ex EMU, MSCI World, and S&P GSCI™ indexes.
GBP-Based Investors index performance chart includes performance for the Bloomberg Sterling Aggregate: Corporate Bond, Bloomberg Sterling Index-Linked Gilts, ICE BofAML Sterling High Yield, FTSE® 250, FTSE® All-Share, FTSE® British Government All Stocks, FTSE® EPRA/NAREIT UK RE, J.P. Morgan GBI-EM Global Diversified, LBMA Gold Price AM, LIBOR 3M GBP, MSCI Emerging Markets, MSCI Europe ex UK, MSCI World, MSCI World ex UK, and S&P GSCI™ indexes.
EM currencies is an equal-weighted basket of 20 emerging markets currencies.
Fixed Income Performance Table
Performance data for US TIPS reflect the Bloomberg US TIPS Index, with yields represented by the Bloomberg Global Inflation Linked Bond Index: US.