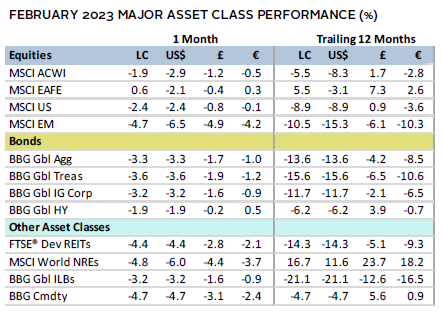
Risk assets broadly declined in February, reversing some of the rally from the last several months. Global equities mostly declined; emerging markets (EM) trailed broad developed markets (DM) equivalents, while US lagged DM ex US peers. Growth bested value and small caps topped large caps again on the month. Yields rose to their highest levels this cycle across multiple maturities in major economies as bonds broadly declined. Real assets categories mostly fell, facing a strong US dollar and concerns over the impact of central bank actions on global growth. The US dollar and UK sterling strengthened, while the euro was mixed.
Sources: Bloomberg Index Services Limited, Bloomberg L.P., EPRA, FTSE International Limited, MSCI Inc., National Association of Real Estate Investment Trusts, and Thomson Reuters Datastream. MSCI data provided “as is” without any express or implied warranties.
Note: Local currency returns for the Bloomberg fixed income indexes, the Bloomberg Commodity Index, and the FTSE® Developed REITs are in USD terms.
The Macro Picture
Investor optimism reversed in February, as they began to question whether a soft landing—a scenario where inflation comes down with only a relatively mild recession—was still achievable. Markets repriced their forward rate expectations higher on the markedly resilient economy. Data releases—particularly in the United States—exhibited continued strength in labor markets, robust consumer spending, and an unanticipated expansion of the services sector. Statements from the European Central Bank (ECB) and the Federal Reserve provided further support for more rate hikes. Late in the month, hotter-than-expected inflation readings in the United States, France, and Spain increased concerns that inflation may prove more stubborn than hoped. As a result, equity prices declined, bond yields rose, and the US dollar strengthened for the first time in five months, reviving headwinds for non-US assets—particularly in emerging markets.
Despite resilient economic data, corporate earnings disappointed. European firms have outperformed other major developed regions so far, albeit with near-zero earnings per share (EPS) growth. However, when energy companies—which are still experiencing record growth—are excluded, earnings growth in all major regions declined by mid-to-high single digits. Net profit margins also slipped across the board, indicating stronger headwinds for future earnings growth. Looking forward, bottom-up equity analysts continue to trim earnings growth estimates, pointing to a no-growth scenario for 2023 in many major economies.
Equities
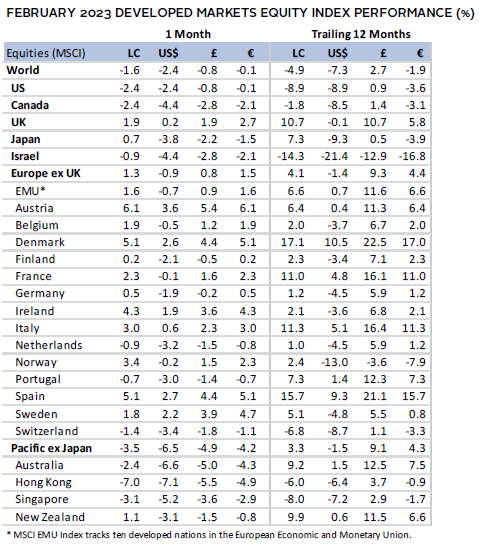
US equities declined, trailing developed ex US counterparts, but the returns were more comparable in common currency terms, given US dollar strength in February. Ten of 11 S&P 500 sectors declined: energy, real estate, and utilities declined the most, while information technology, industrials, and consumer discretionary outperformed the most. Additionally, small caps topped large-cap peers. Corporate earnings declined 5% year-over-year (YoY) in fourth quarter, predominantly driven lower by the communication services, materials, and consumer discretionary sectors, where EPS contracted by nearly 25%.
Equity declines were driven by investors anticipating that the Fed would have to hike rates further than previously believed, given a slew of strong economic data releases. The labor market continued to display resiliency, with initial unemployment claims below 200,000 for six consecutive weeks through month end, matching its second longest run since 1969. Consumer spending jumped by the highest rate in nearly two years. The Personal Consumption Expenditure Price Index—the Fed’s preferred inflation metric—rose 0.6% month-on-month, topping expectations. Other major metrics—including headline and core CPI and producer price inflation—all registered hotter than anticipated. Federal Open Market Committee (FOMC) meeting notes revealed greater-than-expected consensus among voting members for the Fed’s February 25-basis point (bp) rate hike, reinforcing higher rate hike expectations. Futures markets priced a roughly 80% likelihood that the Fed would raise its benchmark rate to a target range of at least 5.25% to 5.50% by their June meeting, up from just a 2% probability near the beginning of the month.
European equities advanced in February, outperforming broader developed markets for the fourth consecutive month. Optimism was driven by evidence that the Continent has weathered the brunt of its energy crisis, as natural gas prices fell to near 18-month lows. UK equities topped Europe ex UK equivalents for the month and over the trailing 12-month period, boosted by the country’s heavy tilt toward value stocks and the weakening UK sterling.
UK economic data releases were broadly better than feared. YoY retail sales and industrial production declined less than expected, headline inflation tempered more than anticipated, and fourth quarter GDP was flat, meaning the country narrowly avoided a technical recession. Yet, inflation in the United Kingdom remains above 10%—the highest among major economies—and the country is still the only G7 economy yet to surpass its pre-COVID size, with GDP 0.8% lower than at year-end 2019. The Bank of England (BOE) raised its benchmark policy rate 50 bps to 4%, in line with expectations, but softened its tone on the future path of rate rises in the official meeting minutes. The United Kingdom also clinched a breakthrough trade deal with the EU on protocol for the land border along Northern Ireland, which had been a sticking point since the early days of Brexit negotiations.
The ECB raised its benchmark deposit rate 50 bps to 2.5% and pledged another 50-bp hike at its March meeting. Headline inflation retreated faster than expected in January, helped by receding energy and food prices. However, unchanged core inflation and unexpectedly high flash February CPI readings in France and Spain raised fears over increased borrowing costs across the monetary union. Swap markets now imply an ECB deposit rate of 4% by year end, which would represent another 150 bps of rate hikes from today’s rate.
Japanese equities advanced, topping broader developed markets; however, in major currency terms the country lagged due to Japanese yen weakness. Prime Minister Fumio Kishida nominated economist Kazuo Ueda as his pick to replace outgoing Bank of Japan (BOJ) Governor Haruhiko Kuroda, whose term expires in April. Ueda is widely viewed as a surprise pick, and, if approved, is expected to gradually shift the BOJ away from yield curve controls with ultra-low rates. The BOJ remains the only major central bank that has not tightened monetary policy in a meaningful way. GDP returned to growth in calendar fourth quarter but significantly lagged consensus estimates. January economic data were mixed, as retail sales topped consensus, industrial production declined faster than anticipated, and inflation—although low relative to other countries—reached a fresh 40-year high.
Pacific ex Japan equities declined and trailed the broader DM index. In major currency terms, Hong Kong, Singapore, and Australia suffered the worst losses among all DM countries. Hong Kong’s and Singapore’s underperformances were largely because of significant declines in their respective financial sectors, while Australia’s underperformance was due to a combination of financials and materials sectors. Fourth quarter GDP grew at 1.9% annualized in Australia, lagging expectations. The Reserve Bank of Australia (RBA) raised its benchmark cash rate 25 bps to 3.35%. RBA Governor Philip Lowe indicated more rate hikes to come, noting he expects inflation to recede to 3% by mid-2025—still at the top end of its 2% to 3% target range. The Reserve Bank of New Zealand raised its benchmark cash rate 50 bps to 4.75%—in line with expectations—and similarly alluded to additional hikes, citing excessive core consumer price inflation, employment beyond maximum sustainable levels, and elevated near-term inflation expectations.
Sources: MSCI Inc. and Thomson Reuters Datastream. MSCI data provided “as is” without any express or implied warranties.
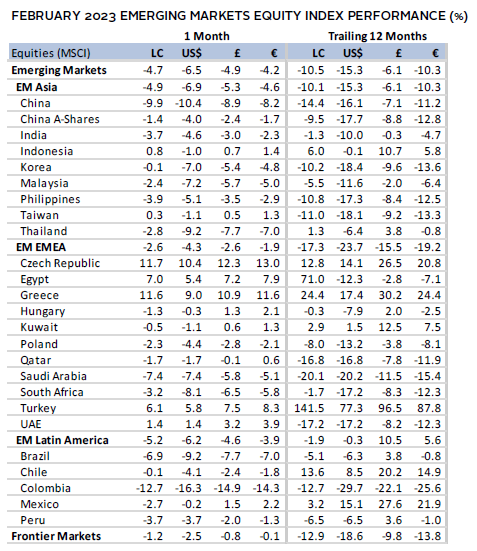
Emerging markets equities declined in February, undoing most of its gains in January and lagging its DM peers for the first time in four months. Similar to developed markets, EM equities were dented by concerns of higher inflation prints and greater repricing of risk. China accounted for more than two-thirds of the broad index’s decline—trailing all other major emerging countries—as investors tempered their expectations for the economic rebound from its reopening. The decline in Chinese shares caused emerging Asia to lag the broader EM index. Latin America also lagged, while emerging Europe, Middle East & Africa held up better than the other regions. Among other major emerging countries, Brazil and Saudi Arabia lagged the broad index; India, Korea, and South Africa declined but outperformed; and Taiwan advanced.
EM central banks, which have been ahead of the major DM peers in raising rates this cycle, shifted to more hawkish policy stances. The Reserve Bank of India raised its benchmark policy rate 25 bps and surprised economists by leaving the door open for further rate hikes. Banco de México stunned markets by raising their benchmark rate by 50 bps—a Bloomberg economists’ poll had unanimously estimated a quarter-point raise—after domestic inflation had picked up. The Bank of Korea left its benchmark rate unchanged but remained open to further rate hikes, despite facing economic contraction and shrinking exports, which make up more than 40% of the country’s GDP.
Sources: MSCI Inc. and Thomson Reuters Datastream. MSCI data provided “as is” without any express or implied warranties.
Fixed Income
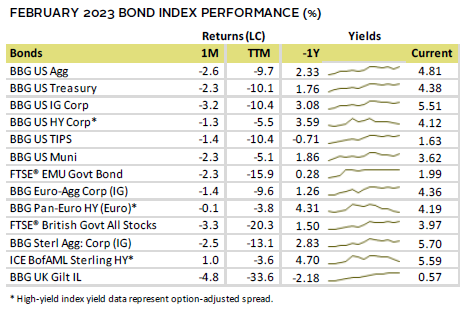
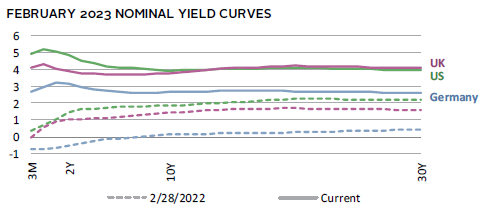
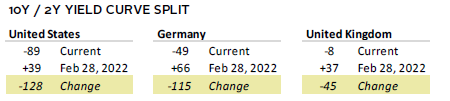
US fixed income assets fell across the board in February, as market participants adjusted their Fed rate hike expectations higher, causing yields to rise across maturities. High-yield corporates topped investment-grade peers and Treasuries bested investment-grade corporates. Five- and ten-year Treasury yields rose 55 bps and 40 bps to 4.18% and 3.92%, respectively. All tenors two years and below reached new highs this cycle that had not been seen since just before the Global Financial Crisis. Notably, the six-month and one-year yields climbed above 5%. The ten-year/two-year yield curve spread expanded to its most inverted level this cycle. US breakeven inflation rates rose well off their mid-January lows, indicating bond market participants expect US inflation to remain above 2% for the foreseeable future.
Euro-denominated bonds declined; EMU government bonds fell the most, as worries over accelerating inflation and stronger-than-expected economic data led investors to price in higher ECB policy rates. German ten-year yields rose 36 bps to 2.63%—their highest level in more than a decade—and multiple tenors across the yield curve climbed to new cycle highs. Sterling-denominated bonds mostly declined. Investment-grade corporates held on better than gilts, while high-yield corporates advanced. Linkers declined the most among major bond categories and have lost roughly one-third of their value over the last 12 months. Five- and ten-year gilt yields advanced 47 bps and 37 bps to 3.68% and 3.78%, respectively.
Real Assets
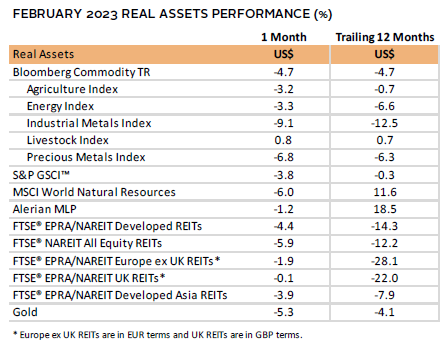
Commodity futures fell in February as most major sub-categories declined. Industrial metals declined the most, impacted by weaker demand fundamentals than expected from China’s reopening and a bullish US dollar. Energy prices declined more modestly.
Oil prices ($83.89 for Brent and $77.05 for WTI) slightly declined again in February, reflecting ongoing mixed signals. A stronger dollar, uncertainty over economic growth, and new expectations for record production outweighed excitement for China’s reopening and strong economic data from many major economies. The International Energy Agency upgraded their forecast for 2023 production to record levels, with the United States, Brazil, Norway, Canada, and Guyana all expected to increase production, in part to address the loss of barrels from Russia. Russia responded to the West’s recent price caps on its oil and oil products by announcing production cuts of 500,000 barrels per day beginning in March. Oil prices are likely to remain in flux, given the uncertain supply and demand outlook.
Global natural resources equities and energy MLPs declined in February as energy prices fell and support for windfall taxes across some major economies gained steam.
Global REITs declined on sharp interest rate increases in February and remain deeply in the red over the trailing 12 months.
Gold prices fell to $1,825.97/troy ounce, its first retreat in four months and the steepest decline in nearly two years. US dollar strength and rising interest rates expectations created a stronger headwind for the non-yielding asset priced in USD terms.
Sources: Alerian, Bloomberg L.P., EPRA, FTSE International Limited, Intercontinental Exchange, Inc., MSCI Inc., National Association of Real Estate Investment Trusts, Standard & Poor’s, and Thomson Reuters Datastream. MSCI data provided “as is” without any express or implied warranties.
Note: Gold performance based on spot price return.
USD-Based Investors
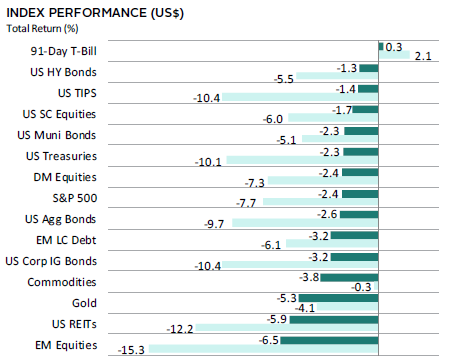
Risk assets broadly declined in February, reversing some of the rally from the last several months. EM equities lagged all other major asset classes, while US stocks performed in line with broader developed markets. Among fixed income asset classes, US high-yield corporates and TIPS held up better than US investment-grade corporates and nominal Treasury equivalents. Real assets declined, as US REITs and gold sank more than broader commodities. Cash was the only asset class to advance both in February and over the trailing 12-month period.
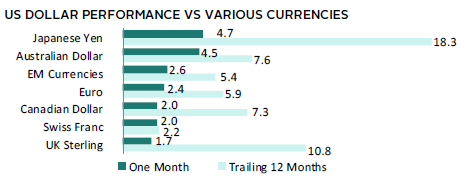
US dollar reversed course, gaining in February and resuming its longer-term strength—the greenback is up relative to all other major currencies over the past 12 months. The US dollar gained the most over both periods vis-à-vis the Japanese yen, which faces headwinds as the only major economy to maintain loose monetary policy. The greenback gained the least over the last 12 months versus the safe-haven Swiss franc.
Equity declines were driven by investors anticipating that the Fed would have to hike rates further than previously believed, given a slew of strong economic data releases. The labor market continued to display resiliency, with initial unemployment claims below 200,000 for six consecutive weeks through month end, matching its second longest run since 1969. Consumer spending jumped by the highest rate in nearly two years. The Personal Consumption Expenditure Price Index—the Fed’s preferred inflation metric—rose 0.6% month-on-month, topping expectations. Other major metrics—including headline and core CPI and producer price inflation—all registered hotter than anticipated. FOMC meeting notes revealed greater-than-expected consensus among voting members for the Fed’s February 25-basis point (bp) rate hike, reinforcing higher rate hike expectations.
Sources: Bloomberg Index Services Limited, FTSE International Limited, Frank Russell Company, Intercontinental Exchange, Inc., J.P. Morgan Securities, Inc., MSCI Inc., National Association of Real Estate Investment Trusts, Standard & Poor’s, and Thomson Reuters Datastream. MSCI data provided “as is” without any express or implied warranties.
EUR-Based Investors
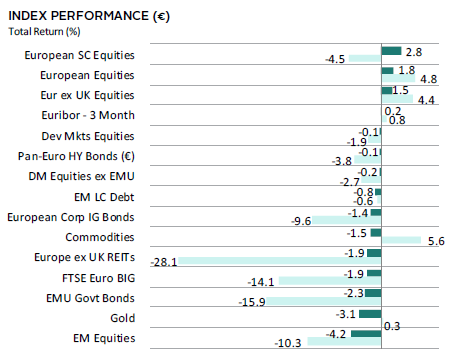
Risk assets mostly declined in February, reversing some of the rally from the last several months. Equities were mixed—European stocks advanced, outperforming broader developed markets for the fourth consecutive month, driven by optimism that the Continent has weathered the brunt of its energy crisis. However, EM equities declined the most, trailing DM peers. Among fixed income asset classes, EMU government bonds lagged as worries over accelerating inflation and stronger-than-expected economic data led investors to price in higher ECB policy rates. Real assets declined, as gold sank more than broad commodities and Europe ex UK REITs. Over the last 12 months, only European equities, cash, and USD-priced commodities have advanced.
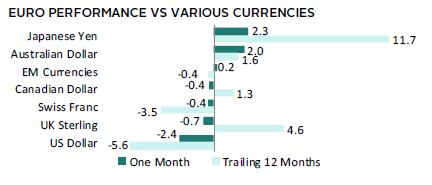
The euro was mixed in February, falling the most vis-à-vis the US dollar and UK sterling, and advancing the most against the broadly weaker Japanese yen and commodity-linked Australian dollar. Over the past 12 months, the common currency was also mixed, gaining the most versus the Japanese yen and UK sterling, and declining vis-à-vis the safe-haven US dollar and Swiss franc.
The ECB raised its benchmark deposit rate 50 bps to 2.5% and pledged another 50-bp hike at its March meeting. Headline inflation retreated faster than expected in January, helped by receding energy and food prices. However, unchanged core inflation and unexpectedly high flash February CPI readings in France and Spain raised fears over increased borrowing costs across the monetary union. Swap markets now imply an ECB deposit rate of 4% by year end, which would represent another 150 bps of rate hikes from today’s rate.
Sources: Bloomberg Index Services Limited, EPRA, European Banking Federation, FTSE Fixed Income LLC, FTSE International Limited, Intercontinental Exchange, Inc., J.P. Morgan Securities, Inc., MSCI Inc., National Association of Real Estate Investment Trusts, Standard & Poor’s, and Thomson Reuters Datastream. MSCI data provided “as is” without any express or implied warranties.
GBP-Based Investors
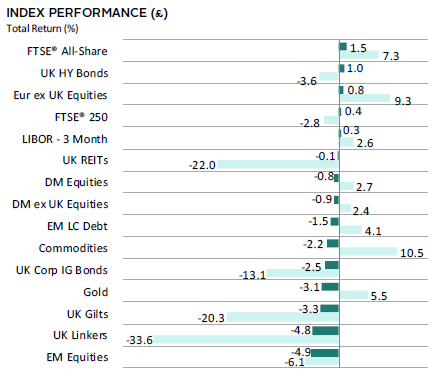
Risk assets mostly declined in February, reversing some of the rally from the last several months. Equities were mixed. European stocks outpaced broader developed markets, driven by optimism that the Continent has weathered the brunt of its energy crisis. UK stocks outpaced Europe ex UK peers. However, EM equities declined the most, trailing DM peers. Among fixed income asset classes, UK gilts and linkers declined the most, suffering from higher inflation and a weaker economic outlook in the United Kingdom. UK high-yield bonds outperformed investment-grade corporate peers and were the only fixed income category to advance. Real assets declined, as gold sank more than UK REITs and broad commodities. Over the last 12 months, returns were more mixed, with gains largely driven by GBP weakness.
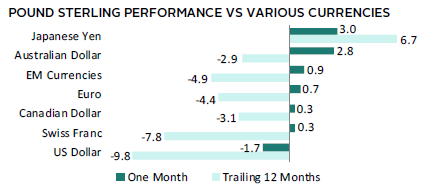
UK sterling broadly advanced, gaining the most against the Japanese yen and commodity-linked Australian dollar, and only declining against the US dollar. Over the last 12 months, UK sterling declined against all major currencies, save for the broadly weaker Japanese yen, which faces headwinds as the only major economy to maintain loose monetary policy. UK sterling experienced particularly steep declines versus the safe-haven US dollar and Swiss franc.
UK economic data releases were broadly better than feared. YoY retail sales and industrial production declined less than expected, headline inflation tempered more than anticipated, and fourth quarter GDP was flat, meaning the country narrowly avoided a technical recession. Yet, inflation in the United Kingdom remains above 10%—the highest among major economies—and the country is still the only G7 economy yet to surpass its pre-COVID size, with GDP 0.8% lower than at year-end 2019. The BOE raised its benchmark policy rate 50 bps to 4%, in line with expectations, but softened its tone on the future path of rate rises in the official meeting minutes.
Sources: Bloomberg Index Services Limited, EPRA, FTSE International Limited, Intercontinental Exchange, Inc., J.P. Morgan Securities, Inc., MSCI Inc., National Association of Real Estate Investment Trusts, Standard & Poor’s, and Thomson Reuters Datastream. MSCI data provided “as is” without any express or implied warranties.
Performance Exhibits
All data are total returns unless otherwise noted. Total return data for all MSCI indexes are net of dividend taxes.
USD-Based Investors index performance chart includes performance for the Bloomberg US Aggregate Bond, Bloomberg US Corporate Investment Grade, Bloomberg US High Yield Bond, Bloomberg Municipal Bond, Bloomberg US TIPS, Bloomberg US Treasuries, ICE BofAML 91-Day Treasury Bills, FTSE® NAREIT All Equity REITs, J.P. Morgan GBI-EM Global Diversified, LBMA Gold Price, MSCI Emerging Markets, MSCI World, Russell 2000®, S&P 500, and S&P GSCI™ indexes.
EUR-Based Investors index performance chart includes performance for the Bloomberg Euro-Aggregate: Corporate, Bloomberg Pan-Euro High Yield (Euro), EURIBOR 3M, FTSE EMU Govt Bonds, FTSE Euro Broad Investment-Grade Bonds, FTSE® EPRA/NAREIT Europe ex UK RE, J.P. Morgan GBI-EM Global Diversified, LBMA Gold Price AM, MSCI Emerging Markets, MSCI Europe, MSCI Europe ex UK, MSCI Europe Small-Cap, MSCI World ex EMU, MSCI World, and S&P GSCI™ indexes.
GBP-Based Investors index performance chart includes performance for the Bloomberg Sterling Aggregate: Corporate Bond, Bloomberg Sterling Index-Linked Gilts, ICE BofAML Sterling High Yield, FTSE® 250, FTSE® All-Share, FTSE® British Government All Stocks, FTSE® EPRA/NAREIT UK RE, J.P. Morgan GBI-EM Global Diversified, LBMA Gold Price AM, LIBOR 3M GBP, MSCI Emerging Markets, MSCI Europe ex UK, MSCI World, MSCI World ex UK, and S&P GSCI™ indexes.
EM currencies is an equal-weighted basket of 20 emerging markets currencies.
Fixed Income Performance Table
Performance data for US TIPS reflect the Bloomberg US TIPS Index, with yields represented by the Bloomberg Global Inflation Linked Bond Index: US.