Global equity markets advanced in February, as developed markets equities topped emerging markets peers. Value stocks trounced growth, while small caps outperformed large caps for the sixth consecutive month. Sovereign bond prices declined amid sharply rising yields, while high-yield bonds advanced and bested investment-grade equivalents. Real assets mostly gained; oil prices reached their highest levels in more than a year, but gold declined at its fastest monthly rate since 2016. Among major currencies, UK sterling advanced, and the US dollar and euro were mixed.

FEBRUARY 2021 MAJOR ASSET CLASS PERFORMANCE (%)
Sources: Bloomberg Index Services Limited, Bloomberg L.P., FTSE International Limited, MSCI Inc., and Thomson Reuters Datastream. MSCI data provided “as is” without any express or implied warranties.
Note: Local currency returns for the Bloomberg Barclays indexes, the Bloomberg Commodity Index, and the FTSE® Developed REITs are in USD terms.
The Macro Picture
Risk assets rallied in February as global vaccination efforts progressed and economic momentum strengthened. However, the rally stalled in the second half of the month amid concerns about a resurgence in inflation. Indeed, the potential for increased fiscal spending, coupled with steadfast monetary support and positive vaccine developments, sparked new fears that the economy could overheat and cause runaway inflation. Interest rates rose sharply, as US ten-year bond yields climbed back to pre-pandemic levels. The rise in yields and signs of economic normalization encouraged further rotation in style and size, with value and small caps besting their growth and large-cap counterparts by wide margins.
US President Joe Biden’s $1.9 trillion COVID-19 relief package has advanced into the latter stages of the approval process. If passed, the bill would be expected to inject massive liquidity into the market. Still, US Federal Reserve Chairman Jerome Powell largely shrugged off inflation fears and quelled any concerns that the Fed would make any swift moves to tighten its ultra-loose policy. Globally, many central banks appear to be planning to remain accommodative for the foreseeable future; the Reserve Bank of Australia (RBA) ramped up its bond purchases to stifle the rise in its government bond yields, and the European Central Bank indicated that more stimulus could be warranted in the future.
Equities
US equities advanced, performing on par with developed ex US peers in February. Seven of 11 S&P 500 Index sectors advanced; they were led by energy and financials, which posted double-digit gains as oil prices advanced to their highest levels in more than a year and interest rates rose to pre-pandemic levels. Utilities, healthcare, and consumer staples lagged the most. Information technology was a notable laggard as investors attempted to price in growing risks from faster inflation and rising long-term interest rates. Value stocks bested growth counterparts by the widest margin since late 2018. Small caps topped large caps for the sixth consecutive month; small caps have outpaced large caps by nearly 30 percentage points (ppts) during that time span. Quarterly earnings are estimated to have advanced 3.9% year-over-year based on reports from 96% of S&P 500 Index constituents, marking the first positive quarterly earnings result since fourth quarter 2019. Of S&P 500 Index companies, 79% reported a positive EPS surprise, the third-highest level since FactSet began tracking data in 2008. Looking ahead, analysts increased first quarter 2021 earnings projections by 5.0%, the second-largest increase in the first two months of a quarter since FactSet began tracking data in 2002.
The US economy grew at a 4.1% annualized rate in fourth quarter according to its second official estimate, just above its earlier projection. February flash services PMI reached its highest level in nearly six years, while February manufacturing PMI remained firmly in expansionary territory, as locales eased lockdown restrictions and domestic vaccine roll outs accelerated. Fed Chairman Jerome Powell told Congress there is “hope for a return to more normal conditions” in 2021, but re-affirmed the central bank intends to continue its heavy support for the US economy.
European equities underperformed broader developed markets stocks. Europe ex UK stocks outpaced UK stocks, which remained the only major developed market in the red over the past 12 months.
Continental Europe continued to experience a two-speed economic recovery as manufacturing rebounds, while services remain burdened by COVID-19–related regulations and lockdowns. Eurozone manufacturing PMI rose further into expansionary territory in February, led by multi-year high levels in the EU’s three largest economies—Germany, France, and Italy. The growth in manufacturing was driven by both current output and new orders, boosted by the strongest rise in new exports in three years. However, difficulty sourcing raw materials and surging lead times led to near-record supply constraints and contributed to producer price inflation reaching its highest level in ten years. Eurozone services PMI data remained firmly in contractionary territory. Eurozone GDP declined 0.6% in fourth quarter according to the second official preliminary estimate, marking a return to negative growth. Similarly, with 72% of STOXX Europe 600 companies reporting, fourth quarter European earnings fell 18% year-over-year, worse than the decline in third quarter.
The United Kingdom continued to lead all major economies with its vaccination efforts, having provided more than 30% of the country’s adult population with at least one dose. Prime Minister Boris Johnson revealed a timetable for lifting domestic lockdowns, and industrial and consumer confidence continued to tick upward. UK GDP grew 1.0% in fourth quarter according to the official preliminary estimate, beating expectations, but the full year 2020 GDP contraction of 9.9% was still the largest annual decline since the Great Frost of 1709.
Japanese equities advanced, topping broader developed stocks in February for the sixth time in the last seven months. Prime Minister Yoshihide Suga announced an early easing of the state of emergency restrictions that were put in place earlier in the year to quell surging COVID-19 cases. February manufacturing PMI moved into expansionary territory, but remains low relative to other major developed economies; services PMI fell further into contractionary territory. Japanese GDP grew 12.7% annualized in fourth calendar quarter, according to preliminary data. Based on the results of 96% of companies in the index, TOPIX EPS grew 12% year-over-year in fourth calendar quarter, its first positive earnings growth since third quarter 2018
Pacific ex Japan equities advanced but trailed broader developed markets. Hong Kong was the top performer, supported by growing optimism surrounding China’s recovery; New Zealand lagged as major component a2 Milk® lowered its fiscal year 2021 revenue forecast. On a positive note, Standard & Poor’s raised New Zealand’s sovereign credit rating in February, making it the first developed nation with an investment-grade rating to receive an upgrade since the beginning of the coronavirus outbreak. The RBA boosted its bond buying program on the last business day of February by an unscheduled AU$3 billion purchase. Shortly before the end of the month, an unusually large AU$4 billion purchase helped to taper rising interest rates in Australia back down toward the RBA’s target.
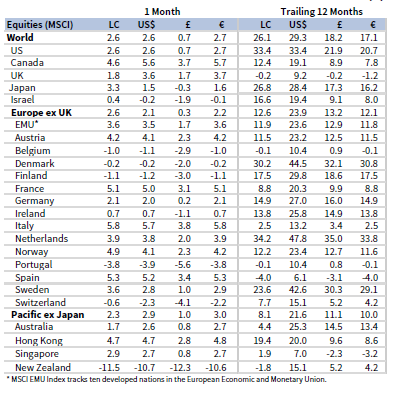
FEBRUARY 2021 DEVELOPED MARKETS EQUITY
INDEX PERFORMANCE (%)
Sources: MSCI Inc. and Thomson Reuters Datastream. MSCI data provided “as is” without any express or implied warranties.
Emerging markets equities advanced mildly, trailing developed markets counterparts and bringing trailing 12-month outperformance down to eight ppts. Among regions, emerging Europe, the Middle East & Africa outperformed, heavily weighted emerging Asia gained on par with the broader market, and Latin America declined. India was the top-performing major country; Taiwan and South Africa also bested the broader index, while Korea, China, and Brazil lagged.
India continued its recovery as a sustained drop in COVID-19 cases led to businesses reopening. India’s manufacturing PMI remained firmly in expansionary territory in February as sales growth and production continued their sharp increases experienced at the beginning of the year, albeit at a slightly slower pace. Calendar fourth quarter GDP surprised to the upside, rising at a 0.4% clip year-over-year.
Chinese equities declined in February as the country’s robust recovery showed signs of cooling. Manufacturing and non-manufacturing PMIs declined to near contractionary territory and their lowest levels in nine months in February amid weaker demand for new orders and falling exports. China’s central bank drained money from the financial system ahead of the Lunar New Year—an unusual move ahead of a holiday that usually sees the central bank inject liquidity—as fears of rising asset bubbles led the People’s Bank of China to strike a balance between supporting the recovery and reducing risk. Looking forward, the Chinese Communist Party is scheduled to meet in early March for the “two sessions” where the political elite shape the details of economic policy for the upcoming year. This year holds extra importance as the event’s conclusion will mark the beginning of the country’s next five-year plan—the centerpiece of China’s long-term economic development planning.
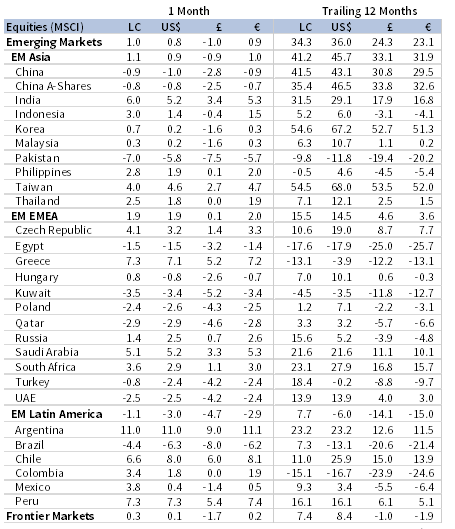
FEBRUARY 2021 EMERGING MARKETS EQUITY
INDEX PERFORMANCE (%)
Sources: MSCI Inc. and Thomson Reuters Datastream. MSCI data provided “as is” without any express or implied warranties.
Fixed Income
US investment-grade bonds declined in February as long-term government bond yields rose to their highest levels since the introduction of COVID-19 lockdowns. US Investment-grade corporates outperformed Treasuries, although both declined in value. US high-yield bonds advanced, and credit spreads declined. Five- and ten-year Treasury yields increased 30 and 33 basis points (bps) to 0.75% and 1.44%, respectively. The widely followed ten-year/two-year yield spread rose to its highest level since November 2015, almost entirely due to rising long-term rates, and real interest rates touched their highest levels since the initial COVID-19 restrictions were eased last June. US tax-exempt municipal bonds and TIPS edged nominal Treasuries.
Sterling- and euro-denominated fixed income performance mirrored their US counterparts, with high-yield bonds advancing and investment-grade declining. Five- and ten-year UK gilt yields gained 38 and 52 bps to 0.39% and 0.89%, respectively, and German ten-year bund yields rose 26 bps to -0.26%—all highs since the pandemic began. UK linkers declined but bested nominal gilts.

FEBRUARY 2021 BOND INDEX PERFORMANCE (%)
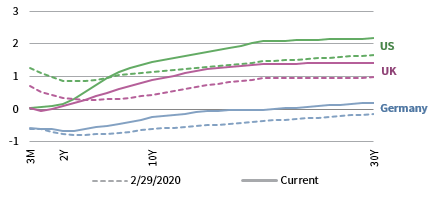
FEBRUARY 2021 NOMINAL YIELD CURVES

10Y/2Y YIELD CURVE SPLIT
* High-yield index yield data represent option-adjusted spread.
Sources: Bank of England, Bloomberg Index Services Limited, BofA Merrill Lynch, Federal Reserve, FTSE Fixed Income LLC, FTSE International Limited, Intercontinental Exchange, Inc., and Thomson Reuters Datastream.
Real Assets
Commodity futures advanced in February, led by gains in energy and industrial metals. Copper prices reached an almost ten-year high on rising demand as global manufacturing continues to rebound.
Oil prices ($66.13 for Brent and $61.50 for WTI) rose 18% to their highest levels in over a year, boosted by expectations of a vaccine-supported economic recovery and tighter oil supply from OPEC+ production cuts.
Rising oil prices buoyed global natural resources equities and MLPs, which also advanced. The strong gain pushed energy MLPs into positive territory on a trailing 12-month basis for the first time since December 2019.
Global developed REITs broadly advanced amid rising interest rates, but performance varied by region. Developed Asia REITs, US REITs, and UK REITs gained, and Europe ex UK REITs sold off.
Gold prices fell to $1,727.44 per troy ounce, their lowest level since last June, marking its sixth price decline in the last seven months. Gold is down 16% since its peak last August, but it remains up over the past 12 months.

FEBRUARY 2021 REAL ASSETS PERFORMANCE (%)
* Europe ex UK REITs are in EUR terms and UK REITs in GBP terms.
Sources: Alerian, Bloomberg L.P., EPRA, FTSE International Limited, Intercontinental Exchange, Inc., MSCI Inc., National Association of Real Estate Investment Trusts, Standard & Poor’s, and Thomson Reuters Datastream. MSCI data provided “as is” without any express or implied warranties.
Notes: Total return data for all MSCI indexes are net of dividend taxes. Gold performance based on spot price return.
USD-Based Investors
Pro-cyclical assets broadly outperformed in February, led by commodities and equities. US small caps outgained large caps for a sixth consecutive month, although both were top performers. US equities topped developed markets peers, which in turn bested emerging markets equities peers. All four equity classes—US large cap, US small cap, developed markets, and emerging markets—experienced substantial returns over the last 12 months.
Commodities were the top-performing asset class, boosted by strong gains in energy and industrial metal prices as global manufacturing continues to rebound. US investment-grade corporates outperformed Treasuries, although both declined in value amid rising interest rates; US high-yield bonds advanced and credit spreads declined.
The US dollar was mixed, declining vis-à-vis UK sterling, and the Australian and Canadian dollars, but advancing the most versus the Swiss franc, Japanese yen, and our basket of emerging markets currencies. The greenback has weakened significantly over the past 12 months, particularly versus the Australian dollar, euro, and UK sterling.
February flash services PMI reached its highest level in nearly six years, while February manufacturing PMI remained firmly in expansionary territory, as locales eased lockdown restrictions and domestic vaccine roll outs accelerated. Fed Chairman Jerome Powell told Congress there is “hope for a return to more normal conditions” in 2021, but re-affirmed the central bank intends to continue its heavy support for the US economy.
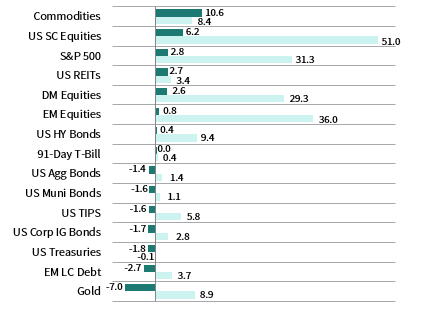
INDEX PERFORMANCE (US$)

US DOLLAR PERFORMANCE VS VARIOUS CURRENCIES
Sources: Bloomberg Index Services Limited, FTSE International Limited, Frank Russell Company, Intercontinental Exchange, Inc., J.P. Morgan Securities, Inc., MSCI Inc., National Association of Real Estate Investment Trusts, Standard & Poor’s, and Thomson Reuters Datastream. MSCI data provided “as is” without any express or implied warranties.
EUR-Based Investors
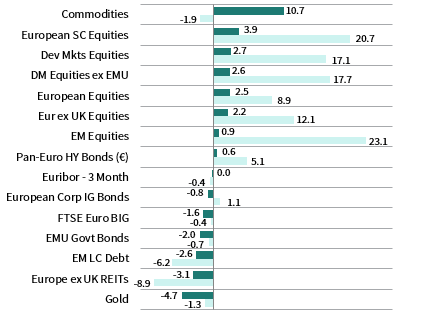
Pro-cyclical assets broadly outperformed in February, led by commodities and equities. European small caps outgained large caps, and Europe ex UK equities trailed developed peers. Developed markets stocks outgained emerging equivalents, which are the top-performing asset class over the trailing 12-month period.
Commodities were the top-performing asset class, boosted by strong gains in energy and industrial metal prices as global manufacturing continues to rebound. European investment-grade corporates outperformed EMU government bonds, although both declined in value amid rising interest rates; Pan-Euro high-yield bonds advanced and credit spreads declined.
The euro was mixed, declining the most vis-à-vis UK sterling, and the Australian and Canadian dollars, but advancing versus the Swiss franc, Japanese yen, and our basket of emerging markets currencies. The euro is broadly stronger over the past 12 months, advancing the most versus the US dollar, the emerging markets currencies basket, and Japanese yen, and declining only vis-à-vis the Australian dollar.
Continental Europe continued to experience a two-speed economic recovery as manufacturing rebounds, while services remain burdened by COVID-19–related regulations and lockdowns. Eurozone manufacturing PMI rose further into expansionary territory in February, led by multi-year high levels in the monetary union’s three largest economies—Germany, France, and Italy. Eurozone services PMI data remained firmly in contractionary territory.
INDEX PERFORMANCE (€)

EURO PERFROMANCE VS VARIOUS CURRENCIES
Sources: Bloomberg Index Services Limited, EPRA, European Banking Federation, FTSE Fixed Income LLC, FTSE International Limited, ICE Benchmark Administration Ltd., J.P. Morgan Securities, Inc., MSCI Inc., National Association of Real Estate Investment Trusts, Standard & Poor’s, and Thomson Reuters Datastream.
GBP-Based Investors
Pro-cyclical assets broadly outperformed in February, led by commodities and equities. UK mid caps outgained large caps, although both gained, and UK equities topped developed peers. Developed markets stocks bested emerging equivalents, which declined but remain the top-performing asset class over the trailing 12-month period.
Commodities were the top-performing asset class, boosted by strong gains in energy and industrial metal prices as global manufacturing continues to rebound. UK investment-grade corporates outperformed UK gilts, although both declined in value amid rising interest rates; UK high-yield bonds advanced and credit spreads declined.
UK sterling broadly advanced in February, appreciating the most vis-à-vis the Swiss franc, Japanese yen, and our equal-weighted basket of emerging markets currencies. Pound sterling is also broadly stronger mixed over the past 12 months, gaining the most against the US dollar, our emerging markets currency basket, and the Japanese yen, and declining only vis-à-vis the Australian dollar and the euro.
The United Kingdom continued to lead all major economies with its vaccination efforts, having provided more than 30% of the country’s adult population with at least one dose. Prime Minister Boris Johnson revealed a timetable for lifting domestic lockdowns, and industrial and consumer confidence continued to tick upward.

INDEX PERFORMANCE (£)

POUND STERLING PERFORMANCE VS VARIOUS CURRENCIES
Sources: Bloomberg Index Services Limited, EPRA, FTSE International Limited, Intercontinental Exchange, Inc., ICE Benchmark Administration Ltd., J.P. Morgan Securities, Inc., MSCI Inc., National Association of Real Estate Investment Trusts, Standard & Poor’s, and Thomson Reuters Datastream.
Performance Exhibits
All data are total returns unless otherwise noted. Total return data for all MSCI indexes are net of dividend taxes.
USD-Based Investors index performance chart includes performance for the Bloomberg Barclays US Aggregate Bond, Bloomberg Barclays US Corporate Investment Grade, Bloomberg Barclays US High Yield Bond, Bloomberg Barclays Municipal Bond, Bloomberg Barclays US TIPS, Bloomberg Barclays US Treasuries, ICE BofAML 91-Day Treasury Bills, FTSE® NAREIT All Equity REITs, J.P. Morgan GBI-EM Global Diversified, LBMA Gold Price, MSCI Emerging Markets, MSCI World, Russell 2000®, S&P 500, and S&P GSCI™ indexes.
EUR-Based Investors index performance chart includes performance for the Bloomberg Barclays Euro-Aggregate: Corporate, Bloomberg Barclays Pan-Euro High Yield (Euro), EURIBOR 3M, FTSE EMU Govt Bonds, FTSE Euro Broad Investment-Grade Bonds, FTSE® EPRA/NAREIT Europe ex UK RE, J.P. Morgan GBI-EM Global Diversified, LBMA Gold Price AM, MSCI Emerging Markets, MSCI Europe, MSCI Europe ex UK, MSCI Europe Small-Cap, MSCI World ex EMU, MSCI World, and S&P GSCI™ indexes.
GBP-Based Investors index performance chart includes performance for the Bloomberg Barclays Sterling Aggregate: Corporate Bond, Bloomberg Barclays Sterling Index-Linked Gilts, ICE BofAML Sterling High Yield, FTSE® 250, FTSE® All-Share, FTSE® British Government All Stocks, FTSE® EPRA/NAREIT UK RE, J.P. Morgan GBI-EM Global Diversified, LBMA Gold Price AM, LIBOR 3M GBP, MSCI Emerging Markets, MSCI Europe ex UK, MSCI World, MSCI World ex UK, and S&P GSCI™ indexes.
EM currencies is an equal-weighted basket of 20 emerging markets currencies.
Fixed Income Performance Table
Performance data for US TIPS reflect the Bloomberg Barclays US TIPS Index, with yields represented by the Bloomberg Barclays Global Inflation Linked Bond Index: US.