Global risk assets suffered significant drawdowns in February as concerns over COVID-19’s impact on global economic activity grew. Emerging markets equities, buoyed by Chinese stocks, bested developed markets peers. Global growth stocks topped value, while large caps edged small caps. Bonds advanced, led by sovereign debt, as yields declined to near-record lows; investment grade outgained high yield amid widening credit spreads. Commodities and natural resources equities fell sharply as oil and natural gas prices plunged on weaker demand from China. The US dollar broadly strengthened, UK sterling mostly declined, and euro performance was mixed.

FEBRUARY 2020 MAJOR ASSET CLASS PERFORMANCE (%)
Sources: Bloomberg Index Services Limited, Bloomberg L.P., FTSE International Limited, MSCI Inc., and Thomson Reuters Datastream. MSCI data provided “as is” without any express or implied warranties.
Note: Local currency returns for the Bloomberg Barclays indexes, the Bloomberg Commodity Index, and the FTSE® Developed REITs are in US dollar terms.
The Macro Picture
Developments in the ongoing COVID-19 outbreak reverberated across global markets in the latter half of February, triggering global equity markets’ steepest monthly decline since the global financial crisis. The number of cases increased outside of China (particularly in Korea, Italy, and the Middle East), prompting broad concerns of the potential impact to global economic growth and corporate profitability. Most major equity markets entered a correction, defined as a peak-to-trough decline of at least 10%, as investors sought solace in safe-haven assets. Much of China’s economy came to a standstill, impacting global supply chains, curbing travel, and temporarily shuttering local and multinational businesses alike. China, which has recently seen a deceleration in growth, had its first quarter GDP growth estimates trimmed to 3.1%, a significant reduction from earlier expectations of 5.9%.
As the virus spread outside China, businesses cut non-essential travel, major industry events were canceled, and some countries instituted additional restrictions on travel and large public gatherings. The International Monetary Fund modestly lowered its global growth outlook for 2020, citing a baseline scenario where China’s economy could return to normal in second quarter. However, the Organisation for Economic Co-operation and Development warned that in a more severe scenario, global GDP growth could be halved from previous estimates. While many uncertainties remain, national governments, central banks, and supranational organizations pledged support to fight the outbreak and soften its potential impact on economic growth.
Equities
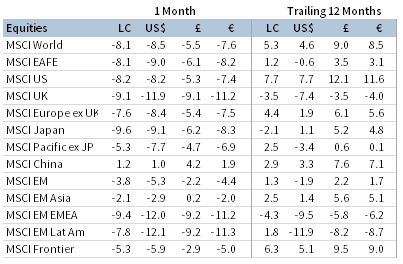
US equities (-8.2% for the S&P 500 Index) edged broader developed markets in USD terms in February due in part to US dollar strength; in local currency terms, the US equity market underperformed. After climbing to a new all-time high mid-month, the S&P 500 fell almost 13 percentage points late in the month, entering a correction in only six days—its quickest peak to 10% decline since 1933. All 11 S&P 500 sectors declined, weighed down by energy, financials, and utilities; communication services, real estate, and healthcare declined the least. Growth stocks outperformed value counterparts, while large caps edged small caps. With reporting season nearly complete, fourth quarter EPS growth registered a 1% increase year-over-year, ending a streak of three straight quarters of earnings declines. Looking ahead, analysts now project first quarter earnings to accelerate just 1%, down more than three percentage points from estimates earlier this year, as the coronavirus outbreak is expected to weigh on corporate profits.
US fourth quarter GDP grew 2.1% annualized in fourth quarter as expected, driven largely by strong consumer spending. A preliminary purchasing managers’ index (PMI) report indicated US companies’ business activity fell in February, driven by a surprise decrease in services sector—its first contractionary reading in four years. Despite overarching concerns related to the future economic fallout from the coronavirus outbreak, several indicators of economic health have remained positive, as employment figures beat expectations, consumer confidence held strong, and housing data surprised to the upside in February.
European equities (-9.3% in USD, -8.5% in EUR, -6.4% in GBP) declined and underperformed broader developed markets stocks. Europe ex UK equities outpaced UK counterparts as both the euro and pound depreciated against the US dollar. With two-thirds of companies reporting, European earnings are estimated to have advanced 1% year-over-year in fourth quarter, although that figure rises to 6% when energy companies are excluded.
Germany reported flat GDP growth in fourth quarter, dragging on the Eurozone’s economy, which had already seen declining growth in Italy and France. Flat growth was one of many disappointing data points reported in Germany, including larger-than-expected decreases in exports, industrial production, and manufacturing orders, along with a surprisingly steep decline in economic sentiment. Italy, battling Europe’s largest COVID-19 outbreak, introduced a €3.6 billion in fiscal stimulus to tackle the virus and a €900 million package to support its most severely affected regions.
The United Kingdom also experienced 0% GDP growth in fourth quarter 2019, but its underlying data held up better than Euro Area peers. Manufacturing PMI unexpectedly rebounded into expansionary territory; retail sales growth beat expectations; and exports grew at a much faster pace than anticipated. The United Kingdom officially left the EU at the end of January, but details of the exit remain unclear in a transitionary period limbo. The United Kingdom has warned that it could walk away from a potential trade agreement if negotiations fail to progress by June.
Japanese equities (-9.1% in USD, 8.3% in EUR, -6.2% in GBP) underperformed broad developed markets stocks, falling roughly on pace with developed ex US peers in major currency terms; however, in local currency terms Japanese equities were the bottom-performing major developed economy as the safe haven yen appreciated. Based on reports from nearly all TOPIX companies, calendar fourth quarter Japanese earnings contracted 4% year-over-year, which marks the fifth consecutive quarter of earnings declines. The Japanese economy declined at a 6.3% annualized rate in fourth quarter, well below expectations and marking its largest fall in almost six years. The economic slowdown was driven in part by the increased consumption tax that went into effect on October 1 last year.
FEBRUARY 2020 EQUITY INDEX PERFORMANCE (%)
Sources: MSCI Inc. and Thomson Reuters Datastream. MSCI data provided “as is” without any express or implied warranties.
Emerging markets equities outpaced developed markets counterparts, narrowing trailing 12-month underperformance to about four ppts in local currency terms. Heavily weighted emerging Asia outperformed emerging Europe, the Middle East & Africa and Latin America, boosted by a recovery in Chinese equities—the only equity market in the MSCI All Country World Index to post a gain in February. Domestic China A-shares bounced back after a notable sell-off on the first day of the month—its first trading day after an extended Lunar New Year holiday due to the coronavirus outbreak. Among other major emerging markets countries, Taiwan bested the broader index while Brazil, India, Korea, and South Africa lagged.
The Chinese government took action to combat the COVID-19 outbreak’s impact on domestic economic activity, cutting lending rates and promising stimulus; both hard data and anecdotal evidence suggested that the economy was operating at about half its normal levels. PMI measures of economic activity fell deeply into contractionary territory and factory activity set an all-time low as the Hubei region and its capital Wuhan, the epicenter of the outbreak, remained under quarantine. Declining new COVID-19 cases across China, along with central and local governments loosening restrictions on factories returning to operations, helped allay fears of deeper impact on economic activity. Overshadowed by the coronavirus outbreak, China cut tariff rates on half of $75 billion of US goods as trade tensions eased between the world’s two largest economies.
Fixed Income
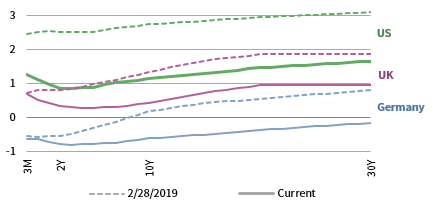
Investment-grade bonds, led by sovereigns, outperformed high-yield equivalents as fears over the spread of the COVID-19 outbreak weighed on yields. US Treasuries outgained corporate investment-grade fixed income securities, while high-yield corporates declined amid widening credit spreads. Five- and ten-year Treasury yields fell 43 and 38 basis points (bps) to 0.89% and 1.13%, respectively. 30-year and ten-year nominal Treasury yields reached new all-time lows. The widely followed ten-year/two-year yield spread widened to 27 bps, but the increase was attributed to the two-year rates declining faster than ten-year rates in anticipation of US Federal Reserve policy rate easing. US tax-exempt municipal bonds and TIPS advanced, but underperformed nominal Treasuries.
UK gilts advanced, outperforming UK corporate investment-grade and high-yield counterparts, which both declined; UK linkers outgained nominal gilts. Five- and ten-year gilt yields fell 10 bps apiece to 0.28% and 0.43%, respectively. EMU government bonds similarly outpaced corporate investment-grade and high-yield peers. German ten-year bund yields declined 17 bps to -0.61%, their second-lowest month-end yield on record.

FEBRUARY 2020 BOND INDEX PERFORMANCE (%)
FEBRUARY 2020 NOMINAL YIELD CURVES

10Y/2Y YIELD CURVE SPLIT
* High-yield index yield data represent option-adjusted spread.
Sources: Bank of England, Bloomberg Index Services Limited, BofA Merrill Lynch, Federal Reserve, FTSE Fixed Income LLC, FTSE International Limited, Intercontinental Exchange, Inc., and Thomson Reuters Datastream.
Real Assets
Commodity futures fell, dragged down by steep declines in energy prices.
Oil prices ($50.52 for Brent and $44.76 for WTI) fell by double-digit ppts to their lowest month-end levels in multiple years. Both Brent crude and WTI are down more than 23% since the beginning of the year due to weaker demand from China, where energy executives estimated demand would decrease 25% in February, a decline representing about 3% of all global oil consumption. OPEC cut its forecast for global oil demand in 2020, citing uncertainty surrounding the global economy.
Global natural resources equities and energy MLPs fell sharply in February; both indexes have declined beyond 20 ppts peak-to-trough in 2020.
Global developed REITs declined. Europe ex UK REITs and US REITs outpaced the broader index, Asia REITS performed approximately in line, and UK REITs lagged.
Gold prices were flat, settling at $1,586.71 per troy ounce at the end of the month, but have gained 20.6% over the past 12 months.

FEBRUARY 2020 REAL ASSETS PERFORMANCE
REAL ASSETS TOTAL RETURN (%)
* Europe ex UK REITs are in EUR terms and UK REITs in GBP terms.
Sources: Alerian, Bloomberg L.P., EPRA, FTSE International Limited, Intercontinental Exchange, Inc., MSCI Inc., National Association of Real Estate Investment Trusts, Standard & Poor’s, and Thomson Reuters Datastream. MSCI data provided “as is” without any express or implied warranties.
Note: Total return data for all MSCI indexes are net of dividend taxes. Gold performance based on spot price return.
USD-Based Investors
Safe havens outperformed risk assets as the ongoing COVID-19 outbreak reverberated across global markets. US investment-grade bonds, led by nominal Treasuries, advanced in February, while equities and commodities declined the most.
Relative performance mostly reflected depressed risk appetite. US equities bested developed ex US equities; investment-grade bonds outperformed high-yield equivalents; large caps edged small caps; and gold trounced broader commodities, which were weighed down by a sharp decline in energy prices. However, emerging markets equities outpaced developed markets peers as Chinese equities rebounded.
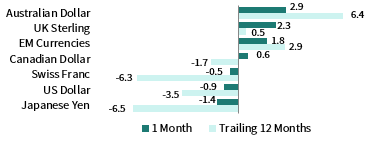
The US dollar appreciated vis-à-vis all major currencies and our equal-weighted basket of emerging markets currencies, save the safe-haven Japanese yen. Over the past 12 months, the greenback appreciated the most versus the commodity-sensitive Australian dollar and emerging markets basket, declining only against safe havens yen and Swiss franc.
After climbing to a new all-time high mid-month, the S&P 500 fell almost 13 percentage points late in the month, entering a correction in only six days—its quickest peak to 10% decline since 1933.
Thirty-year and ten-year nominal Treasury yields reached new all-time lows. The widely followed ten-year/two-year yield spread widened to 27 bps, but the increase was attributed to the two-year rate declining faster than the ten-year rate in anticipation of future Fed policy rate easing.

INDEX PERFORMANCE (US$)

US DOLLAR PERFORMANCE VS VARIOUS CURRENCIES
Sources: Bloomberg Index Services Limited, FTSE International Limited, Frank Russell Company, Intercontinental Exchange, Inc., J.P. Morgan Securities, Inc., MSCI Inc., National Association of Real Estate Investment Trusts, Standard & Poor’s, and Thomson Reuters Datastream. MSCI data provided “as is” without any express or implied warranties.
EUR-Based Investors
Safe havens outperformed risk assets as the ongoing COVID-19 outbreak reverberated across global markets. Gold and euro investment-grade bonds, led by EMU government bonds, advanced in February, while equities and commodities declined the most.
Government bonds outperformed investment-grade corporate and high-yield equivalents; gold topped broader commodities, which were weighed down by a sharp decline in energy prices; and REITs bested broad equities. However, emerging markets equities outpaced developed markets peers as Chinese equities rebounded.
The euro was mixed, appreciating vis-à-vis commodity-exposed currencies—the Australian dollar, our equal-weighted basket of EM currencies, and the Canadian dollar—and UK sterling, but weakening against safe havens Swiss franc, US dollar, and Japanese yen. The common currency experienced a similar pattern of relative currency movements over the past 12 months.
Fourth quarter GDP growth in Germany—the Euro Area’s largest economy—was flat, joining the Euro Area’s other two biggest economies, France and Italy, which reported last month, in weighing down overall economic growth across the Continent. German ten-year bund yields declined 17 bps to -0.61%, their second-lowest month-end yield on record.

INDEX PERFORMANCE (€)
EURO PERFROMANCE VS VARIOUS CURRENCIES
Sources: Bloomberg Index Services Limited, EPRA, European Banking Federation, FTSE Fixed Income LLC, FTSE International Limited, ICE Benchmark Administration Ltd., J.P. Morgan Securities, Inc., MSCI Inc., National Association of Real Estate Investment Trusts, Standard & Poor’s, and Thomson Reuters Datastream.
GBP-Based Investors
Safe havens outperformed risk assets as the ongoing COVID-19 outbreak reverberated across global markets. Gold and UK government bonds, led by linkers, advanced in February, while equities, REITS, and commodities declined the most.
Government bonds outperformed investment-grade corporate and high-yield equivalents; gold topped broader commodities, which were weighed down by a sharp decline in energy prices. However, emerging markets equities outpaced developed markets peers as Chinese equities rebounded.
UK sterling mostly declined, appreciating only against the commodity-exposed Australian dollar and declining most against the safe havens Swiss franc, US dollar, and Japanese yen. Sterling experienced a similar pattern of relative currency movements over the past 12 months.
The United Kingdom also experienced 0% GDP growth in the final quarter of 2019, but its underlying data held up better than Euro Area peers.
The United Kingdom officially left the EU at the end of January, but the details of the exit remain unclear while the country remains in a transitionary period limbo. The United Kingdom has warned that it could walk away from a potential trade agreement if negotiations fail to progress by June.

INDEX PERFORMANCE (€)

POUND STERLING PERFORMANCE VS VARIOUS CURRENCIES
Sources: Bloomberg Index Services Limited, EPRA, FTSE International Limited, Intercontinental Exchange, Inc., ICE Benchmark Administration Ltd., J.P. Morgan Securities, Inc., MSCI Inc., National Association of Real Estate Investment Trusts, Standard & Poor’s, and Thomson Reuters Datastream.
Performance Exhibits
All data are total returns unless otherwise noted. Total return data for all MSCI indexes are net of dividend taxes.
USD-Based Investors index performance chart includes performance for the Bloomberg Barclays US Aggregate Bond, Bloomberg Barclays US Corporate Investment Grade, Bloomberg Barclays US High Yield Bond, Bloomberg Barclays Municipal Bond, Bloomberg Barclays US TIPS, Bloomberg Barclays US Treasuries, ICE BofAML 91-Day Treasury Bills, FTSE® NAREIT All Equity REITs, J.P. Morgan GBI-EM Global Diversified, LBMA Gold Price, MSCI Emerging Markets, MSCI World, Russell 2000®, S&P 500, and S&P GSCI™ indexes.
EUR-Based Investors index performance chart includes performance for the Bloomberg Barclays Euro-Aggregate: Corporate, Bloomberg Barclays Pan-Euro High Yield (Euro), EURIBOR 3M, FTSE EMU Govt Bonds, FTSE Euro Broad Investment-Grade Bonds, FTSE® EPRA/NAREIT Europe ex UK RE, J.P. Morgan GBI-EM Global Diversified, LBMA Gold Price AM, MSCI Emerging Markets, MSCI Europe, MSCI Europe ex UK, MSCI Europe Small-Cap, MSCI World ex EMU, MSCI World, and S&P GSCI™ indexes.
GBP-Based Investors index performance chart includes performance for the Bloomberg Barclays Sterling Aggregate: Corporate Bond, Bloomberg Barclays Sterling Index-Linked Gilts, ICE BofAML Sterling High Yield, FTSE® 250, FTSE® All-Share, FTSE® British Government All Stocks, FTSE® EPRA/NAREIT UK RE, J.P. Morgan GBI-EM Global Diversified, LBMA Gold Price AM, LIBOR 3M GBP, MSCI Emerging Markets, MSCI Europe ex UK, MSCI World, MSCI World ex UK, and S&P GSCI™ indexes.
EM currencies is an equal-weighted basket of 20 emerging markets currencies.
Fixed Income Performance Table
Performance data for US TIPS reflect the Bloomberg Barclays US TIPS Index, with yields represented by the Bloomberg Barclays Global Inflation Linked Bond Index: US.