Global equities continued their strong start to the year in February, and some markets experienced their best two-month start in decades. In major currency terms, developed markets outperformed emerging markets after three consecutive months of underperformance, and US stocks edged out developed ex US counterparts. Small caps bested large caps, and growth stocks outgained value equivalents. High-yield and investment-grade corporates continued to rally amid spread tightening, while government bonds weakened slightly. Real assets mostly gained, led by natural resources equities; developed REIT returns were regionally mixed but generally muted. Among major currencies, UK sterling and the US dollar strengthened, euro performance was mixed, and the Japanese yen mostly weakened.
Global risk assets continued their broad rally in February; investors were encouraged by a cautious US Federal Reserve, signs of progress toward a US-China trade deal, and somewhat better-than-feared quarterly earnings results. The Fed reaffirmed its “patient” approach regarding future policy rate increases and indicated plans to conclude its balance sheet runoff in the second half of 2019, earlier than expected. In comments to a US Senate committee, Fed Chairman Jerome Powell described the US economy as healthy but noted “crosscurrents and conflicting signals” in the global economy, specifically slowing growth in China and Europe, ongoing trade tensions, and continued Brexit uncertainty. The US economy decelerated in fourth quarter but still generated above-trend growth; in contrast, both China and the Eurozone remain mired in a slowdown. On the trade negotiation front, US President Donald Trump delayed a planned tariff increase on $200 billion of Chinese goods scheduled to go into effect on March 1, citing “productive” trade talks with China over structural issues. In other trade-related developments, while Brexit uncertainty remains heightened, UK Prime Minister Theresa May allayed fears by appearing to offer Parliament an opportunity to rule out a near-term “no-deal” Brexit and to delay the United Kingdom’s departure from the European Union beyond March 29 if her withdrawal deal is rejected a second time. However, it remains unclear whether the European Union would agree to extend Article 50 negotiations. Fourth quarter global earnings growth slowed sharply from prior quarters, yet share prices reacted mildly to earnings beats and misses, suggesting that investors had discounted even worse outcomes. Still, further downward revisions to first quarter and full-year 2019 forecasts suggest a bumpy ride ahead.
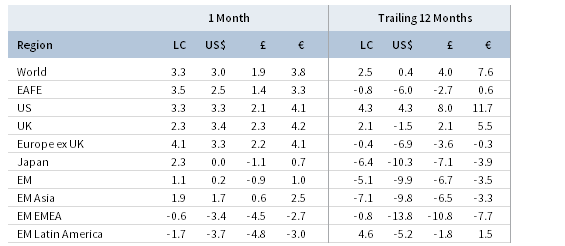
TOTAL RETURN FOR MSCI INDEXES (%)
US equities (3.2% for the S&P 500 Index) continued their best start to a year in decades, outperforming developed markets peers in February in USD terms. All 11 S&P 500 sectors were in the black for the month, led by information technology and industrials; communication services and consumer discretionary lagged. Small-cap stocks significantly outperformed their large-cap counterparts for the second consecutive month, while growth equities topped value for the third straight month. Fourth quarter 2018 earnings per share grew 13% year-over-year, marking the tenth consecutive quarter of positive growth and the fifth consecutive double-digit gain; however, the rate of growth slowed to the lowest clip since third quarter 2017. Forward earnings guidance was weak this reporting season as the ratio of companies guiding higher versus lower fell to the lowest level in several quarters. Yet, stock prices generally rose for those companies guiding lower, an indication that the market may have priced in even more depressed guidance. Underlying macroeconomic fundamentals remained mostly positive as February consumer confidence rebounded to near its highest level since 2000 and the unemployment rate barely ticked up in January, despite the US government shutdown. Housing data were more mixed, with new and existing homes data failing to meet expectations but pending homes data handily beating consensus estimates. The official preliminary estimate of fourth quarter GDP slowed to an annualized growth rate of 2.6%, bringing full-year 2018 growth to 2.9%, just shy of the Trump administration’s 3% growth target.
European equities (3.4% in USD, 4.2% in EUR, and 2.2% in GBP) outgained broader developed markets in February. UK stocks underperformed Eurozone and Europe ex UK equivalents in local currency terms, but outperformed in major currency terms due to sterling strength on the back of positive Brexit developments. Prime Minister May offered an uncharacteristic concession that could allow Parliament to seek an extension to Article 50 negotiations and avoid an abrupt and potentially disastrous departure from the EU in late March. Still, Brexit uncertainty has hampered UK economic activity, as preliminary estimates suggest the 2018 annual GDP growth was the weakest since 2009 amid four straight quarters of slumping business investment. Comments from Bank of England Governor Mark Carney echoed gloomy sentiment, as the central bank cut its 2019 UK growth forecast to the lowest level since the global financial crisis and maintained its benchmark policy rate at 0.75%, indicating a lower likelihood of future rate rises. On the Continent, estimated fourth quarter Eurozone GDP grew as expected, but in Germany—the Eurozone’s largest economy—estimated GDP was flat, below earlier expectations. Downbeat manufacturing and trade data across the Eurozone weighed on sentiment, which remained near multi-year lows. European corporate earnings grew an estimated 6% year-over-year in fourth quarter, marking the tenth consecutive quarter of positive EPS growth but the slowest clip since third quarter 2016.
Japanese equities (0.0% in USD, 0.7% in EUR, and -1.1% in GBP) were among the worst-performing major developed markets. After enjoying an eight-quarter streak of positive growth, corporate earnings fell 7% year-over-year in calendar fourth quarter, having slowed steadily since peaking at the beginning of 2017. GDP growth turned positive at a 1.4% annualized rate, in line with forecasts. Other economic data disappointed as retail sales growth and trade data were weaker than expected, and manufacturing output expectations turned negative for the first time since 2012. Bank of Japan (BOJ) Governor Haruhiko Kuroda affirmed the central bank would further ease monetary policy if the yen continues to strengthen and threaten the BOJ’s 2.0% inflation target. However, recent dissent among BOJ board members could create challenges for the central bank as it weighs future policy decisions.
Emerging markets equities (0.2% in USD, 1.0% in EUR, and -0.9% in GBP) underperformed developed markets equivalents in February. Among EM regions, emerging Asia was the top performer, followed by emerging Europe, the Middle East & Africa and Latin America. China was one of the top-performing major emerging markets, experiencing most of its gains in the second half of the month as it became increasingly apparent that the United States would delay the scheduled March tariff increase. Domestically listed China A-shares have outperformed all major countries and regions year-to-date, gaining over 25% in USD terms. Economic data for China, the world’s second largest economy, were less constructive, as manufacturing and trade data suggested worsening underlying conditions. Among other major emerging markets economies, Brazil, India, and Korea underperformed the broader index, while Taiwan outperformed.
Real assets generally posted modest gains in February after leading most asset classes the prior month. Commodity futures advanced (1.0% for the Bloomberg Commodity TR Index and 3.8% for the energy-heavy S&P GSCI™ Index), led higher by energy and industrial metals. Oil prices ($66.03 for Brent and $57.22 for WTI) gained amid tightening supply stemming from US sanctions on Iran and Venezuela, coupled with OPEC exports declining to their lowest levels since 2015. Global natural resources equities (2.4% for the MSCI World Natural Resources Index in USD terms) and energy MLPs (0.3%) also benefited from rising oil prices. Global developed REITs (-0.1% in USD terms) treaded water in aggregate, but with disperse regional performance: UK REITs (2.1%) and US REITs (0.5%) gained, while developed Asia REITs (-0.4% in USD terms) and Europe ex UK REITs (-3.2%) declined. Gold (-0.5%) declined in USD terms to $1,315.65 per troy ounce, hurt by dollar strength.
Global fixed income performance was mixed as investors flocked to riskier assets. Credits outperformed sovereign bonds, as US Treasuries (-0.3%) declined for the first time in four months. Five- and ten-year Treasury yields rose 9 basis points (bps) and 10 bps to finish the month at 2.52% and 2.73%, respectively, and the benchmark ten-year versus two-year yield spread widened to 21 bps, reversing some of the recent curve flattening. UK gilts (-0.9%) fell amid rising yields as risks of a no-deal Brexit appeared to diminish; five- and ten-year UK government yields each rose 8 bps to 0.97% and 1.33%, respectively. EMU government bonds (-0.4%) also declined as ten-year German bund yields rose 3 bps to 0.19%, although Italian government bond spreads over German bunds compressed from intra-month highs when ratings agency Fitch declined to downgrade Italy to junk status. US credit spreads tightened as US high-yield (1.7%) and investment-grade (0.2%) corporates outperformed Treasuries. US tax-exempt bonds (0.5%) and US TIPS (0.0%) also outpaced nominal Treasuries. UK linkers (-0.8%) also edged nominal gilts.
Among major currencies, UK sterling gained against all major currencies and, over the past year, the sterling fell only against the US and Canadian dollars. The US dollar gained against all but the UK sterling, and strengthened against all currencies we track over the trailing 12-month period. The euro gained against our equal-weighted basket of EM currencies, the Japanese yen, and the Australian dollar, but weakened vis-à-vis sterling, the US and Canadian dollars, and the Swiss franc. The euro was broadly weaker over the trailing 12-month period, strengthening only against EM currencies and the Australian dollar.
Currency Performance as of February 28, 2019
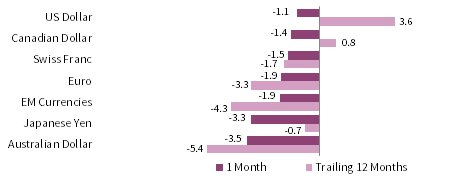
The US dollar was broadly stronger in February, gaining against all but UK sterling as the US economy continued to show relative strength. Over the past year, the dollar has appreciated against all major currencies.
VERSUS THE US DOLLAR
Total Return (%)
The euro gained against our equal-weighted basket of EM currencies, the Japanese yen, and the Australian dollar, but weakened vis-à-vis UK sterling, the US and Canadian dollars, and the Swiss franc. Over the past year, the euro was broadly weaker, strengthening only against EM currencies and the Australian dollar.

VERSUS THE EURO
Total Return (%)
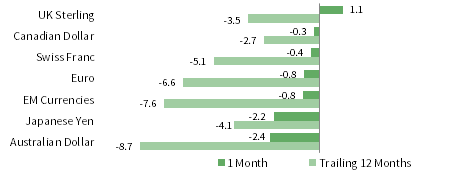
In February, UK sterling rallied vis-à-vis major developed currencies and our equal-weighted basket of EM currencies, as the likelihood of a no-deal Brexit diminished. Over the past year, the pound sterling strengthened against all but the US and Canadian dollars.
VERSUS THE POUND STERLING
Total Return (%)
Note: EM currencies is an equal-weighted basket of 20 currencies.
USD Market Performance as of February 28, 2019
Equities and commodities were top performers in February. US stocks bested DM ex US equivalents and EM equities, and domestic small caps outgained large caps. US high-yield and investment-grade corporates outperformed Treasuries amid spread tightening. Emerging markets local currency debt and gold lagged.

INDEX PERFORMANCE (US$)
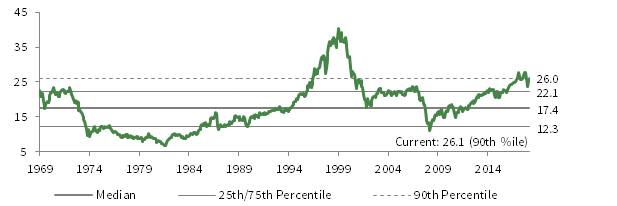
COMPOSITE NORMALIZED P/E: MSCI US
December 31, 1969 – February 28, 2019
FIXED INCOME YIELDS
February 2018 – February 2019
Sources: Bloomberg Index Services Limited, FTSE International Limited, Frank Russell Company, ICE Benchmark Administration Ltd., Intercontinental Exchange, Inc., J.P. Morgan Securities, Inc., MSCI Inc., National Association of Real Estate Investment Trusts, Standard & Poor’s, and Thomson Reuters Datastream. MSCI data provided “as is” without any express or implied warranties.
EUR Market Performance as of February 28, 2019
Commodities and equities outperformed in February. European equities outgained broader DM and EM stocks, and European large caps bested small caps. European corporate high-yield and investment-grade bonds outperformed EMU government bonds. Europe ex UK REITs lagged significantly.
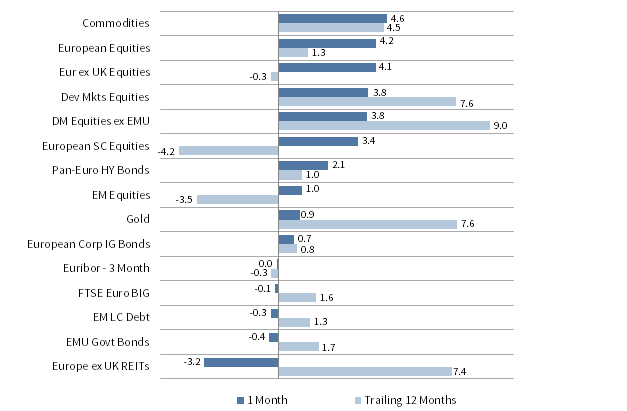
INDEX PERFORMANCE (€)
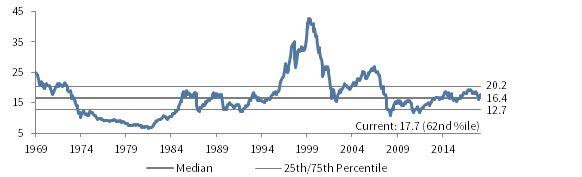
COMPOSITE NORMALIZED P/E: MSCI EUROPE EX UK
December 31, 1969 – February 28, 2019

FIXED INCOME YIELDS
February 2018 – February 2019
Sources: Bloomberg Index Services Limited, EPRA, European Banking Federation, FTSE Fixed Income LLC, FTSE International Limited, ICE Benchmark Administration Ltd., J.P. Morgan Securities, Inc., MSCI Inc., National Association of Real Estate Investment Trusts, Standard & Poor’s, and Thomson Reuters Datastream. MSCI data provided “as is” without any express or implied warranties.
GBP Market Performance as of February 28, 2019
Commodities and European equities were top performers in February. UK equities outgained Europe ex UK and broader developed equities, and UK mid-caps bested UK large caps. UK high-yield bonds outpaced investment-grade corporates and nominal gilts. EM local currency debt and gold lagged.
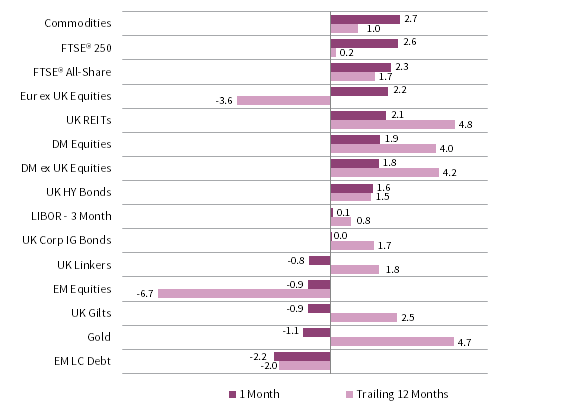
INDEX PERFORMANCE (₤)
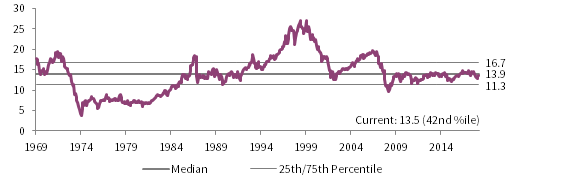
COMPOSITE NORMALIZED P/E: MSCI UK
December 31, 1969 – February 28, 2019
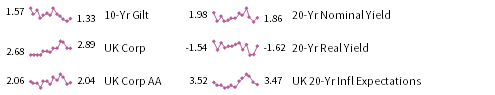
FIXED INCOME YIELDS
February 2018 – February 2019
Sources: Bloomberg Index Services Limited, EPRA, FTSE International Limited, Intercontinental Exchange, Inc., ICE Benchmark Administration Ltd., J.P. Morgan Securities, Inc., MSCI Inc., National Association of Real Estate Investment Trusts, Standard & Poor’s, and Thomson Reuters Datastream. MSCI data provided “as is” without any express or implied warranties.
Exhibit Notes
Performance Exhibits
Total return data for all MSCI indexes are net of dividend taxes.
US dollar index performance chart includes performance for the Bloomberg Barclays Aggregate Bond, Bloomberg Barclays Corporate Investment Grade, Bloomberg Barclays High Yield Bond, Bloomberg Barclays Municipal Bond, Bloomberg Barclays US TIPS, Bloomberg Barclays US Treasuries, ICE BofAML 91-Day Treasury Bills, FTSE® NAREIT All Equity REITs, J.P. Morgan GBI-EM Global Diversified, LBMA Gold Price, MSCI Emerging Markets, MSCI World, Russell 2000®, S&P 500, and S&P GSCI™ indexes.
Euro index performance chart includes performance for the Bloomberg Barclays Euro-Aggregate: Corporate, Bloomberg Barclays Pan-Euro High Yield, FTSE EMU Govt Bonds, FTSE Euro Broad Investment-Grade Bonds, EURIBOR 3M, FTSE® EPRA/NAREIT Europe ex UK RE, J.P. Morgan GBI-EM Global Diversified, LBMA Gold Price AM, MSCI Emerging Markets, MSCI Europe, MSCI Europe ex UK, MSCI Europe Small-Cap, MSCI World ex EMU, MSCI World, and S&P GSCI™ indexes.
UK sterling index performance chart includes performance for the Bloomberg Barclays Sterling Aggregate: Corporate Bond, ICE BofAML Sterling High Yield, FTSE® 250, FTSE® All-Share, FTSE British Government All Stocks, FTSE British Government Index-Linked All Stocks, FTSE® EPRA/NAREIT UK RE, J.P. Morgan GBI-EM Global Diversified, LBMA Gold Price AM, LIBOR 3M GBP, MSCI Emerging Markets, MSCI Europe ex UK, MSCI World, MSCI World ex UK, and S&P GSCI™ indexes.
Valuation Exhibits
The composite normalized P/E ratio is calculated by dividing the inflation-adjusted index price by the simple average of three normalized earnings metrics: ten-year average real earnings (i.e., Shiller earnings), trend-line earnings, and return on equity–adjusted earnings. We have removed the bubble years 1998–2000 from our mean and standard deviation calculations. All data are monthly.
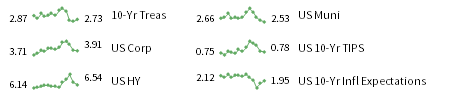
Fixed Income Yields
US fixed income yields reflect Bloomberg Barclays Municipal Bond Index, Bloomberg Barclays US Corporate High Yield Bond Index, Bloomberg Barclays US Corporate Investment-Grade Bond Index, and the ten-year Treasury.
European fixed income yields reflect the ICE BofAML Euro Corporate AA Bond Index, ICE BofAML Euro Corporate Bond Index, Bloomberg Barclays Pan-European Aggregate High Yield Bond Index, Bloomberg Twenty-Year European Government Bond Index (nominal), ten-year German bund, 20-year European Inflation Swaps (inflation expectations), and the real yield calculated as the difference between the inflation expectation and nominal yield.
UK sterling fixed income yields reflect the Bank of England 20-year nominal yields, Bloomberg Generic UK 20-year inflation-linked (real) yields, ICE BofAML Sterling Corporate AA Bond Index, ICE BofAML Sterling Corporate Bond Index, and UK ten-year gilts.