Capital markets reversed course in February as the benign volatility environment they enjoyed for some time ended abruptly. Global equities sold off, with the decline in US stocks reaching a 10% peak-to-trough correction from January 26 through February 8 before recouping roughly half of their losses by month-end. Among global equities, growth outperformed value, continuing recent trends, yet these results were predominantly driven by US equity market dynamics. Despite the sharp decline in equities, US Treasuries fell modestly as yields continued to back up; EMU and UK government bonds posted slight gains with stable yields in contrast. Meanwhile, corporate credits underperformed government bonds across regions as spreads mostly widened. Real assets were among the hardest hit categories with energy MLPs, natural resources equities, developed REITs, and energy-related commodities all posting sharp declines. The US dollar gained against a broad group of currencies (with the exception of the Japanese yen as investors sought safe havens), the euro’s performance was mixed, and UK sterling retreated against most currencies.
There is no single reason behind the recent market correction; instead, as is typical with such episodes, a myriad of factors likely coalesced to generate the spike in volatility and risk aversion. Some pundits blamed the combination of disappointing labor productivity data and higher-than-expected wage inflation for accelerating the US Treasury yield back-up. The bond market was also hit by increasing prospects for faster economic growth and inflation following the passage of a two-year budget deal that increases government spending by $300 billion at an advanced stage in the business cycle. That, combined with the recently passed tax cuts, the US Federal Reserve’s balance sheet wind-down, and signs that foreign demand for Treasuries is waning, threaten to strain the bond supply/demand balance and raise risks of a policy mistake. Taken together, it’s become increasingly clear the path of least resistance for yields is up. Rising bond yields weighed on equities toward the end of January and in the first days of February, which boosted realized volatility in the cash equity market and quickly spilled over into the equity derivatives market, specifically futures tied to the VIX index of implied equity volatility and held in retail-oriented exchange-traded products, which had become a crowded trade. The result was the worst single-day VIX spike in its history and the largest daily decline in the S&P 500 since 2011.
Another takeaway is that the February equity correction was arguably overdue and somewhat welcome given the market had become quite overbought by late January, and US valuations had become exceedingly stretched. In addition, such corrections have been fairly common historically and, as some may argue, necessary to shake out the weak hands to allow bull markets to continue. It is last year’s record low market volatility and the steady and prolonged grind higher of global risk assets since their February 2016 lows that were so unusual. Meanwhile, the underlying market fundamentals remain strong with the global economy in its best shape since the financial crisis, robust double-digit fourth quarter 2017 earnings growth across major regions, and significantly upgraded forward earnings estimates. Global financial conditions also remain mostly benign as ample liquidity remains in the system. Yet, it’s getting later in the cycle, and market risks have risen due to a combination of political and economic policy developments as well as elevated financial asset valuations. It’s safe to assume that similar bouts of volatility will become more frequent going forward from here.
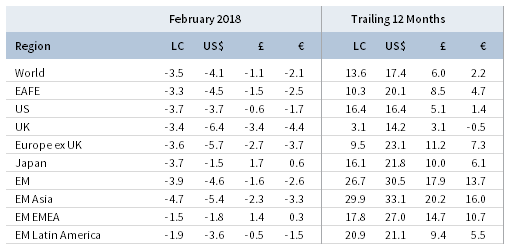
US equities (-3.7% for the S&P 500 Index) fell sharply to start the month, reaching a 10% correction on February 8 before later recovering some of those losses, resulting in the worst monthly performance since January 2016. Still, US stocks managed to outperform developed markets peers primarily due to dollar strengthening. Ten out of 11 S&P 500 sectors were in the red for the month as energy and the defensive high-yielding consumer staples, telecom, and real estate sectors led declines; information technology meaningfully outperformed, eking out a slightly positive return. Strong financial results and a surge in share buybacks gave a lift to the US market later in the month. Fourth quarter 2017 earnings rose above earlier estimates and are now expected to grow 15% year-over-year, the best growth since third quarter 2011. Forward estimates for full-year 2018 results continued climbing as well and now stand at 19%. Economic data released in February were generally positive, with consumer confidence and manufacturing sentiment reaching their highest levels in well over a decade; one exception was a slight downward revision to fourth quarter GDP. However, minutes from the Fed’s January policy meeting and later congressional testimony from new Chair Jerome Powell pointed to stronger growth and inflation projections and risks skewed to the upside, suggesting that more aggressive monetary tightening may be appropriate, particularly in light of recently passed late-cycle fiscal stimulus. While equity markets in February were sensitive to news suggesting further upward pressure on bond yields, our analysis shows that historical periods of rising rates are generally associated with positive equity performance due to the strong underlying fundamentals driving yields higher in the first place.
European equities (-5.9% in USD, -3.9% in EUR, and -2.9% in GBP) declined as broader Europe and the underlying regions all underperformed developed counterparts in major currency terms; UK stocks lagged the most, followed by EMU and Europe ex UK, respectively. European earnings growth accelerated in fourth quarter to an estimated 17% year-over-year in spite of currency headwinds. Fourth quarter marked the sixth consecutive positive quarter and the fourth double-digit rate during that span. On monetary policy, European Central Bank (ECB) minutes showed no indication of scaling back QE faster than communicated thus far, while the Bank of England (BOE) left rates unchanged but sounded a more hawkish tone, which led to speculation of a potential rate hike at its May meeting. In a Brexit setback, UK leaders rejected the European Commission’s draft Withdrawal Agreement on issues over treatment of the Northern Ireland border. Eurozone inflation underwhelmed, slowing for the third consecutive month, while UK inflation of 3.0% exceeded expectations. Germany’s leading political parties moved closer toward forming a coalition government after Angela Merkel’s Christian Democratic Union (CDU) approved a governing deal with the center-left Social Democrats (SPD), as expected. The coalition now hangs on ratification from the SPD rank-and-file, which is less unified on the deal than its CDU counterparts, making the March 4 outcome far from certain. Italian general elections will also be held on March 4 as the country seeks to form its 65th government since the end of World War II. The latest polls indicate a hung parliament, with no party block commanding an outright majority; therefore a minority coalition government is the likely result, sustaining Italy’s governance challenges and threatening to further stall the reform agenda.
Japanese equities (-1.5% in USD, 0.6% in EUR, and 1.7% in GBP) outperformed developed markets in major currency terms due to robust flight-to-safety yen strength but underperformed slightly in local currency terms. Market expectations of less accommodative Bank of Japan (BOJ) policy may have also contributed to recent yen strength. Calendar fourth quarter GDP grew at a preliminary 0.5% annualized rate, below expectations and slower than prior quarters but marking the eighth straight quarterly expansion and the longest growth streak in nearly 30 years. Underlining fourth quarter growth was healthy private consumption and business investment. January industrial production and retail sales growth, while preliminary, came in below expectations and inflation remained subdued. Japanese corporate earnings in calendar fourth quarter were robust, growing 17% year-over-year as all sectors delivered positive growth on both the top and bottom lines despite a stronger yen. In a sign of policy continuity, BOJ Governor Haruhiko Kuroda was nominated to a fresh five-year term, while nominations for lower-level positions generally included advocates for further accommodation, underscoring a commitment to continued monetary stimulus.
Emerging markets equities (-4.6% in USD, -2.6% in EUR, and -1.6% in GBP) underperformed developed markets peers amid the recent US dollar rally and continued back-up in US government bond yields. EM equities outperformed developed counterparts during early February’s market turmoil but failed to recover to the same extent by month-end. In a sign of sentiment reversal, EM stocks suffered an estimated $5.8 billion of non-resident portfolio outflows last month following inflows of $13.5 billion in January. With respect to regional performance, emerging Europe, the Middle East & Africa declined the least, followed by Latin America, while heavily weighted emerging Asia underperformed the broader index. Index heavyweight China (30.3% of EM as of month-end) declined the most among major emerging countries. Chinese authorities preemptively took control of heavily indebted insurance giant Anbang on fears of systemic risks and amid a general crackdown on excessive financial leverage in the country. Recent data suggest the Chinese economy is slowing in early 2018, and India just overtook China as the world’s fastest growing major economy. South African equities held up well in February after long-time president Jacob Zuma was forced to resign and was replaced by the seemingly pro-business Cyril Ramaphosa. He subsequently reshuffled the cabinet and oversaw passage of a budget that increased taxes in an effort to maintain the country’s investment-grade debt rating from Moody’s, the only major agency to have not downgraded South Africa’s sovereign debt to junk status. Russian and Brazilian equities gained in February. The former’s debt rating was upgraded by S&P to investment grade, while the latter shrugged off a Fitch downgrade, with both outlooks currently stable.
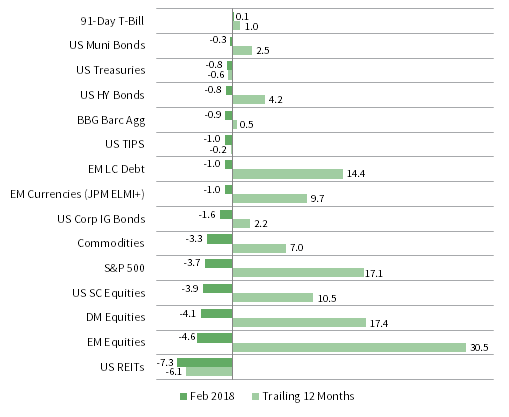
Real assets declined and generally underperformed equities and bonds in February due to a combination of a stronger US dollar, weaker oil prices, and higher bond yields as energy-related and real estate assets suffered the most. Commodity futures fell (-1.7% for the Bloomberg Commodity TR Index and -3.3% for the energy-heavy S&P GSCI™ Index), driven by energy and metals, while agriculture gained. Oil prices ($65.78 for Brent and $61.64 for WTI) declined nearly 5% in light of a rising US dollar and evidence of a pickup in US shale output and growing inventories. Global natural resources equities (-8.3% for the MSCI World Natural Resources Index in USD terms) and energy MLPs (-9.7%) sold off amid general market risk aversion, as well as the aforementioned commodity and interest rate headwinds. Developed REITs (-6.6% in USD terms) were also further hit by the rise in global bond yields. US REITs (-7.3%) declined the most, followed by Europe ex UK REITs (-5.4%) and UK REITs (-5.1%). Dollar strength weighed on gold prices (-1.7%), which ended the month at $1,319.34/troy ounce.
US Treasuries (-0.8%) declined despite the equity market sell-off as government bond yields continued to grind higher, driven by higher real yields as breakeven inflation rates were steady, highlighting higher growth expectations but also rising risks associated with future economic policy. The US Treasury yield curve continued its steepening trend since the start of the year, with the benchmark ten-year versus two-year yield spread widening by 4 basis points (bps) on the month. Five- and ten-year Treasury yields rose 13 bps and 15 bps to end at 2.65% and 2.87%, respectively. Ten-year yields touched 2.94% intra-month for the first time since January 2014, while two-year yields reached levels last seen in late 2008. Developed ex US government bond yields were more stable as EMU government bonds (0.2%) and UK gilts (0.2%) gained slightly. Five- and ten-year UK gilt yields saw more muted moves than US equivalents, increasing 4 bps and 2 bps to end the month at 1.08% and 1.57%, respectively. US credit spreads reversed the recent tightening trend with US investment-grade corporate bonds (-1.6%) underperforming US high-yield bonds (-0.8%) and Treasuries. US tax-exempt bonds (-0.3%) also declined but outperformed taxable equivalents. US TIPS (-1.0%) underperformed nominal counterparts after real yields climbed to their highest levels since December 2015; in contrast, UK linkers (0.4%) outgained nominal gilts.
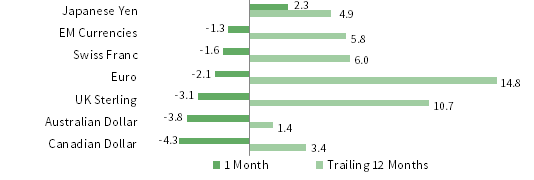
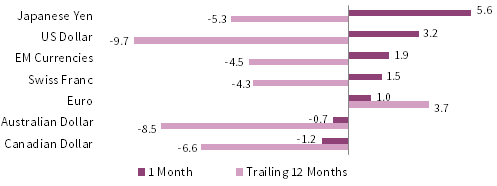
Among major currencies, the US dollar rallied broadly amid a global flight to safety, the euro was mixed, and UK sterling depreciated, a reversal from January’s strong gains. With the exception of the Japanese yen, the greenback gained against all major currencies we cover, as well as versus our equal-weighted EM currency basket, gaining the most against the Canadian dollar, Australian dollar, and UK sterling. Still, the US dollar meaningfully depreciated in the trailing 12-month period. The euro appreciated against the Canadian dollar, Australian dollar, and UK sterling, but declined relative to the Japanese yen, US dollar, our EM basket, and the Swiss franc. The euro also appreciated against every currency we track over the past year. The UK sterling fell the most against the Japanese yen, US dollar, and our EM basket, but gained against the commodity-exposed Canadian and Australian dollars. Recent adverse Brexit negotiation developments likely weighed on the pound despite a more hawkish BOE, but the UK sterling appreciated against all but the euro over the trailing 12-month period.
Market Exhibits
Currency Performance as of February 28, 2018
The US dollar reversed its recent course amid February’s market volatility, appreciating against most major currencies and our equal-weighted EM basket; the safe-haven Japanese yen was the exception. USD weakness remains evident over the trailing 12 months, particularly against the euro and UK sterling.
Euro performance was mixed, appreciating against the Canadian dollar, Australian dollar, and UK sterling, but weakening relative to the Japanese yen, US dollar, our EM currency basket, and the Swiss franc. Longer horizon trends remain intact as the euro appreciated broadly over the trailing 12-month period.
UK sterling mostly depreciated on heightened Brexit uncertainty, a reversal from strong gains last month, but gained against the commodity-exposed Canadian and Australian dollars. The pound gained against all but the euro over the trailing 12 months, partially recovering from post-Brexit referendum lows.
Sources: MSCI Inc. and Thomson Reuters Datastream. MSCI data provided “as is” without any express or implied warranties.
Note: EM currencies is an equal-weighted basket of 20 currencies.
USD Market Performance as of February 28, 2018
Risk assets sold off, led by rate-sensitive US REITs and EM equities, which trailed DM counterparts. US stocks recovered some losses to outperform global peers. Treasuries declined but less than investment-grade corporate credits and TIPS on wider spreads and higher real yields, respectively. Cash was the sole safe haven.
Sources: Barclays, Bloomberg L.P., BofA Merill Lynch, FTSE International Limited, Frank Russell Company, J.P. Morgan Securities, Inc., MSCI Inc., National Association of Real Estate Investment Trusts, Standard & Poor’s, and Thomson Reuters Datastream. MSCI data provided “as is” without any express or implied warranties.
Euro Market Performance as of February 28, 2018
Europe ex UK REITs led declines as equities sold off. European and EM equities underperformed DM counter-parts, and European small caps bested large caps. European fixed income performance was mixed; investment grade enjoyed slight gains, while high yield declined. EM LC debt and currencies also gained.
Sources: Barclays, Bloomberg L.P., Citigroup Global Markets, EPRA, FTSE International Limited, J.P. Morgan Securities, Inc., MSCI Inc., National Association of Real Estate Investment Trusts, Standard & Poor’s, and Thomson Reuters Datastream. MSCI data provided “as is” without any express or implied warranties.
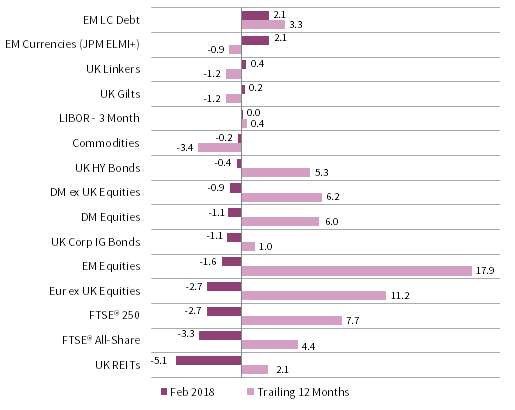
GBP Market Performance as of February 28, 2018
UK REITs led declines, followed by UK equities, which underperformed global peers; UK mid caps bested large caps. DM equities edged EM counterparts. UK high-yield bonds fell less than investment-grade credits, but both trailed gilts and linkers, which were outpaced by EM LC debt and currencies.
Sources: Barclays, Bloomberg L.P., BofA Merill Lynch, EPRA, FTSE International Limited, J.P. Morgan Securities, Inc., MSCI Inc., National Association of Real Estate Investment Trusts, Standard & Poor’s, and Thomson Reuters Datastream. MSCI data provided “as is” without any express or implied warranties.
Exhibit Notes
Performance Exhibits
Total return data for all MSCI indexes are net of dividend taxes.
US dollar index performance chart includes performance for the Bloomberg Barclays Aggregate Bond, Bloomberg Barclays Corporate Investment Grade, Bloomberg Barclays High-Yield Bond, Bloomberg Barclays Municipal Bond, Bloomberg Barclays US TIPS, Bloomberg Barclays US Treasuries, BofA Merrill Lynch 91-Day Treasury Bills, FTSE® NAREIT All Equity REITs, J.P. Morgan ELMI+, J.P. Morgan GBI-EM Global Diversified, MSCI Emerging Markets, MSCI World, Russell 2000®, S&P 500, and S&P GSCI™ indexes.
Euro index performance chart includes performance for the Bloomberg Barclays Euro-Aggregate: Corporate, Bloomberg Barclays Pan-Euro High Yield, Citigroup EMU Govt Bonds, Citigroup Euro Broad Investment-Grade Bonds, Euribor 3-month, FTSE® EPRA/NAREIT Europe ex UK, J.P. Morgan ELMI+, J.P. Morgan GBI-EM Global Diversified, MSCI Emerging Markets, MSCI Europe, MSCI Europe ex UK, MSCI Europe Small-Cap, MSCI World ex EMU, MSCI World, and S&P GSCI™ indexes.
UK sterling index performance chart includes performance for the Bloomberg Barclays Sterling Aggregate: Corporate Bond, BofA Merrill Lynch Sterling High Yield, FTSE® 250, FTSE® All-Share, FTSE® British Government All Stocks, FTSE® British Government Index-Linked All Stocks, FTSE® EPRA/NAREIT UK RE, J.P. Morgan ELMI+, J.P. Morgan GBI-EM Global Diversified, LIBOR 3M GBP, MSCI Emerging Markets, MSCI Europe ex UK, MSCI World, MSCI World ex UK, and S&P GSCI™ indexes.
Valuation Exhibits
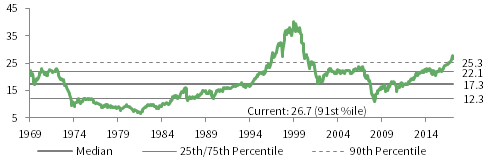
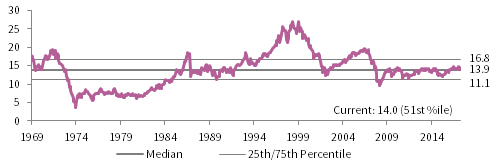
The composite normalized P/E ratio is calculated by dividing the inflation-adjusted index price by the simple average of three normalized earnings metrics: ten-year average real earnings (i.e., Shiller earnings), trend-line earnings, and return on equity–adjusted earnings. We have removed the bubble years 1998–2000 from our mean and standard deviation calculations. All data are monthly.
Fixed Income Yields
US fixed income yields reflect Bloomberg Barclays Municipal Bond Index, Bloomberg Barclays US Corporate High-Yield Bond Index, Bloomberg Barclays US Corporate Investment-Grade Bond Index, and the ten-year Treasury.
European fixed income yields reflect the BofA Merrill Lynch Euro Corporate AA Bond Index, BofA Merrill Lynch Euro Corporate Bond Index, Barclays Pan-European Aggregate High Yield Bond Index, Bloomberg Twenty-Year European Government Bond Index (nominal), ten-year German bund, 20-year European Inflation Swaps (inflation expectations), and the real yield calculated as the difference between the inflation expectation and nominal yield.
UK sterling fixed income yields reflect the BofA Merrill Lynch Sterling Corporate AA Bond Index, BofA Merrill Lynch Sterling Corporate Bond Index, UK ten-year gilts, Bank of England 20-year nominal yields, and Bloomberg Generic UK 20-year inflation-linked (real) yields.
