February saw the reflation trade continue for equities but not for other asset classes. Global equities touched an all-time high, driven in large part by the continued post-election rally in US stocks. Developed markets equities outperformed emerging markets equivalents in local currency terms as a result, but broad emerging markets currency strength flipped this result for unhedged investors in major developed currencies. Global investment-grade bonds also advanced as correlations with stocks turned positive after having been negative in recent months. The decline in bond yields helped spark a rally in developed markets REITs, which outperformed global equities for just the second month since July. Returns were weakest for natural resources equities, which declined, as well as for commodities, energy MLPs, and US TIPS, which were all barely positive.
In recent weeks, equity and bond markets have seemed of two minds with respect to the outlook. Measures of both implied and realized market volatility have steadily declined since jumping higher around the time of the US presidential election, although bond market volatility has remained somewhat elevated while equity market volatility has been particularly subdued. The contrast could be an indication that stock and bond investors are assessing the risks to the outlook differently or it could just reflect some bond investors repositioning after the sharp post-election moves. Stocks have been buoyant, grinding steadily higher in response to strong positive momentum in sentiment indicators and hard economic data, as well as to clear signs from fourth quarter 2016 earnings results that the recent global profit recession has ended. US equities, specifically, also appear to be pricing in significant optimism regarding the prospects for corporate tax cuts in particular, along with the potential for de-regulation and infrastructure spending. Bond market performance has been choppier by comparison, as some investors took advantage of higher yields to close out shorts or to establish new longs to hedge against heightened policy uncertainty, particularly in Europe, amid a broader rotation out of bonds and into equities.
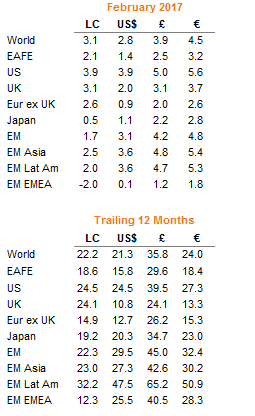
Total Return for MSCI Indexes (%)
US equities (4.0%) outperformed global equivalents as large-cap indexes recorded multiple all-time highs during the month. Reflecting the market’s recent optimism, the S&P 500 has not recorded a daily loss of more than 1% in nearly 100 trading days, the longest streak since 1995. On the earnings front, year-over-year growth in earnings per share (EPS) was positive for the second consecutive quarter, driven by strong top-line growth. Despite the positive earnings momentum, US equity valuations look increasingly stretched; our composite normalized price-earnings (P/E) ratio for the MSCI US Index is in the 89th percentile of observations dating back to December 1969. US small caps (1.9%) underperformed large caps for a second straight month as investors appear to be waiting for earnings results to justify particularly lofty small-cap valuations (our composite normalized P/E for the Russell 2000® remains in the 100th percentile of observations since December 1978) following the post-election rally.
European equities advanced but failed to outperform developed markets peers despite regional stocks enjoying double-digit earnings growth in the fourth quarter on a year-over-year basis. UK stocks (3.1%) outpaced Europe ex UK (2.6%) and EMU (2.6%) equivalents despite particularly strong earnings results in the Eurozone, which greatly exceeded expectations coming into the reporting season. Heightened economic and political uncertainty has weighed on sentiment. The UK government appears set to trigger Article 50 negotiations by its March 31 deadline to begin the process of exiting the EU, and Dutch and French elections loom in March and April, respectively. Markets appear most concerned regarding prospects for anti-EU candidate Marine Le Pen to win the French presidential election. While the latest polls continue to show that either of her two main rivals would win a second-round runoff, the predictive ability of such surveys could be questioned in light of the Brexit and US election pre-polling and ultimate results. Regardless of the outcome, the potential exists for heightened volatility around the French election.
Japanese equities (0.5%) recorded slight gains but meaningfully under-performed global peers. As with Eurozone equities, Japanese stocks lagged despite positive double-digit EPS growth, which was in direct contrast to expectations for earnings declines prior to the latest set of results. Japan’s stock market maintains its close negative correlation to the currency, which strengthened in February, presenting a headwind to Japanese equities.
Emerging markets equities underperformed developed markets counterparts by 141 basis points (bps) in local currency terms, but outperformed by 29 bps in euro, pound, and USD terms. However, EM stocks lead year-to-date and over the trailing 12-month period. Regional performance was mixed in February as emerging Asia and Latin America posted decent returns while emerging Europe, the Middle East, and Africa trailed, dragged lower by weak performance in index heavyweights Russia and South Africa. Of the overall index’s five largest country weights—China, Korea, Taiwan, India, and Brazil—all matched or outperformed the index in euro, pound, and USD terms.
Real assets experienced a wide range of performance outcomes depending on the category. Commodities were roughly flat (0.2% for both the Bloomberg Commodity TR Index and the energy-heavy S&P GSCI™) as losses in the energy and agriculture categories offset gains in precious metals, industrial metals, and livestock. Losses in the energy complex were mostly driven by a sharp decline in natural gas prices (-11.0%), whereas crude oil prices were more stable, with Brent (-0.2%) roughly flat and WTI actually increasing 2.3% to $54.01/barrel. Gold advanced 3.7% to $1,256.64/troy ounce. Natural resources equities declined (-1.9% in local currency and -2.4% in USD) despite gains in most underlying commodities, with both energy and metals & mining stocks experiencing losses. Returns for energy MLPs (0.4%) were barely positive. Lower bond yields gave a boost to developed markets REITs (4.9%).
Developed markets investment-grade bonds advanced as yields fell in several major markets. UK gilts (3.1%) rallied in response to signs that the economy may be weakening as the latest consumption data disappointed. Gains for EMU government bonds (1.2%) were driven by demand for German bunds, as investors sought refuge from rising political and economic risks in France and Italy, where sovereign spreads widened. Yields for five- and ten-year gilts fell 23 bps and 35 bps to 0.37% and 1.07%, respectively. US Treasuries (0.5%) experienced more modest gains; yields on the five-year and the ten-year US Treasury bond fell 1 bp and 9 bps to 1.89% and 2.36%, respectively. US tax-exempt bonds (0.7%) edged out Treasuries. Corporate credit spreads continued to tighten as US investment-grade corporate bonds (1.1%) and US high-yield bonds (1.5%) also outperformed. Returns for inflation-linked bonds were also positive; US TIPS (0.5%) performed in line with nominal Treasuries, while UK linkers (1.1%) underperformed nominal gilts.
Some currencies exhibited stronger directional trends than others. The US dollar appreciated relative to the euro, Canadian dollar, Swiss franc, and UK sterling but weakened vis-à-vis the Australian dollar, our equal-weighted EM currency basket, and the Japanese yen—these last three also strengthened against the euro and the British pound. The euro was weak across the board, continuing the trend of the last 12 months; the only major currency to have depreciated against the common currency over the past year was the pound. However, sterling appreciated relative to the euro in February, as well as against the Swiss franc and Canadian dollar.
Market Exhibits
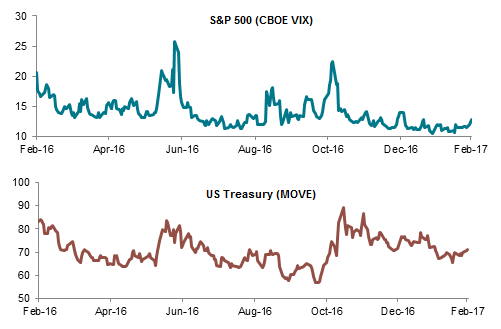
Implied Volatility of S&P 500 and US Treasury Market
Implied market volatility has declined since jumping higher around the US presidential election. Equity volatility has been particularly subdued given positive fundamental momentum and ongoing optimism regarding economic policy. Bond volatility has remained somewhat elevated in contrast, perhaps reflecting a more uncertain outlook for both fiscal and monetary policy
Implied Volatility of S&P 500 and US Treasury Market
February 29, 2016 – February 28, 2017 • Index Level
Sources: Bloomberg L.P., BofA Merrill Lynch, Chicago Board Options Exchange, and Thomson Reuters Datastream.
Notes: The Chicago Board Options Exchange Volatility Index (VIX) measures the implied volatility of near-term S&P 500 Index options. The Merrill Lynch Option Volatility Estimates (MOVE) Index is a yield curve–weighted index of the normalized implied volatility on one-month Treasury options. It is the weighted average of volatilities on the two-, five-, ten-, and 30-year Treasury contracts. Data are daily.
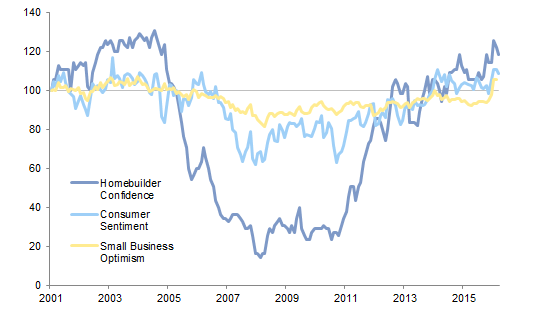
US Economic Sentiment Indicators
Several measures of US economic sentiment recently touched their highest levels since the global financial crisis, reflecting heightened expectations for the new government’s policies to help boost economic growth above the sluggish rate of the current expansion
US Economic Sentiment Indicators
December 31, 2001 – February 28, 2017 • Rebased to 100 on December 31, 2001
Sources: National Association of Home Builders, National Federation of Independent Business, Thomson Reuters Datastream, and University of Michigan.
Notes: US economic sentiment represented by: US National Association of Homebuilders Housing Market Index (“Homebuilder Confidence”), University of Michigan Consumer Sentiment Index (“Consumer Sentiment”), and US NFIB Small Business Optimism Index (“Small Business Optimism”). Small business optimism data are as of January 31, 2017.
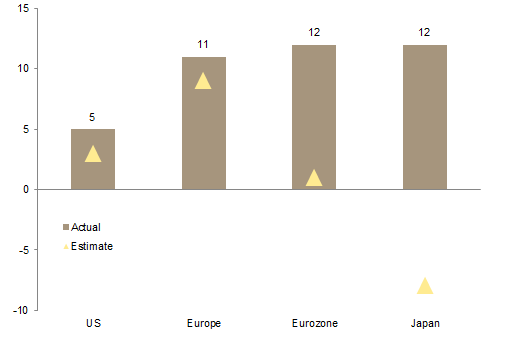
Fourth Quarter 2016 Year-Over-Year EPS Growth
Fourth quarter results showed positive year-over-year earnings growth across developed markets equity regions for the first time in six quarters, a strong indication that the global earnings recession has ended. EPS growth in the Eurozone and Japan surprised meaningfully to the upside relative to earlier consensus estimates
Fourth Quarter 2016 Year-Over-Year EPS Growth
As of Fourth Quarter 2016 • Percent Change (%)
Sources: FactSet Research Systems, J.P. Morgan Securities, Inc., and Standard & Poor’s.
Notes: EPS growth numbers show actual EPS growth in fourth quarter 2016 versus EPS growth estimates based on earnings surprise data reported in J.P. Morgan Cazenove’s “Equity Strategy: Q4 Earnings Season Tracker,” published February 24, 2017. Regions represented by: US (S&P 500), Europe (Stoxx 600), Eurozone (Euro Stoxx), and Japan (Topix).
Cumulative Returns for Risk Assets Since Q1 2016 Market Trough
Global risk assets have staged sizable recoveries since the first quarter 2016 market trough as fears regarding China’s financial stability and related deflationary risks have subsided. In recent months, risk markets have been supported by synchronous acceleration across several major economies as well as expectations for more reflationary economic policies
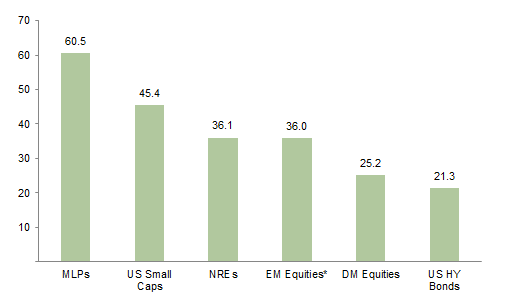
Cumulative Returns for Risk Assets Since Q1 2016 Market Trough
February 11, 2016 – February 28, 2017 • Price Return (%) • US Dollars
Sources: Alerian, Barclays, Bloomberg L.P., Frank Russell Company, MSCI Inc., and Thomson Reuters Datastream. MSCI data provided “as is” without any express or implied warranties.
Notes: Asset classes represented by: Alerian MLP Index (“MLPs”), Russell 2000® Index (“US Small Cap”), MSCI World Natural Resources Index (“NREs), MSCI Emerging Markets Index (“EM Equities”), MSCI World Index (“DM Equities”), and Bloomberg Barclays US Corporate High Yield Index (“US HY Bonds”). Cumulative return for MLPs is calculated with data through February 24.
* EM equities data begin at trough on January 21, 2016.
Currency Performance
The US dollar was range bound, appreciating against the euro, Canadian dollar, Swiss franc, and UK sterling but falling relative to the Australian dollar, our equal-weighted EM currency basket, and the Japanese yen
The euro weakened across the board, continuing the trend of the last 12 months and losing the most ground against the Australian dollar, EM currencies, and the yen—all three also strengthened vis-à-vis the greenback and the British pound. The latter is the only currency against which the common currency has appreciated over the past year
Pound sterling has been more stable in recent months, but fell double digits against most currencies over the past year. In February, UK sterling strengthened modestly versus the euro, Canadian dollar, and Swiss franc but depreciated relative to the Australian dollar, EM currencies, the yen, and the US dollar
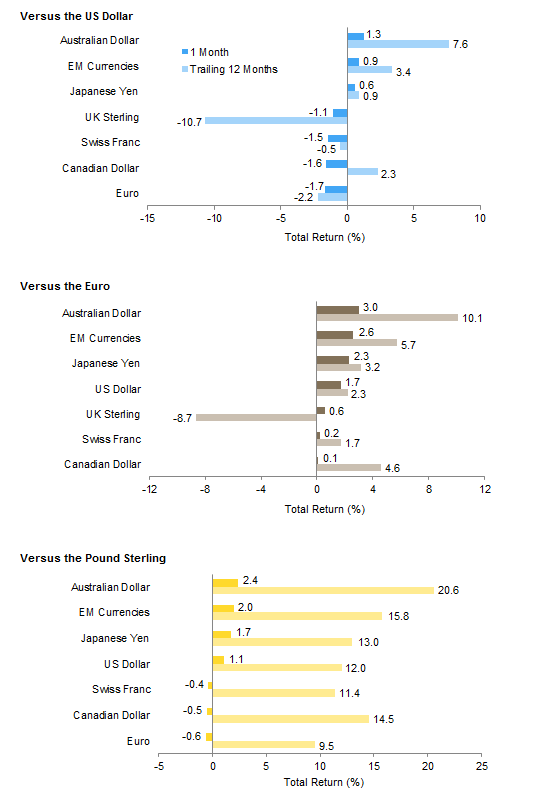
Currency Performance
As of February 28, 2017
Sources: MSCI Inc. and Thomson Reuters Datastream. MSCI data provided “as is” without any express or implied warranties.
Note: EM currencies is an equal-weighted basket of 20 currencies.
Index Performance (US$)
USD investors enjoyed gains across a wide array of asset classes, led by US REITs and US large-cap equities, which outperformed global peers. Emerging markets equities outperformed developed markets equivalents in USD terms. US Treasuries posted modest gains but were outperformed by US municipal bonds, US investment-grade corporates, and US high-yield bonds
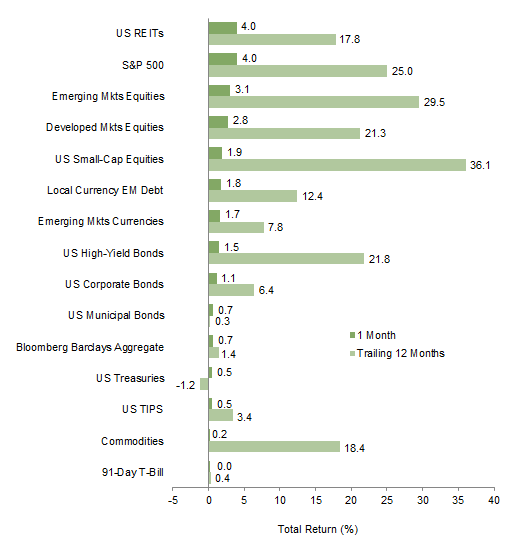
Index Performance (US$)
As of February 28, 2017

MSCI US Composite Normalized P/E
December 31, 1969 – February 28, 2017
Sources: Barclays, Bloomberg L.P., BofA Merill Lynch, FTSE International Limited, Frank Russell Company, J.P. Morgan Securities, Inc., MSCI Inc., National Association of Real Estate Investment Trusts, Standard & Poor’s, and Thomson Reuters Datastream. MSCI data provided “as is” without any express or implied warranties.
Fixed Income Yields
February 2016 – February 2017
Index Performance (€)
European equities underperformed both developed and emerging markets equivalents as political risks have weighed on sentiment despite recent positive earnings momentum. Euro weakness helped emerging markets equities and debt to outperform. European bonds advanced but underperformed equities, with high-yield and investment-grade bonds performing roughly in line

Index Performance (€)
As of February 28, 2017

MSCI Europe ex UK Composite Normalized P/E
December 31, 1969 – February 28, 2017
Sources: Barclays, Bloomberg L.P., Citigroup Global Markets, EPRA, FTSE International Limited, J.P. Morgan Securities, Inc., MSCI Inc., National Association of Real Estate Investment Trusts, Standard & Poor’s, and Thomson Reuters Datastream. MSCI data provided “as is” without any express or implied warranties.
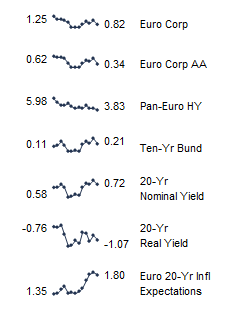
Fixed Income Yields
February 2016 – February 2017
Index Performance (£)
UK gilts rallied and kept pace with UK equities, which underperformed global equivalents in pound sterling terms. The sharp drop in gilt yields sparked a rebound in UK REITs, though they have significantly lagged most UK assets over the trailing 12 months. Emerging markets currency strength helped EM stocks to outperform developed markets counterparts
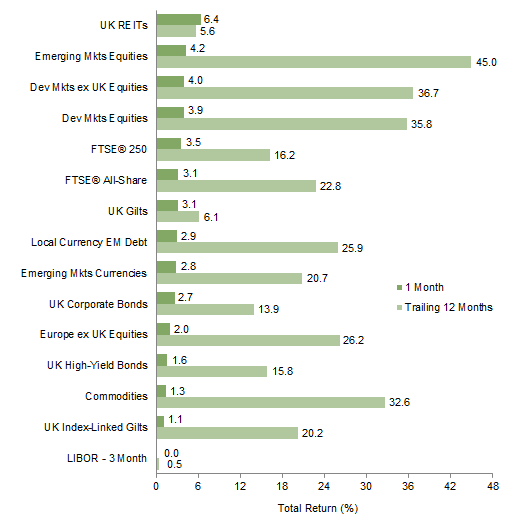
Index Performance (£)
As of February 28, 2017
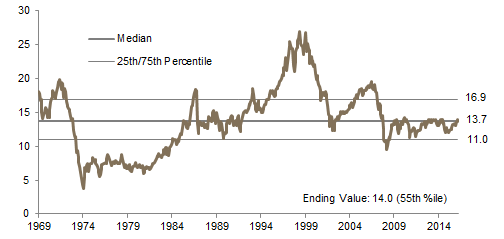
MSCI UK Composite Normalized P/E
December 31, 1969 – February 28, 2017
Sources: Barclays, Bloomberg L.P., BofA Merill Lynch, EPRA, FTSE International Limited, J.P. Morgan Securities, Inc., MSCI Inc., National Association of Real Estate Investment Trusts, Standard & Poor’s, and Thomson Reuters Datastream. MSCI data provided “as is” without any express or implied warranties.
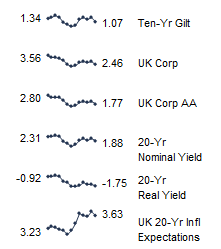
Fixed Income Yields
February 2016 – February 2017
Exhibit Notes
Performance Exhibits
Total return data for all MSCI indexes are net of dividend taxes.
US dollar index performance chart includes performance for the Bloomberg Barclays Aggregate Bond, Bloomberg Barclays Corporate Investment Grade, Bloomberg Barclays High-Yield Bond, Bloomberg Barclays Municipal Bond, Bloomberg Barclays US TIPS, Bloomberg Barclays US Treasuries, BofA Merrill Lynch 91-Day Treasury Bills, FTSE® NAREIT All Equity REITs, J.P. Morgan ELMI+, J.P. Morgan GBI-EM Global Diversified, MSCI Emerging Markets, MSCI World, Russell 2000®, S&P 500, and S&P GSCI™ indexes.
Euro index performance chart includes performance for the Bloomberg Barclays Euro-Aggregate: Corporate, Bloomberg Barclays Pan-Euro High Yield, Citigroup EMU Govt Bonds, Citigroup Euro Broad Investment-Grade Bonds, EURIBOR 3M, FTSE® EPRA/NAREIT Europe ex UK, J.P. Morgan ELMI+, J.P. Morgan GBI-EM Global Diversified, MSCI Emerging Markets, MSCI Europe, MSCI Europe ex UK, MSCI Europe Small-Cap, MSCI World ex EMU, MSCI World, and S&P GSCI™ indexes.
UK sterling index performance chart includes performance for the Bloomberg Barclays Sterling Aggregate: Corporate Bond, BofA Merrill Lynch Sterling High Yield, FTSE® 250, FTSE® All-Share, FTSE® British Government All Stocks, FTSE® British Government Index-Linked All Stocks, FTSE® EPRA/NAREIT UK RE, J.P. Morgan ELMI+, J.P. Morgan GBI-EM Global Diversified, LIBOR 3M GBP, MSCI Emerging Markets, MSCI Europe ex UK, MSCI World, MSCI World ex UK, and S&P GSCI™ indexes.
Valuation Exhibits
The composite normalized P/E ratio is calculated by dividing the inflation-adjusted index price by the simple average of three normalized earnings metrics: ten-year average real earnings (i.e., Shiller earnings), trend-line earnings, and return on equity–adjusted earnings. We have removed the bubble years 1998–2000 from our mean and standard deviation calculations. All data are monthly.
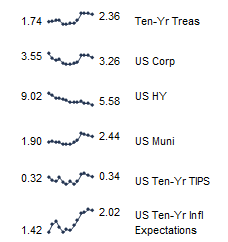
Fixed Income Yields
US fixed income yields reflect Bloomberg Barclays Municipal Bond Index, Bloomberg Barclays US Corporate High-Yield Bond Index, Bloomberg Barclays US Corporate Investment-Grade Bond Index, and the ten-year Treasury.
European fixed income yields reflect the BofA Merrill Lynch Euro Corporate AA Bond Index, BofA Merrill Lynch Euro Corporate Bond Index, Barclays Pan-European Aggregate High Yield Bond Index, Bloomberg Twenty-Year European Government Bond Index (nominal), ten-year German bund, 20-year European Inflation Swaps (inflation expectations), and the real yield calculated as the difference between the inflation expectation and nominal yield.
UK sterling fixed income yields reflect the BofA Merrill Lynch Sterling Corporate AA Bond Index, BofA Merrill Lynch Sterling Corporate Bond Index, UK ten-year gilts, and Bank of England 20-year nominal, real, and zero coupon (inflation expectations) yields.