February’s market performance was a tale of two halves, with global risk assets experiencing a steep decline over the first two weeks before rallying to erase most of these losses. Falling oil prices and their continued elevated correlations with risk assets drove global equities and US high-yield bonds to touch new cycle lows toward mid-month before strongly recovering into month-end. Sovereign bonds sustained their recent rally and again outperformed equities, with ten-year government bond yields in some markets falling toward historic lows. The price of gold has similarly benefitted from investors’ ongoing risk aversion, having appreciated more than any major asset class this year. Safe-haven flows also appeared to benefit the Japanese yen and Swiss franc; the US dollar weakened against other major currencies except the British pound, which now sits at a level only seen during past economic crises.
China’s economic slowdown, depressed commodity prices and manufacturing activity, falling global trade, the strong dollar, historically low government bond yields, and elevated credit spreads continue to cloud the economic picture, with markets increasingly fixated on whether a global downturn is imminent or perhaps already underway. In the United States, despite disappointing fourth quarter growth of 1.0%, consensus forecasts for first quarter real GDP growth are around 2.0%, though reduced trade and high inventories remain headwinds. Still, models estimating the probability of a US recession indicate that risks, though rising, remain at levels from which they have retreated without a contraction in the past. Such data points suggest that the US economy, while recently experiencing a soft patch, will continue in expansion mode in 2016. If the global economy does succumb to a recession this year, the US economy seems unlikely to be the root cause.
Nevertheless, global recession fears appear to be spreading, with developed markets bank stocks falling more than 18% in the past three months based on the MSCI World Banks Index. The reasons are manifold, some universal and others country or region specific. Markets are clearly concerned about the profit outlook for bank stocks throughout developed markets given new regulatory regimes and potential unintended consequences of extraordinary monetary policies. Litigation and related costs stemming from the global financial crisis also seem never ending. Further, falling government bond yields and flattening yield curves are squeezing net interest margins. Investors fear that Japanese banks in particular will be hurt by the Bank of Japan’s negative interest rate policy due to their sizable holdings of Japanese government bonds and the uncertainty caused by the unexpected policy shift. Recent poor results and negative forward guidance issued by some of the major European banks have triggered renewed concerns regarding their balance sheet health, as evidenced by the recent spike in bank credit spreads. Ongoing nonperforming loan issues have hurt peripheral European bank shares, as has uncertainty around new rules requiring creditors and depositors to be “bailed in” to future bank rescues. The prolonged oil price slump has heightened concerns about US banks’ exposure to distressed energy producers, as well as the potential for negative second-order impacts on loan books if the commodity and manufacturing slump spills over into commercial real estate or auto loans. None of these issues is necessarily new, but the market appears to have begun projecting its nervousness onto the banking sector in recent months.
US equities (-0.1% as measured by the S&P 500) outperformed other developed markets in aggregate. Large caps and small caps performed in line, while value stocks barely edged out growth shares. Financials suffered further losses, and the energy, information technology, and health care sectors also declined. Materials stocks rallied, led by gold miners, as did industrials; the high-yielding utilities and telecom sectors also enjoyed meaningful gains, while consumer sector returns were muted. Fourth quarter operating earnings fell on a year-over-year basis, as expected, with the energy and materials sectors continuing to register the largest profit declines. Healthier earnings growth for the telecom, consumer discretionary, and health care sectors continued, with telecom earnings again benefitting from favorable year-over-year comparisons. Yet last quarter’s results confirmed that earnings failed to grow in 2015, and lackluster growth is now forecast for 2016, with first quarter earnings expected to register further declines.
European equities (-1.9%) were led by UK equities (0.9%), which again outpaced Europe ex UK and EMU (-3.0%) markets. Japanese equities (-9.3%) were the worst-performing developed market and have now fallen over 16% this year. London-listed energy and materials stocks in particular enjoyed strong rallies, which helped drive the United Kingdom’s outperformance. Year-to-date performance of Eurozone and Japanese stocks marks a stark reversal from the strong gains of the last two years. While 2016 earnings-growth estimates for Japanese and EMU equities remain superior to those of US and UK equivalents, earnings expectations in the former have been ratcheted down the most in light of recent economic developments.
Emerging markets equities (0.1%) were flat, which was good enough to outperform developed markets in both local currency and major developed markets currency terms. Latin America (2.9%) outperformed on the back of improved performance by Brazil (5.2%), whereas emerging Asia (-0.7%) declined as losses in India (-6.7%) and China (-2.6%) more than offset gains in Taiwan (3.8%) and Thailand (4.2%). Economic activity in China continues to slow, with February’s Purchasing Managers Index (PMI) readings falling to levels not seen since the depths of the 2008–09 global financial crisis; even the previously resilient services PMI disappointed. The Chinese central bank responded on February 29 by further easing monetary policy through the bank reserve requirement channel. The central government is about to convene its annual economic planning session with expectations for some additional fiscal stimulus in the upcoming budget. These moves suggest that Chinese policymakers still have levers at their disposal, and easier monetary policy could reflect that the central bank believes the currency is now on firmer ground.
Performance of inflation-sensitive assets was mixed, and muted returns for some categories belie substantial intra-month volatility. Commodity futures suffered modest losses (-1.6% for the Bloomberg Commodity TR Index and -2.0% for the energy-heavy S&P GSCI™) as the movement of spot prices across the commodity complex was more varied compared to recent months. Crude oil prices retested their recent lows before rallying back above $30/barrel, first in response to reported discussions between some OPEC members and Russia regarding a potential coordinated global supply freeze, and later in reaction to several US oil producers announcing production cuts for 2016. Gold (10.4%) rallied further amid widespread risk aversion. Natural resources equities (1.7%) were led higher by gold mining stocks, which soared with the price of the underlying metal; energy stocks declined (-0.7%), but by their smallest amount since November. The aggregate gains of natural resources equities came despite record losses and dividend cuts recently announced by several large diversified mining and energy companies, reflecting that considerable negative sentiment was already priced in. After three months of substantial losses, energy master limited partnerships fell just 0.5% in February, although the month was another rollercoaster, with unit prices continuing to exhibit high correlation to crude. US REITs (-0.4%) performed in line with the broader equity market, while UK REITs (-6.4%) fell sharply. US TIPS (1.1%) rallied, with the five-year yield falling back into negative territory, while UK linkers were flat.
Global government bonds (1.2%) rallied further as investors again favored their relative safety, with UK gilts (1.4%) outpacing EMU sovereign bonds (1.0%) and US Treasuries (0.9%). US tax-exempt bonds (0.2%) showed more muted gains. The US Treasury yield curve continued to flatten, with ten-year and five-year yields falling 20 bps and 11 bps to 1.74% and 1.22%, respectively, while the three-month yield remained unchanged at 0.33%. Corporate credit spreads tightened as US investment-grade corporate bonds (0.8%) and US high-yield bonds (0.6%) rebounded from earlier losses.
The US dollar was weaker against most major developed markets currencies save the British pound, which continued its retreat as Prime Minister David Cameron negotiated a new agreement for the United Kingdom with the European Union, which will be put to a referendum in June. The pound ended the month below $1.40, a level only seen during past crisis periods, including the global financial crisis and the pound’s famous September 1992 departure from the European exchange rate mechanism. In contrast to the plummeting pound, the Japanese yen staged a surprising rally over the month. The yen initially fell after the central bank announced its “quantitative and qualitative monetary easing with a negative interest rate” policy on January 29, but began rallying within a day of the announcement, and over the past three months has appreciated over 8% versus the US dollar and over 10% versus the Chinese yuan.
While risks of a near-term US recession have risen, most indicators still suggest that the US economy will avoid contraction in 2016

Probability of US Recession
June 30, 1967 – December 31, 2015 • Percent (%)
Sources: Federal Reserve Bank of St. Louis and Ned Davis Research, Inc.
Notes: Shaded areas indicate NBER-defined recessions. Recession probability based on St. Louis Fed Model. Smoothed recession probabilities for the United States are obtained from a dynamic-factor markov-switching model applied to four monthly coincident variables: non-farm payroll employment, the index of industrial production, real personal income excluding transfer payments, and real manufacturing and trade sales.
Government bond yields have fallen to historic levels, reflecting global deflationary forces and extraordinary monetary policies, including the widening adoption of negative central bank deposit rates and growing indications that the Fed will not hike rates this year

Ten-Year Government Bond Yields
January 1, 2014 – February 29, 2016 • Percent (%)
Sources: Bank of England, Federal Reserve, and Thomson Reuters Datastream.
Note: Data are daily.
Following the recent global bank sell-off, developed markets financials are now cheaper than any sector on a price-to-book basis in absolute terms, and only energy stocks trade at a larger discount relative to their own recent history

MSCI World P/B Ratios by Sector vs Historical Median
As of February 29, 2016
Sources: MSCI Inc. and Thomson Reuters Datastream. MSCI data provided “as is” without any express or implied warranties.
Amid fears that UK voters will reject EU membership in the upcoming June referendum, the British pound has plummeted, finishing the month below $1.40, a level not seen since the global financial crisis
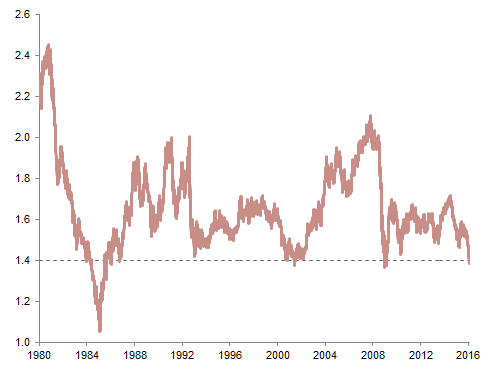
GBP/USD Exchange Rate
January 1, 1980 – February 29, 2016 • Percent (%)
Sources: Thomson Reuters Datastream and WM/Reuters.
Note: Data are daily.
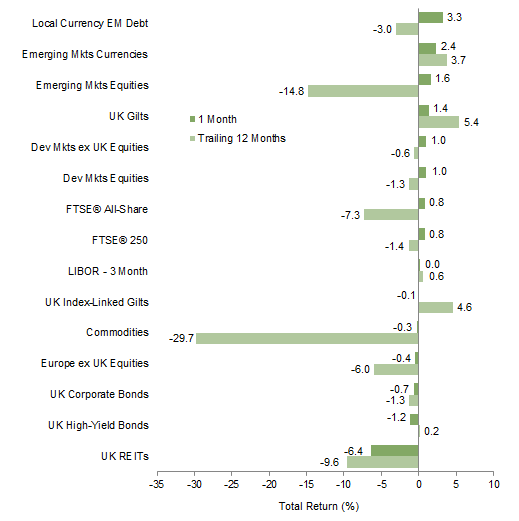
US bonds enjoyed solid gains, while US and international equities experienced modest declines after paring more severe prior losses. US corporate credit spreads ultimately tightened after corporate bonds swung from losses to gains, another sign that some risk appetite returned to markets toward month-end

Index Performance (US$)
As of February 29, 2016

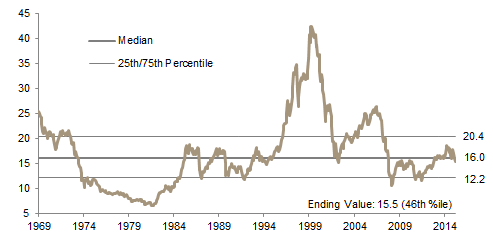
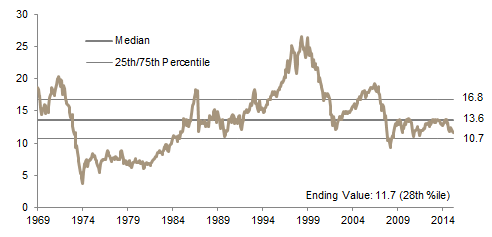
MSCI US Composite Normalized P/E
December 31, 1969 – February 29, 2016
Sources: Barclays, BofA Merill Lynch, FTSE International Limited, Frank Russell Company, J.P. Morgan Securities, Inc., MSCI Inc., National Association of Real Estate Investment Trusts, Standard & Poor’s, and Thomson Reuters Datastream. MSCI data provided “as is” without any express or implied warranties.
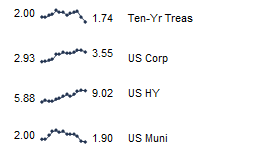
Fixed Income Yields
February 2015 – February 2016
European investment-grade sovereign and corporate bonds rallied, while Eurozone high-yield bonds retreated. Europe ex UK equities continued their recent declines and underperformed international peers, while European small caps resumed their leadership over large caps

Index Performance (€)
As of February 29, 2016
MSCI Europe ex UK Composite Normalized P/E
December 31, 1969 – February 29, 2016
Sources: Barclays, Citigroup Global Markets, EPRA, FTSE International Limited, J.P. Morgan Securities, Inc., MSCI Inc., National Association of Real Estate Investment Trusts, Standard & Poor’s, and Thomson Reuters Datastream. MSCI data provided “as is” without any express or implied warranties.
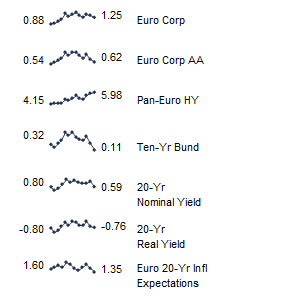
Fixed Income Yields
February 2015 – February 2016
Pound sterling weakness led UK equities to underperform most foreign stock markets for UK-based investors, with Europe ex UK equities the main exception. UK gilts continued to rally, outperforming domestic equities, while UK corporate bond spreads widened and UK REITs suffered sizable losses
Index Performance (₤)
As of February 29, 2016
MSCI UK Composite Normalized P/E
December 31, 1969 – February 29, 2016
Sources: Barclays, BofA Merrill Lynch, EPRA, FTSE International Limited, J.P. Morgan Securities, Inc., MSCI Inc., National Association of Real Estate Investment Trusts, Standard & Poor’s, and Thomson Reuters Datastream. MSCI data provided “as is” without any express or implied warranties.

Fixed Income Yields
February 2015 – February 2016
The US dollar broadly weakened as investors cut long dollar positions in reaction to signs that the pace of US rate hikes will be slower than previously thought
Like the US dollar, the euro retreated versus Japanese yen, Canadian dollar, Swiss franc, and Australian dollar and appreciated versus the British pound. The euro/dollar exchange rate has stabilized in recent months
The British pound depreciated sharply against virtually all global currencies amid heightened fears that UK voters will choose to exit the European Union, upsetting the country’s trade balance in the process
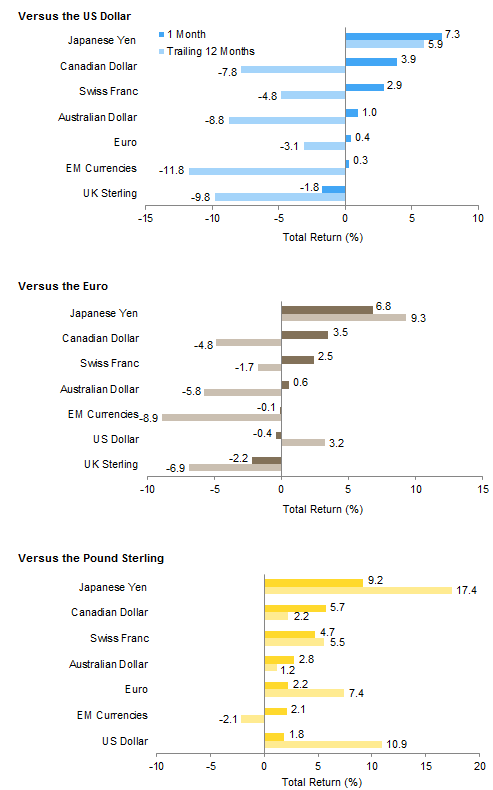
Currency Performance
As of February 29, 2016
Sources: MSCI Inc. and Thomson Reuters Datastream. MSCI data provided “as is” without any express or implied warranties.
Note: EM currencies is an equal-weighted basket of 20 currencies.
Exhibit Notes
Performance Exhibits
Total returns for MSCI developed markets indexes are net of dividend taxes. Total returns for MSCI emerging markets indexes are gross of dividend taxes.
US dollar index performance chart includes performance for the Barclays Corporate Investment Grade, Barclays High Yield Bond, Barclays Municipal Bond, Barclays US TIPS, Barclays US Treasuries, BofA Merrill Lynch 91-Day Treasury Bills, FTSE® NAREIT All Equity REITs, J.P. Morgan ELMI+, J.P. Morgan GBI-EM Global Diversified, MSCI Emerging Markets, MSCI World, Russell 2000®, and S&P GSCI™ indexes.
Euro index performance chart includes performance for the Barclays Euro-Aggregate: Corporate, Barclays Pan-Euro High Yield, Citigroup EMU Govt Bonds, FTSE® EPRA/NAREIT Europe ex UK, J.P. Morgan ELMI+, J.P. Morgan GBI-EM Global Diversified, MSCI Emerging Markets, MSCI Europe, MSCI Europe ex UK, MSCI Europe Small Cap, MSCI World ex EMU, MSCI World, and S&P GSCI™ indexes.
UK sterling index performance chart includes performance for the Barclays Sterling Agg Corps, BofA Merrill Lynch Sterling High Yield, FTSE® British Government All Stocks, FTSE® British Government Index-Linked All Stocks, FTSE® EPRA/NAREIT UK RE, FTSE® 250, J.P. Morgan ELMI+, J.P. Morgan GBI-EM Global Diversified, MSCI Emerging Markets, MSCI Europe ex UK, MSCI World, MSCI World ex UK, and S&P GSCI™ indexes.
Valuation Exhibits
The composite normalized P/E ratio is calculated by dividing the inflation-adjusted index price by the simple average of three normalized earnings metrics: ten-year average real earnings (i.e., Shiller earnings), trend-line earnings, and return on equity–adjusted earnings. We have removed the bubble years 1998–2000 from our mean and standard deviation calculations. All data are monthly.
Fixed Income Yields
US fixed income yields reflect Barclays Municipal Bond Index, Barclays US Corporate High Yield Bond Index, Barclays US Corporate Investment-Grade Bond Index, and the ten-year Treasury.
European fixed income yields reflect the BofA Merrill Lynch Euro Corporate AA Bond Index, BofA Merrill Lynch Euro Corporate Bond Index, Barclays Pan-European Aggregate High Yield Bond Index, Bloomberg Twenty-Year European Government Bond Index (nominal), ten-year German bund, 20-year European Inflation Swaps (inflation expectations), and the real yield calculated as the difference between the inflation expectation and nominal yield.
UK sterling fixed income yields reflect the BofA Merrill Lynch Sterling Corporate AA Bond Index, BofA Merrill Lynch Sterling Corporate Bond Index, UK ten-year gilts, and Bank of England 20-year nominal, real, and zero coupon (inflation expectations) yields.