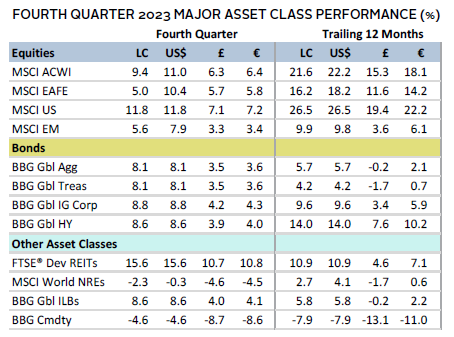
Risk assets soared in Q4, sending calendar-year returns for several asset classes to multiyear highs. Equities led the way, boosted by US stocks. Broad developed markets (DM) stocks outgained emerging markets (EM) equivalents, which were limited by China’s 5% decline. Global small caps edged large-cap peers but lagged over the full year. Growth equities continued their strong run in 2023, outperforming value stocks by more than 20 percentage points (ppts). Bond markets experienced the greatest quarterly advance in more than two decades as yields retreated. Real assets were mixed in Q4—real estate benefited from declining interest rates, while commodity futures and natural resources equities declined on falling energy prices. Among currencies in Q4, the US dollar declined, while UK sterling and euro were mixed.
Sources: Bloomberg Index Services Limited, Bloomberg L.P., EPRA, FTSE International Limited, MSCI Inc., National Association of Real Estate Investment Trusts, and Thomson Reuters Datastream. MSCI data provided “as is” without any express or implied warranties.
Note: Local currency returns for the Bloomberg fixed income indexes, the Bloomberg Commodity Index, and the FTSE® Developed REITs are in USD terms.
The Macro Picture
Inflation declined faster than expected across several major economies in Q4, decelerating to the lowest rates in more than two years in the United States, Europe, and United Kingdom. This led investors to price in rate cuts sooner than prior expectations, while central banks—including the Bank of England (BOE) and European Central Bank (ECB)—continued to warn that rates would likely remain higher for longer. Nevertheless, investor convictions for lower rates deepened significantly after the Federal Reserve surprised markets in its December economic projections showing 75 basis points (bps) of rate cuts by the end of 2024 compared to the 50 bps of rate cuts projected in September. As a result, global government bond yields fell materially, and bonds notched their largest quarterly return in more than two decades. Lower rate expectations also boosted global stock prices, resulting in a top decile return over the same period. Indeed, rate cut expectations were further bolstered by data suggesting that major economies were softening.
Q3 GDP growth turned negative across most major markets, highlighted by Eurozone GDP unexpectedly flatlining, the German economy declining, and Japanese GDP falling more than predicted. Even countries where ex-post GDP growth surprised to the upside, forward-looking economic data have begun to falter. The US labor market softened, while China’s mild economic expansion was largely driven by stimulus support amid a wavering property sector. Overall, however, economic data continued to support a soft landing—a scenario that was priced-in by most risk assets.
Equities
US equities outperformed DM ex US peers in Q4, bringing total outperformance for 2023 to nearly 11%. Q4 US stock outperformance was boosted by expectations that the Fed will cut rates sooner than prior estimates. This view supported increased risk appetite and outperformance in the real estate, information technology, and financials sectors, while defensive sectors such as consumer staples, healthcare, and utilities lagged. Energy was the only sector to decline, weighed down by falling oil prices. The “Magnificent Seven” stocks contributed roughly one-third of the total returns in Q4, driving growth stocks to outgain their value peers. Of note, these seven firms contributed 60% of broad US index’s gains in 2023. US equities also outperformed due to a weakened US dollar as the interest-rate differential is expected to narrow against other economies.
Economic data released in Q4 painted the picture of a slowing but resilient economy. US GDP grew well above expectations in Q3 at 4.9% quarter-over-quarter (QOQ) annualized. Consumer spending contributed nearly half of the economic expansion, evenly balanced between goods and services. Composite PMI data indicated economic activity continued to expand slightly, retail sales topped expectations, and consumer confidence spiked. However, the strong labor market began to cool—highlighted by job openings falling to their lowest level since early 2021—and continuing jobless claims rising to their highest level in more than two years. Inflation continued to cool, and the Fed’s decision to keep benchmark policy rates steady led markets to price in a 100% probability that it will ease monetary policy in the first half of 2024.
European equities trailed broader DM equities in Q4 in local currency terms but performed on par in common currencies due to US dollar weakness. Europe ex UK equities topped UK peers.
The ECB held its benchmark deposit rate steady at 4.00% for a second consecutive meeting as Eurozone inflation fell more than expected to 2.4% in November. Investors ramped up expectations for the ECB to cut rates as early as March 2024, as inflation is now approaching its 2% target. However, policymakers emphasized their commitment to controlling inflation, noting they would keep policy benchmarks at “sufficiently restrictive levels for as long as necessary.” GDP unexpectedly contracted in the Eurozone, and the European Commission cut its growth forecasts for 2024 on struggling business activity. Germany’s budget crisis further complicated matters for the bloc, potentially limiting the availability of funds to support its ailing economy.
The BOE maintained its benchmark policy rate at 5.25% and warned it was too early to determine whether the current monetary policy was sufficiently restrictive to sustainably lower inflation. Shortly thereafter, data showed that CPI had fallen by more than expected to 3.9% year-over-year (YOY). This led investors to reinforce bets that the BOE would cut rates in early 2024. Q3 GDP contracted slightly, further supporting the view that the BOE may cut sooner; however, the flash composite PMI for December indicated economic activity unexpectedly accelerated.
Japanese equities lagged broader DM in Q4. However, stocks underperformed by less in common currencies as the yen strengthened on expectations of a narrower interest-rate differential against the United States. The Bank of Japan (BOJ) softened its stance on the yield curve control policy, effectively allowing interest rates to rise slightly. However, headwinds from weaker-than-expected GDP (-2.9% annualized), yen strength, and the increasing odds that the Fed will cut US rates in early 2024 led the BOJ to maintain its negative benchmark policy rate. BOJ Governor Kazuo Ueda reiterated that the central bank was in no rush to exit its ultra-loose monetary policy and would remain datacentric. Inflation continued to moderate, highlighted by core inflation falling more than expected to 2.5% YOY, close to the BOJ’s target.
Pacific ex Japan equities lagged the broader DM index in local currency terms, but advanced on par in common currencies. Australia and New Zealand outperformed, while Hong Kong and Singapore trailed. The Reserve Bank of Australia increased its benchmark cash rate by 25 bps to 4.35% in November in response to stubborn inflation. But the central bank held its benchmark rate steady at its following meeting in December, explaining time was needed to assess the impact on the economy from recent hikes. In New Zealand, GDP unexpectedly shrank, retail sales were flat, and employment declined. However, forward-looking indicators, such as business activity outlook and confidence, jumped. The Reserve Bank of New Zealand held its benchmark official cash rate steady at 5.50% but noted further tightening may be needed if price pressures do not relent.
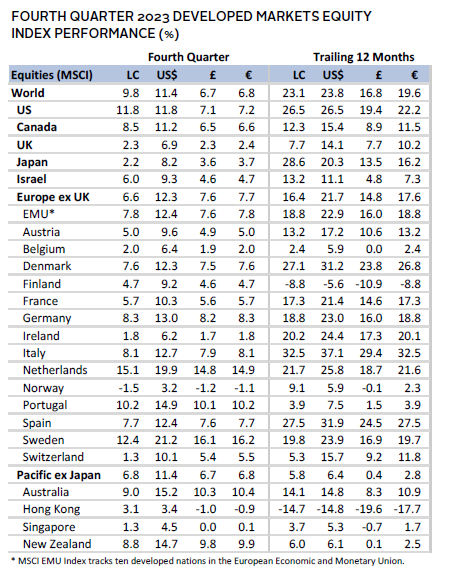
Sources: MSCI Inc. and Thomson Reuters Datastream. MSCI data provided “as is” without any express or implied warranties.
Emerging markets equities trailed DM peers in Q4 for the tenth time in the last 12 quarters. Over that time, EM equities underperformed by nearly 36 ppts, and lagged by 13 ppts in 2023. Among regions in Q4, Latin America and Europe, the Middle East & Africa outperformed, while Asia lagged. India, Taiwan, Korea, and Brazil were the largest contributors to the index’s return. In contrast, China’s ongoing economic woes led the country to be one of the few to decline in Q4—and the only significant detractor to the MSCI EM Index.
Economic and geopolitical headwinds continue to loom over the Chinese government’s efforts to reignite its economy, especially its beleaguered property sector. The central government implemented a plethora of support measures, including providing financial aid to 50 builders, loosening down payment obligations, and encouraging banks to lend to the sector. The initial boost to stocks from this news was not sustained, as markets turned their focus to PMI data that showed contraction in both manufacturing and services. China also slipped into deflation as October and November data reported a YOY decline in price levels. Furthermore, consensus estimates point to another month of deflation in December.
Turkey, which declined the most among EM countries, is facing an ongoing inflationary crisis. The Central Bank of the Republic of Türkiye raised interest rates for a seventh consecutive month in December. The official benchmark rate increased by 250 bps to 42.5% to help counter its YOY inflation rate of more than 60%. The rise in benchmark interest rates is the latest evidence that Turkey has pivoted away from its prior controversial policy of cutting interest rates in the face of rising inflation.
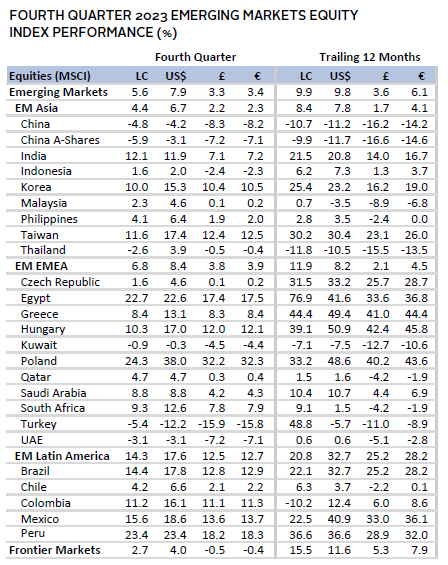
Sources: MSCI Inc. and Thomson Reuters Datastream. MSCI data provided “as is” without any express or implied warranties.
Fixed Income
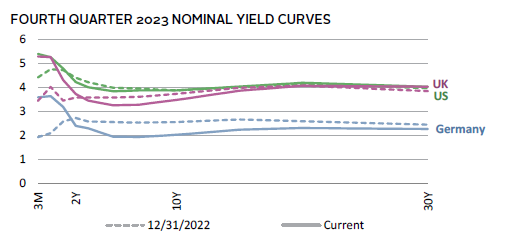
US fixed income assets soared in Q4 to their largest return since the 1980s. Yields steeply declined as investors were increasingly convinced that the Fed would cut its policy rate sooner than previously anticipated. The central bank updated its economic projections in December, highlighted by a forecast of 75 bps of rate cuts in 2024, putting further pressure on the ten-year Treasury yield. Overall, the yield declined back to where it began this year, 3.88% (down 71 bps in Q4). This unexpected dovish signal boosted investor buying of longer-dated fixed income securities to lock in current rates before the expected decline next year. This compressed both nominal and real yields, as the ten-year US TIPS yield retreated 52 bps to 1.72%. Cash rates were steadier; the three-month yield fell just 15 bps to 5.40%, as investors continued to park cash in money market funds, which experienced record inflows over the full calendar year.
UK gilts advanced the most among major government bonds in Q4. Ten-year gilt yields fell 91 bps to 3.48%, marking their steepest decline in more than a decade. Inflation-linked gilts returned double digits, bringing their trailing 12-month return into positive territory, while UK investment-grade corporates outgained their domestic high-yield equivalents. European government bonds also advanced, besting corporate peers. German ten-year yields fell 81 bps to 2.03%, briefly sitting below 2% for the first time since 2022.
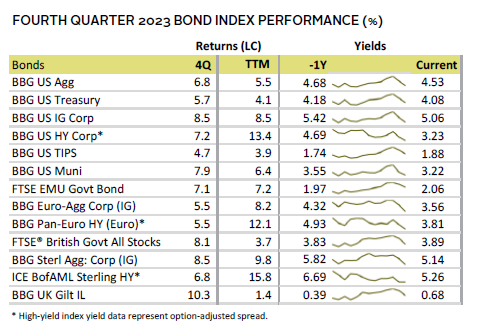
Sources: Bank of England, Bloomberg Index Services Limited, Federal Reserve, FTSE Fixed Income LLC, FTSE International Limited, Intercontinental Exchange, Inc., and Thomson Reuters Datastream.
Real Assets
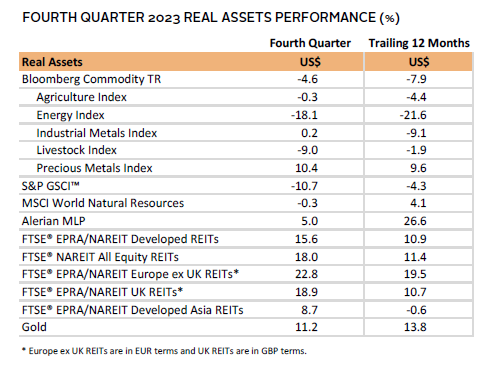
Real assets mostly advanced in Q4. Interest rate–sensitive asset classes benefited from steeply lower rates, while slowing economic activity weighed on other segments. Commodity futures declined on weaker energy prices, despite a double-digit gain for precious metals.
Oil prices ($77.04 for Brent and $71.65 for WTI) declined about 20% in Q4. Softening demand and an International Energy Agency estimate for oil markets to flip to a surplus at the beginning of 2024 weighed on sentiment. OPEC+ attempted to shore up the market by extending production cuts, which ultimately led to Angola—Africa’s second largest oil producer—exiting the cartel due to disagreements over its production target. The move brought OPEC+ to its lowest proportion of global production in years. Finally, the COP28 conference concluded with an agreement for transitioning away from fossil fuels and tripling renewable energy capacity.
Global natural resources equities slightly declined on the weaker energy prices and softening economic outlook.
REITs advanced by the most since 2010 on steeply lower interest rates. All segments within real estate posted positive returns, including the beleaguered office sector. All major regions returned double digits except for developed Asia, which was dragged down by a decline in Hong Kong due to ongoing weak sentiment on mainland China’s real estate.
Gold prices advanced to a $2,065.45, reaching a new all-time high. The yellow metal was boosted by a weaker US dollar, lower real yields, and heightened geopolitical risk.
Sources: Alerian, Bloomberg L.P., EPRA, FTSE International Limited, Intercontinental Exchange, Inc., MSCI Inc., National Association of Real Estate Investment Trusts, Standard & Poor’s, and Thomson Reuters Datastream. MSCI data provided “as is” without any express or implied warranties.
Note: Gold performance based on spot price return.
USD-Based Investors
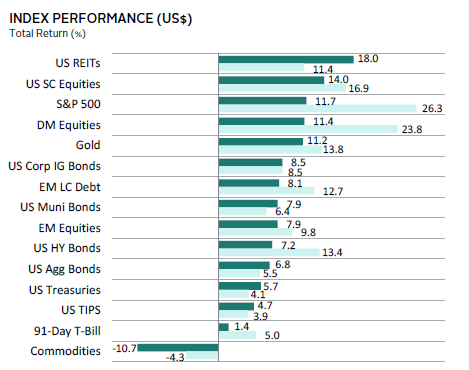
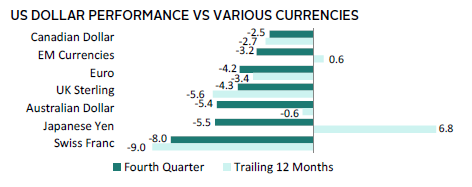
Risk assets soared in fourth quarter. Equities outperformed, led by US stocks, which were boosted by expectations that the Fed will cut rates sooner than prior estimates. US REITs topped all asset classes, bolstered by a significant decline in interest rates. US small caps topped domestic large-/mid-cap peers, while broad DM equities outgained EM equivalents, which were limited by China’s 4% decline. Lower yields also earned bonds one of their best quarterly returns on record, led by investment-grade corporates. Cash trailed as yields on shorter-dated securities did not fall as much as other maturities. Gold reached a new all-time high, supported by a weaker US dollar, lower real yields, and heightened geopolitical risk. However, broad commodities were the only major asset class to decline, weighed down by falling energy prices.
The US dollar broadly weakened on expectations for the interest-rate differential to narrow against other economies, declining the most versus the Swiss franc, Japanese yen, and Australian dollar among major global currencies we track. Over the last 12 months, the US dollar gained vis-à-vis the Japanese yen and our equal-weighted basket of EM currencies.
US GDP grew well above expectations in Q3 at 4.9% QOQ annualized. Consumer spending contributed nearly half of the economic expansion, evenly balanced between goods and services. Composite PMI data indicated economic activity continued to expand slightly, retail sales topped expectations, and consumer confidence spiked. However, the strong labor market began to cool—highlighted by job openings falling to their lowest level since early 2021—and continuing jobless claims rising to their highest level in more than two years. Inflation continued to cool, and the Fed’s decision to keep benchmark policy rates steady led markets to price in a 100% probability that it will ease monetary policy in the first half of 2024.
Sources: Bloomberg Index Services Limited, FTSE International Limited, Frank Russell Company, Intercontinental Exchange, Inc., J.P. Morgan Securities, Inc., MSCI Inc., National Association of Real Estate Investment Trusts, Standard & Poor’s, and Thomson Reuters Datastream. MSCI data provided “as is” without any express or implied warranties.
EUR-Based Investors
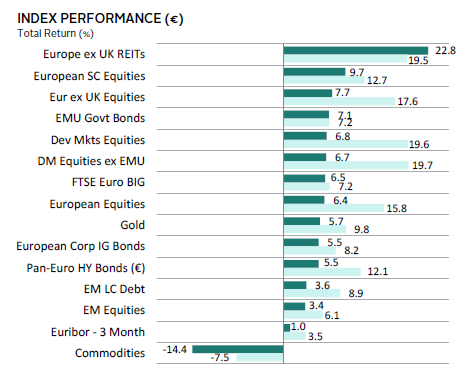
Risk assets soared in Q4. Equities outperformed, led by Europe ex UK stocks. Europe ex UK REITs topped all asset classes, bolstered by a significant decline in interest rates. European small caps topped Europe ex UK large-/mid-cap peers, while broad DM equities outgained EM equivalents, which were limited by China’s 8% decline. Lower yields also earned bonds one of their best quarterly returns on record, led by EMU government bonds. Cash trailed as yields on shorter-dated securities did not fall as much as other maturities. Gold reached a new all-time high, supported by a weaker US dollar, lower real yields, and heightened geopolitical risk. However, broad commodities were the only major asset class to decline, weighed down by falling energy prices.
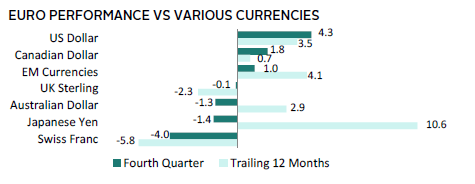
The euro was mixed, gaining versus the US dollar, Canadian dollar, and our basket of EM currencies, and declining vis-à-vis the Swiss franc, Japanese yen, and Australian dollar. Over the last 12 months, the euro was mostly stronger, declining relative to the Swiss franc and UK sterling.
The ECB held its benchmark deposit rate steady at 4.00% for a second consecutive meeting as Eurozone inflation fell more than expected to 2.4% in November. Investors ramped up expectations for the ECB to cut rates as early as March 2024 as inflation is now approaching its 2% target. However, policymakers emphasized their commitment to controlling inflation, noting they would keep policy benchmarks at “sufficiently restrictive levels for as long as necessary.” GDP unexpectedly contracted in the Eurozone, and the European Commission cut its growth forecasts for 2024 on struggling business activity. Germany’s budget crisis further complicated matters for the bloc, potentially limiting the availability of funds to support its ailing economy.
Sources: Bloomberg Index Services Limited, EPRA, European Banking Federation, FTSE Fixed Income LLC, FTSE International Limited, Intercontinental Exchange, Inc., J.P. Morgan Securities, Inc., MSCI Inc., National Association of Real Estate Investment Trusts, Standard & Poor’s, and Thomson Reuters Datastream. MSCI data provided “as is” without any express or implied warranties.
GBP-Based Investors
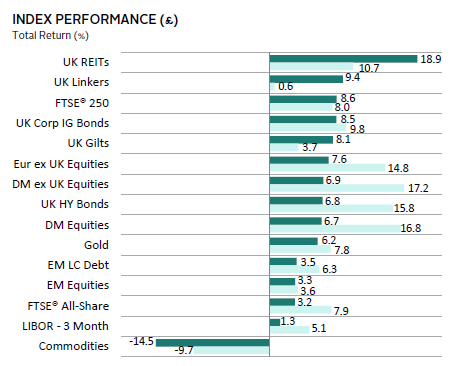
Risk assets soared in Q4. UK REITs topped all asset classes, bolstered by a significant decline in interest rates. UK mid caps topped the aggregate FTSE All-Share Index, while broad DM equities outgained EM equivalents, which were limited by China’s 8% decline. Lower yields also earned bonds one of their best quarterly returns on record, led by UK Linkers. Cash trailed as yields on shorter-dated securities did not fall as much as other maturities. Gold reached a new all-time high, supported by a weaker US dollar, lower real yields, and heightened geopolitical risk. However, broad commodities were the only major asset class to decline, weighed down by falling energy prices.
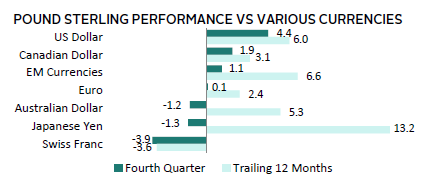
UK sterling was mixed, gaining versus the US dollar, Canadian dollar, and our basket of EM currencies, and declining vis-à-vis the Swiss franc, Japanese yen, and Australian dollar. Over the last 12 months, UK sterling was mostly stronger, declining relative to the Swiss franc.
The BOE maintained its benchmark policy rate at 5.25% and warned it was too early to determine whether the current monetary policy was sufficiently restrictive to sustainably lower inflation. Shortly thereafter, data showed that CPI had fallen by more than expected to 3.9% YOY. This led investors to reinforce bets that the BOE would cut rates in early 2024. Q3 GDP contracted slightly, further supporting the view that the BOE may cut sooner; however, the flash composite PMI for December indicated economic activity unexpectedly accelerated.
Sources: Bloomberg Index Services Limited, EPRA, FTSE International Limited, Intercontinental Exchange, Inc., J.P. Morgan Securities, Inc., MSCI Inc., National Association of Real Estate Investment Trusts, Standard & Poor’s, and Thomson Reuters Datastream. MSCI data provided “as is” without any express or implied warranties.
Performance Exhibits
All data are total returns unless otherwise noted. Total return data for all MSCI indexes are net of dividend taxes.
USD-Based Investors index performance chart includes performance for the Bloomberg US Aggregate Bond, Bloomberg US Corporate Investment Grade, Bloomberg US High Yield Bond, Bloomberg Municipal Bond, Bloomberg US TIPS, Bloomberg US Treasuries, ICE BofAML 91-Day Treasury Bills, FTSE® NAREIT All Equity REITs, J.P. Morgan GBI-EM Global Diversified, LBMA Gold Price, MSCI Emerging Markets, MSCI World, Russell 2000®, S&P 500, and S&P GSCI™ indexes.
EUR-Based Investors index performance chart includes performance for the Bloomberg Euro-Aggregate: Corporate, Bloomberg Pan-Euro High Yield (Euro), EURIBOR 3M, FTSE EMU Govt Bonds, FTSE Euro Broad Investment-Grade Bonds, FTSE® EPRA/NAREIT Europe ex UK RE, J.P. Morgan GBI-EM Global Diversified, LBMA Gold Price AM, MSCI Emerging Markets, MSCI Europe, MSCI Europe ex UK, MSCI Europe Small-Cap, MSCI World ex EMU, MSCI World, and S&P GSCI™ indexes.
GBP-Based Investors index performance chart includes performance for the Bloomberg Sterling Aggregate: Corporate Bond, Bloomberg Sterling Index-Linked Gilts, ICE BofAML Sterling High Yield, FTSE® 250, FTSE® All-Share, FTSE® British Government All Stocks, FTSE® EPRA/NAREIT UK RE, J.P. Morgan GBI-EM Global Diversified, LBMA Gold Price AM, LIBOR 3M GBP, MSCI Emerging Markets, MSCI Europe ex UK, MSCI World, MSCI World ex UK, and S&P GSCI™ indexes.
EM currencies is an equal-weighted basket of 20 emerging markets currencies.
Fixed Income Performance Table
Performance data for US TIPS reflect the Bloomberg US TIPS Index, with yields represented by the Bloomberg Global Inflation Linked Bond Index: US.