The risk rally continued in fourth quarter, bolstered by COVID-19 vaccine progress and multiple new stimulus measures. Global equities excelled; among regions, emerging markets shares outperformed developed counterparts and non-US developed markets outperformed US stocks in major currency terms. Other signs of equity performance rotation emerged as value bested growth and small caps topped large caps. High-yield bonds outperformed investment-grade corporate and sovereign counterparts, as corporate yields touched all-time lows. Most real assets categories advanced, underpinned by stronger commodity prices, while gold was flat. The US dollar weakened, falling to its lowest quarter-end level since 2014, whereas the euro was mixed and UK sterling generally advanced.
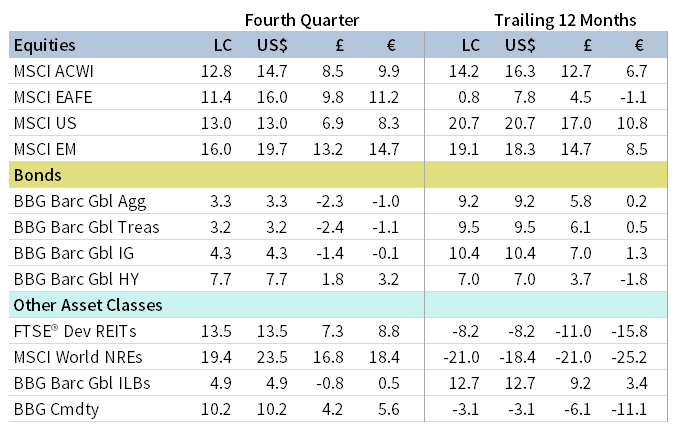
FOURTH QUARTER 2020 MAJOR ASSET CLASS PERFORMANCE (%)
Sources: Bloomberg Index Services Limited, Bloomberg L.P., FTSE International Limited, MSCI Inc., and Thomson Reuters Datastream. MSCI data provided “as is” without any express or implied warranties.
Note: Local currency returns for the Bloomberg Barclays indexes, the Bloomberg Commodity Index, and the FTSE® Developed REITs are in USD terms.
The Macro Picture
The strong fourth quarter capped off a year of resilient equity performance in the face of extraordinary economic challenges. Global equities have gained 63% from March lows, ending the year with double-digit gains and closing at a new all-time high. The uptick in fourth quarter momentum was driven in large part by major coronavirus vaccine breakthroughs, which helped boost investor confidence despite worsening case counts and new lockdown measures. By year end, several countries had commenced vaccination efforts, but the speed of distribution has faced recent challenges, and the timing and effectiveness of the rollouts remains unclear.
Global policy measures continued to provide a supportive backdrop for risk assets. In December, the US Congress passed a new $900 billion COVID-19 stimulus package after months of intense negotiations. EU governments found compromise on a budget and stimulus package, which included €750 billion in pandemic relief, ending months of deadlock. Central banks remained steadfast in their accommodative policy support, with the European Central Bank (ECB), the Bank of England (BOE), and the US Federal Reserve all expanding or extending asset purchase programs during the quarter.
Political developments featured prominently in fourth quarter. After the US presidential election, investors cheered the prospects of future gridlock under a split Congress. But the early January Georgia Senate runoff will determine the final composition of the Senate and holds important implications for future stimulus and legislative efforts. Elsewhere, the United Kingdom and EU agreed on a historic Brexit trade deal, four and a half years after Britain voted in the landmark referendum to leave the bloc. Negotiators ironed out final sticking points only days before the United Kingdom officially exited the EU single market.
Equities
US equities delivered double-digit returns in fourth quarter but trailed developed ex US counterparts in major currency terms. Despite the recent performance rotation, US stocks outperformed by nearly 20 percentage points (ppts) for the full year. All 11 S&P 500 Index sectors advanced, led by cyclical and value-oriented sectors such as energy and financials; more defensive sectors generally lagged as real estate, consumer staples, and utilities gained the least. Financials received a boost in December after the Fed announced it would allow banks to resume share buybacks. Value outperformed growth for just the third time in the past 16 quarters, while small caps—which posted their strongest quarterly return on record—trounced large caps but still lagged marginally for the full year. Forward 12-month earnings growth expectations have recovered to their highest levels since mid-2010, but strong performance pushed forward price-earnings ratios up to the 95th percentile of observations since the late 1980s.
Economic data released in fourth quarter were mixed and pointed to a slowing economic recovery. US third quarter GDP expanded at a record 33.4% annualized, but the economy contracted on a year-over-year basis and remains smaller than it was at the end of 2019. PMI indicators across manufacturing and services reached multi-year highs, showing healthy economic activity in fourth quarter. The job market recovery slowed, with net additions falling to pre-pandemic levels and initial unemployment claims hovering in a range above 700,000; however, the unemployment rate fell to 6.7%, a full 8 ppts below peak levels in April. Slowing job gains have been accompanied by weak consumer spending, which declined in November and remains below levels from last year.
European equities topped broader developed markets in major currency terms for just the fourth time in the past 13 quarters, but European shares lagged for the full year. In fourth quarter, UK stocks edged Europe ex UK counterparts, with wider outperformance in major currency terms as UK sterling strengthened. However, UK stocks are one of the few developed markets in the red for calendar year 2020, which has pushed relative valuations versus broader developed equities to the lowest level since data began in 1979 as Brexit uncertainty and the looming transition period expiration weighed on UK shares. Fears of a worst-case scenario were alleviated in late December when the United Kingdom and EU reached a last-minute trade pact to avoid a “no-deal” Brexit.
In November, the BOE increased the size of its bond buying stimulus program by a larger-than-expected £150 billion and kept policy rates steady. The ECB also increased the size of its bond buying program by €500 billion, extended the program’s expected time horizon by nine months, and unveiled new loans and easier terms in its bank lending program. On the fiscal side, the EU officially approved its €1.8 trillion budget and stimulus plan after certain member states lifted their initial veto to the package. While third quarter GDP growth in Europe and the United Kingdom reached a record pace, recently implemented virus containment measures have dented activity. Composite PMI indicators fell into contractionary territory, Eurozone CPI dropped into deflation, and UK GDP growth slowed in October.
Japanese equities outgained broader developed markets in fourth quarter but lagged for the full year. Japan launched its third round of fiscal stimulus to improve the economic recovery, bringing total stimulus this year to roughly 17% of GDP. The Bank of Japan (BOJ) made several policy adjustments during the quarter, including extending its pandemic loan program by six months and removing limits on its bank loan program aimed at supporting small and midsized businesses. The BOJ also announced the launch of a monetary policy review as Japanese CPI fell further into deflation in November. While calendar third quarter GDP expanded at the fastest clip in more than 50 years (22.9% annualized), other economic data were sluggish and PMI indicators remained in or near contractionary territory.
Emerging markets equities bested developed peers in fourth quarter and outperformed for the calendar year. Among emerging regions, Latin America and emerging Asia outperformed, while emerging Europe, the Middle East & Africa (EMEA) lagged despite posting a double-digit gain. Emerging Asia drove broader index gains for the year as the Latin America and EMEA regions were relatively flat. Most major emerging Asia countries were largely successful containing the initial COVID-19 wave, and earnings for emerging Asia companies have held up well relative to other markets, helping explain the strong outperformance in 2020. Korea, Brazil, India, and Taiwan gained the most among major emerging markets countries, whereas index heavyweight China and South Africa trailed. China, Taiwan, and Korea delivered strong gains for the year, advancing nearly 30% or more in local currency terms.
China’s recovery continued in fourth quarter, with economic data largely exceeding expectations and PMI activity indicators squarely in expansionary territory. Chinese equities have recently underperformed broader emerging markets, coinciding with several high-profile corporate defaults and heightened regulatory risk. Authorities have proposed new regulations to rein in uncompetitive practices of large technology companies, while also tightening regulations on the finance sector. In US-China relations, President Trump signed an executive order banning investment in Chinese companies affiliated with the military. In addition, US president-elect Joe Biden has indicated his administration will leave the Phase One trade deal in place for the immediate future, signaling some continuity with the outgoing administration’s stance toward China.

FOURTH QUARTER 2020 EQUITY INDEX PERFORMANCE (%)
Sources: MSCI Inc. and Thomson Reuters Datastream. MSCI data provided “as is” without any express or implied warranties.
Fixed Income
US high-yield and investment-grade corporate bonds outperformed Treasuries, sending corporate yields to all-time lows during the quarter and narrowing credit spreads. The US Treasury yield curve steepened, driven by rising yields on longer-dated maturities and anchored shorter-term yields; the ten-year/two-year yield spread widened 24 basis points (bps) and reached its widest level since late 2017. Five- and ten-year Treasury yields climbed 8 bps and 24 bps to 0.36% and 0.93%, respectively. Ten-year yields touched 0.98% during the quarter, their highest level since March. Tax-exempt municipal bonds and TIPS also outperformed Treasuries. Ten-year TIPS yields declined 12 bps during the quarter and breakeven inflation rates rose to 1.99%, their highest level in two years.
Relative performance among sterling- and euro-denominated fixed income categories mirrored that of their US counterparts, with corporate bonds outperforming sovereigns. Five- and ten-year Gilt yields declined 1 bp and 3 bps to -0.06% and 0.23%, respectively. UK linkers also bested nominal Gilts. Ten-year German bund yields declined 5 bps to -0.58%. The EU debuted its first-ever common-debt security in October, selling €17 billion worth of mutualized bonds to finance the COVID-19 relief effort. The sale was met with strong demand and priced at a yield of -0.26%, well above those on offer from benchmark German bunds.
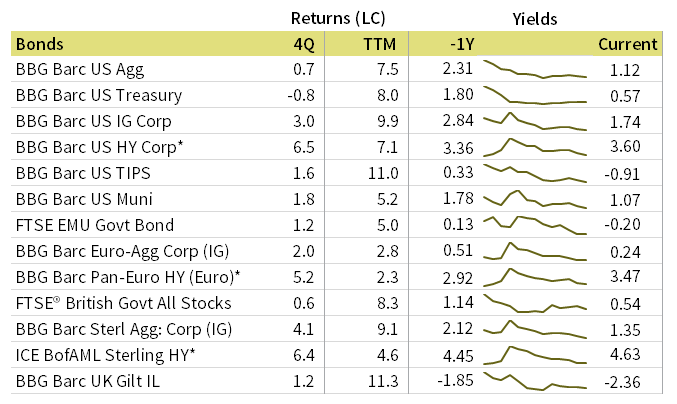
FOURTH QUARTER 2020 BOND INDEX PERFORMANCE (%)

FOURTH QUARTER 2020 NOMINAL YIELD CURVES

10Y/2Y YIELD CURVE SPLIT
* High-yield index yield data represent option-adjusted spread.
Sources: Bank of England, Bloomberg Index Services Limited, BofA Merrill Lynch, Federal Reserve, FTSE Fixed Income LLC, FTSE International Limited, Intercontinental Exchange, Inc., and Thomson Reuters Datastream.
Real Assets
Commodity futures posted double-digit gains in fourth quarter but remained in the red for the full year. All sectors gained for the quarter as accelerated vaccine progress lifted the economic outlook, the US dollar weakened, and commodity demand from China continued its recovery. Copper prices, typically viewed as a barometer of economic health, rose to multi-year highs.
Oil prices ($51.80 for Brent and $48.52 for WTI) rose more than 20% and reached their highest levels since February as futures market positioning indicated tighter supply/demand conditions. In December, OPEC and its allies agreed to increase production by 0.5 million barrels per day (bpd) starting in January, 1.5 million bpd lower than the previously agreed upon production increase.
Global natural resources equities and MLPs delivered strong returns in fourth quarter but declined steeply for the full year. Recent oil market turmoil has led to record asset write-offs, highlighted by ExxonMobil’s fourth quarter announcement that it will cut planned capital expenditures and write off up to $20 billion in assets.
Global developed REITs gained roughly on par with broader equities, led by UK REITs. Still, as with most real assets categories, REITs declined on a full-year basis.
Gold prices ($1,897.77 per troy ounce) underperformed among major real assets categories but delivered top performance for the full year. Performance for the quarter was essentially flat due to a price rebound in December when the US dollar weakened and real yields fell.

FOURTH QUARTER 2020 REAL ASSETS PERFORMANCE (%)
* Europe ex UK REITs are in EUR terms and UK REITs in GBP terms.
Sources: Alerian, Bloomberg L.P., EPRA, FTSE International Limited, Intercontinental Exchange, Inc., MSCI Inc., National Association of Real Estate Investment Trusts, Standard & Poor’s, and Thomson Reuters Datastream. MSCI data provided “as is” without any express or implied warranties.
Notes: Total return data for all MSCI indexes are net of dividend taxes. Gold performance based on spot price return.
USD-Based Investors
Nearly all assets advanced in fourth quarter, reflecting a risk-on market environment driven by vaccine progress and supportive policy measures. US small caps topped all other equities and posted their strongest quarterly return on record. Developed equities benefitted from US dollar weakness and bested US equivalents, while emerging markets outgained developed counterparts.
Commodity futures bounced back, outperforming among real assets categories, while gold was flat. Still, commodities declined significantly for all of 2020, while gold delivered top performance for the year. US high-yield and investment-grade corporate bonds bested Treasuries, sending corporate yields to all-time lows and tightening credit spreads. Tax-exempt municipal bonds and TIPS also outperformed Treasuries.
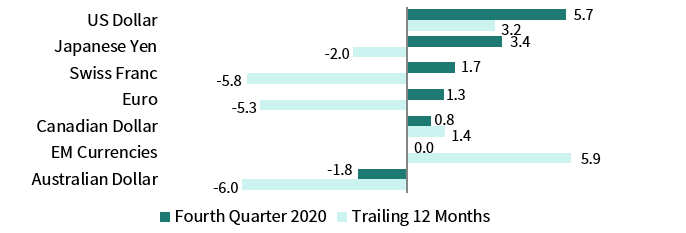
The US dollar broadly weakened, registering its largest quarterly depreciation since second quarter 2017 and falling to its lowest quarter-end level since 2014. The greenback fell the most versus the Australian dollar, UK sterling, and emerging markets currencies. The US dollar also declined over the past year, appreciating only versus emerging markets currencies.
US equities ended the year at all-time highs and, while forward 12-month earnings growth expectations have recovered to their highest levels since mid-2010, strong performance has pushed forward price-earnings ratios up to the 95th percentile of observations since the late 1980s. PMI indicators across manufacturing and services reached multi-year highs, but the job market recovery slowed, with net additions falling to pre-pandemic levels and the decline in initial unemployment claims stalling. Slowing job gains have been accompanied by weak consumer spending, which declined in November and remains below levels from last year.

INDEX PERFORMANCE (US$)

US DOLLAR PERFORMANCE VS VARIOUS CURRENCIES
Sources: Bloomberg Index Services Limited, FTSE International Limited, Frank Russell Company, Intercontinental Exchange, Inc., J.P. Morgan Securities, Inc., MSCI Inc., National Association of Real Estate Investment Trusts, Standard & Poor’s, and Thomson Reuters Datastream. MSCI data provided “as is” without any express or implied warranties.
EUR-Based Investors
Nearly all assets advanced in fourth quarter, reflecting a risk-on market environment driven by vaccine progress and supportive policy measures. European small caps topped all other equities, while European large- and mid-caps bested broader developed markets. Despite the strong fourth quarter performance, European equities declined for the full year. Emerging markets outperformed developed counterparts and posted top equity returns in 2020.
Europe ex UK REITs and commodity futures rebounded, but remained in the red for the year. Gold, which led all assets in 2020, declined the most in fourth quarter. Euro-denominated high-yield and investment-grade corporate bonds outperformed EMU government bonds, but trailed EMU sovereigns for the year.
The euro was mixed, appreciating vis-à-vis traditional havens such as the US dollar, Japanese yen, and Swiss franc, but depreciating against the Australian and Canadian dollars, UK sterling, and EM currencies. The common currency is generally stronger over the past year, declining against only the Australian dollar and Swiss franc.
The ECB increased the size of its bond buying program by €500 billion, extended the program’s expected time horizon by nine months, and unveiled new loans and easier terms in its bank lending program. On the fiscal side, the EU officially approved its €1.8 trillion budget and stimulus plan after certain member states lifted their initial veto to the package. While Eurozone third quarter GDP growth reached a record pace, recently implemented virus containment measures have dented activity as composite PMI indicators fell into contractionary territory and CPI dropped into deflation.

INDEX PERFORMANCE (€)

EURO PERFROMANCE VS VARIOUS CURRENCIES
Sources: Bloomberg Index Services Limited, EPRA, European Banking Federation, FTSE Fixed Income LLC, FTSE International Limited, ICE Benchmark Administration Ltd., J.P. Morgan Securities, Inc., MSCI Inc., National Association of Real Estate Investment Trusts, Standard & Poor’s, and Thomson Reuters Datastream.
GBP-Based Investors
Nearly all assets advanced in fourth quarter, reflecting a risk-on market environment driven by vaccine progress and supportive policy measures. UK equities were among the top performers, outperforming Europe ex UK counterparts and broader developed markets shares. Within the United Kingdom, mid-caps bested the broader market. Still, UK equities have lagged significantly over the past year, declining nearly 10% in 2020.
UK REITs and commodity futures delivered strong gains, but not enough to overcome deep losses for the year. Gold, on the other hand, posted the lone decline in fourth quarter but outperformed for the year. High-yield and investment-grade corporate bonds bested Gilts, while UK linkers also topped their nominal counterparts and posted top returns in 2020 among sterling-denominated fixed income categories.
UK sterling generally appreciated in fourth quarter, gaining the most against traditional safe havens such as the US dollar, Japanese yen, and Swiss franc; however, UK sterling declined versus the Australian dollar. UK sterling is more mixed over the past year as Brexit uncertainty dominated the market environment.
UK stocks in 2020 were one of the few developed markets in the red, which has pushed relative valuations versus broader developed equities to the lowest level since data began in 1979 as Brexit uncertainty and the looming transition period expiration weighed on UK shares. Fears of a worst-case scenario were alleviated when the United Kingdom and EU reached a last-minute trade pact to avoid a “no-deal” Brexit. In November, the BOE increased the size of its bond buying stimulus program by a larger-than-expected £150 billion and kept policy rates steady.

INDEX PERFORMANCE (£)
POUND STERLING PERFORMANCE VS VARIOUS CURRENCIES
Sources: Bloomberg Index Services Limited, EPRA, FTSE International Limited, Intercontinental Exchange, Inc., ICE Benchmark Administration Ltd., J.P. Morgan Securities, Inc., MSCI Inc., National Association of Real Estate Investment Trusts, Standard & Poor’s, and Thomson Reuters Datastream.
Performance Exhibits
All data are total returns unless otherwise noted. Total return data for all MSCI indexes are net of dividend taxes.
USD-Based Investors index performance chart includes performance for the Bloomberg Barclays US Aggregate Bond, Bloomberg Barclays US Corporate Investment Grade, Bloomberg Barclays US High Yield Bond, Bloomberg Barclays Municipal Bond, Bloomberg Barclays US TIPS, Bloomberg Barclays US Treasuries, ICE BofAML 91-Day Treasury Bills, FTSE® NAREIT All Equity REITs, J.P. Morgan GBI-EM Global Diversified, LBMA Gold Price, MSCI Emerging Markets, MSCI World, Russell 2000®, S&P 500, and S&P GSCI™ indexes.
EUR-Based Investors index performance chart includes performance for the Bloomberg Barclays Euro-Aggregate: Corporate, Bloomberg Barclays Pan-Euro High Yield (Euro), EURIBOR 3M, FTSE EMU Govt Bonds, FTSE Euro Broad Investment-Grade Bonds, FTSE® EPRA/NAREIT Europe ex UK RE, J.P. Morgan GBI-EM Global Diversified, LBMA Gold Price AM, MSCI Emerging Markets, MSCI Europe, MSCI Europe ex UK, MSCI Europe Small-Cap, MSCI World ex EMU, MSCI World, and S&P GSCI™ indexes.
GBP-Based Investors index performance chart includes performance for the Bloomberg Barclays Sterling Aggregate: Corporate Bond, Bloomberg Barclays Sterling Index-Linked Gilts, ICE BofAML Sterling High Yield, FTSE® 250, FTSE® All-Share, FTSE® British Government All Stocks, FTSE® EPRA/NAREIT UK RE, J.P. Morgan GBI-EM Global Diversified, LBMA Gold Price AM, LIBOR 3M GBP, MSCI Emerging Markets, MSCI Europe ex UK, MSCI World, MSCI World ex UK, and S&P GSCI™ indexes.
EM currencies is an equal-weighted basket of 20 emerging markets currencies.
Fixed Income Performance Table
Performance data for US TIPS reflect the Bloomberg Barclays US TIPS Index, with yields represented by the Bloomberg Barclays Global Inflation Linked Bond Index: US.