Global equities surged higher in fourth quarter, as multiple equity market regions reached new all-time highs. Emerging markets outperformed developed stocks after underperforming year-to-date through September. Growth equities bested value equivalents, while small caps topped large caps. Global fixed income performance was mixed, as high-yield and investment-grade corporate bonds gained as credit spreads narrowed, while sovereigns declined amid rising yields. Real assets generally advanced, spurred by stronger commodity prices, particularly crude oil, copper, and various agricultural goods. Among currencies, the US dollar generally weakened, the euro was mixed, and UK sterling broadly strengthened.
What a difference one year makes. The fourth quarter 2019 rally stood in stark contrast to the turmoil equity markets experienced in fourth quarter 2018. The most obvious difference has been the rapid reversal of the Federal Reserve’s interest rate policy, as the central bank cut the benchmark fed funds rate three times throughout 2019. Both the Fed and European Central Bank began increasing their balance sheets through asset purchases, and the People’s Bank of China also began loosening its monetary policy stance. The effects of this broad shift to accommodative central bank policy, coupled with an apparent US-China trade détente and more clarity on the future of the Brexit process, helped buoy investor sentiment and provided a tailwind to risk assets in fourth quarter. The United States and China made progress toward a “Phase One” trade deal made public in December; both sides announced modest trade concessions, including the cancellation of a planned US tariff imposition on a new list of Chinese goods and China’s commitment to increase purchases of US products—particularly in the agricultural sector. The widely watched Brexit process also saw significant developments, as the United Kingdom’s Conservative Party secured a large Parliamentary majority in December’s general election. The election result created a clearer path for a Brexit outcome, avoided the prospect for nationalization of several industries proposed by the Labour Party, and gave the new Conservative government the means to push through increased government spending. Despite the initial optimism, Prime Minister Boris Johnson introduced legislation aimed at preventing any extension to the Brexit transition period beyond 2020, raising fresh concerns of a possible no-deal, hard Brexit. More broadly, investors became increasingly optimistic regarding the economic outlook as manufacturing and services activity indicators (though still weak) appeared to signal a bottom in the recent slowdown; however, market vulnerabilities remain amid increasingly stretched valuations, weak earnings, and the fluid geopolitical environment.
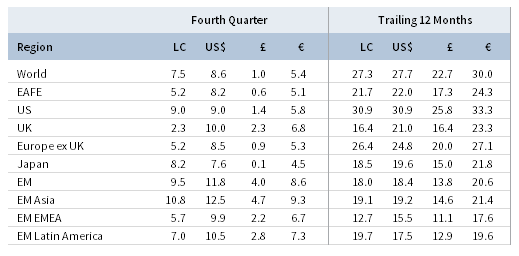
TOTAL RETURN FOR MSCI INDEXES (%)
US equities (9.1% for the S&P 500 Index) posted their second-highest quarterly gain since 2013 (surpassed only by first quarter 2019), climbing to new all-time highs. US stocks bested aggregate global ex US counterparts for the fourth consecutive quarter, outperforming broader developed markets but underperforming emerging markets shares. Ten of 11 S&P 500 sectors gained, led by information technology, healthcare, and financials—the latter boosted by higher bond yields and a steeper yield curve. The defensive and yield-sensitive real estate and utilities sectors underperformed the broader index by the largest margins. Growth stocks outperformed value equivalents for the 11th time in the last 12 quarters, while small caps outgained large caps, but have lagged over several multi-year trailing periods. The Fed held interest rates steady at its December meeting and signaled no policy rate changes in 2020. Rate cuts from earlier in 2019 helped spur momentum in the US housing market, as several indicators hit multi-year highs in fourth quarter. The US jobs market remained robust with the unemployment rate matching a 50-year low at 3.5% and payrolls and wages expanding at a healthy clip. In a positive development on the trade front, the US House of Representatives passed the new North American trade pact, dubbed the United States-Mexico-Canada Agreement.
European equities (8.8% in USD, 5.7% in EUR, 1.2% in GBP) advanced, but underperformed broader developed markets in fourth quarter. A surge in the value of UK sterling meant UK stocks outperformed Europe ex UK counterparts in major currency terms, but UK shares underperformed in local currency terms. Currency movements further impacted relative performance as European equities outperformed broader developed stocks in USD and euro terms. Several broad European equity indexes rose to new all-time highs during the quarter, including the MSCI Europe Index in local currency terms and the STOXX Europe 600 Index. While the UK avoided a technical recession in third quarter, the outlook remained gloomy as services, manufacturing, and construction activity indicators remained in contractionary territory, with manufacturing output contracting at the fastest pace since 2012. Consumer data were healthier; retail sales grew on a year-over-year basis, but underwhelmed expectations, employment rates reached a record high, and wage data indicated real year-over-year growth. Germany also avoided a technical recession, but hopes for a rapid recovery proved to be short-lived. Industrial output fell at the fastest rate since 2009, industrial orders contracted, and overall eurozone manufacturing activity indicators deteriorated.
Japanese equities (7.6% in USD, 4.5% in EUR, 0.1% in GBP) underperformed developed markets equivalents in major currency terms, but outperformed and gained the most since fourth quarter 2017 in local currency terms as the yen broadly depreciated. Prime Minister Shinzo Abe’s government passed a larger-than-expected fiscal stimulus package in the form of a 15-month budget aimed at upgrading infrastructure, increasing technology investment, and repairs from recent natural disasters. The Bank of Japan made no changes to monetary policy during the quarter, as Governor Kuroda noted that overseas risks, while still sizable, had improved. Japanese calendar third quarter economic growth was upwardly revised from a near-zero estimate earlier in the quarter to 1.8% annualized, driven by consumer spending and business investment. Still, Japan’s export heavy economy continues to suffer from the ongoing trade war as economic activity indicators remain weak.
Emerging markets equities (11.8% in USD, 8.6% in EUR, 4.0% in GBP) bested developed equivalents for the first time since fourth quarter 2018, but underperformed by nearly 10 percentage points for the year. All major emerging markets regions advanced in fourth quarter, led by heavily weighted emerging Asia; the Latin America and emerging Europe, the Middle East & Africa regions lagged the broader index. Among major emerging markets countries, China, Taiwan, Brazil, and Korea outperformed, while India and South Africa also gained, but trailed broader emerging stocks. China was boosted by progress toward a “Phase One” trade deal, nascent signs of economic stabilization that appeared in December (although data generally remain weak), and several monetary stimulus measures taken by the central bank, including liquidity injections, interest rate cuts, and decreases in bank reserve requirement ratios. Saudi Aramco, the state-controlled oil company, launched the largest initial public offering in history, surpassing a $2 trillion valuation shortly after listing. However, due to its low foreign investability factor, the company comprises less than 0.2% of the MSCI Emerging Markets Index, with Saudi Arabia’s weight relatively unchanged at 2.6%. Frontier markets equities (6.6% in USD, 3.6% in EUR, -0.8% in GBP) underperformed developed and emerging markets peers.
Real assets generally advanced during fourth quarter’s risk-on rally. Commodity futures (4.4% for the Bloomberg Commodity TR Index and 8.3% for the energy-heavy S&P GSCI™ Index) rose, led by energy, agriculture, and precious metals. Additionally, copper prices, widely viewed as a barometer of economic health, gained roughly 8%. Oil prices ($66.00 for Brent and $61.06 for WTI) climbed in fourth quarter as OPEC and allies agreed to further production cuts in a bid to support prices amid record US production. Global natural resources equities (6.6% for the MSCI World Natural Resources Index in USD terms) advanced with stronger underlying commodity prices; however, energy MLPs (-4.1%) declined and yields rose in November to their highest month-end levels since 2009, despite a healthier fundamental backdrop at the partnership level. Global developed REITs (2.0% in USD terms) climbed broadly, led by UK REITs (12.5%) and Europe ex UK REITs (6.0%), while returns for developed Asia REITs (2.0%) and US REITs (0.1%) were more muted. Gold prices (3.2%) advanced to $1,520.50 per troy ounce as the US dollar weakened, making calendar year 2019 performance the strongest since 2010.
Bond yields rose and weighed on sovereign fixed income performance amid fourth quarter’s risk-on environment, while high-yield corporate bonds generally outperformed. In the United States, high-yield (2.6%) and investment-grade (1.2%) corporate bonds outperformed Treasuries (-0.8%), tightening credit spreads to 2019 lows. Five- and ten-year Treasury yields increased 14 and 24 basis points (bps) to 1.69% and 1.92%, respectively. Shorter-term US Treasury yields declined, resulting in a steeper yield curve; the 10-year/3-month yield spread un-inverted during the quarter and closed at its widest quarter-end level since third quarter 2018. UK high yield (3.2%) outperformed UK investment-grade corporate bonds (-0.2%) and UK gilts (-3.9%). Five- and ten-year gilt yields increased 37 and 41 bps to 0.63% and 0.87%, respectively. Rising yields also weighed on EMU government bonds (-3.0%) as German ten-year bund yields rose 38 bps to -0.19%. US TIPS (0.8%) outperformed nominal Treasuries as inflation expectations rose during the quarter, while tax-exempt municipal bonds (0.7%) also outgained their taxable equivalents. UK linkers (-8.5%) delivered among the steepest declines as real yields rose and inflation fell to the lowest rate in three years.
Among major currencies, the US dollar mostly weakened, euro performance was mixed, and UK sterling surged on the Conservative Party’s resounding victory in December’s general election. The US dollar fell the most versus UK sterling, the Australian dollar, the Swiss franc, and the euro, but gained against the Japanese yen. The greenback mostly depreciated over the past year, but strengthened versus the euro and Australian dollar. The euro strengthened the most versus the Japanese yen, US dollar, and Canadian dollar, but weakened the most vis-à-vis UK sterling and the Australian dollar. The common currency is broadly weaker over the past year. UK sterling gained against the currencies we track and climbed nearly to a post-Brexit referendum high versus the euro. UK sterling was similarly stronger over the past year, declining in value against only the Canadian dollar.
Market Exhibits
Global manufacturing activity rebounded into expansionary territory in fourth quarter following six consecutive months of contraction. Central banks turned more accommodative in 2019, and the economic growth and inflation outlook improved, leading to an increase in longer-dated bond yields.
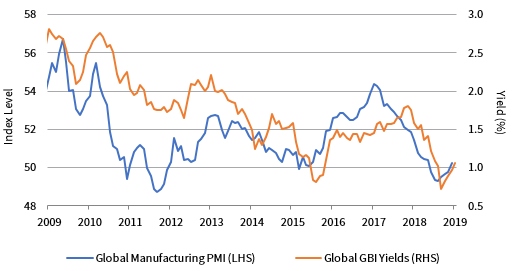
J.P. MORGAN GLOBAL MANUFACTURING PMI AND J.P. MORGAN GLOBAL GOVERNMENT BOND INDEX YIELDS
December 31, 2009 – December 31, 2019
Sources: FactSet Research Systems, J.P. Morgan Securities, Inc., and Markit Economics.
Notes: A PMI reading above (below) 50 indicates expanding (contracting) manufacturing activity. Global Manufacturing PMI data are as of
November 30, 2019.
Cyclical sectors generally outperformed defensives in 2019 amid signs of a potential bottoming in the recent economic slowdown. Trade-exposed information technology was the top-performing sector, accounting for one quarter of global stock performance, and likely boosted by the US-China “Phase One” trade announcement.
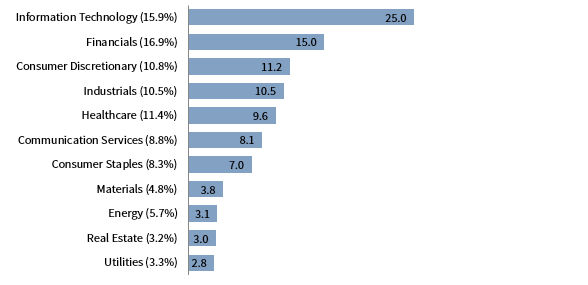
MSCI ACWI RETURN CONTRIBUTION BY SECTOR
December 31, 2018 – December 31, 2019 • Percent Contribution to Total Return (%)
Sources: FactSet Research Systems and MSCI Inc. MSCI data provided “as is” without any express or implied warranties.
Notes: Data are based on the MSCI All Country World Index. Average sector weights are shown in parenthesis. Total return data
are in USD terms. Total return data for all MSCI indexes are net of dividend taxes. Sector contributions may not add up to
100% due to rounding and 0.38% of constituents unassigned.
Valuation multiple expansion drove equity performance in 2019 as earnings growth stagnated and turned negative in some regions. Currently, analysts expect growth to accelerate in forward periods, which may leave markets vulnerable if expectations fail to materialize given equity markets’ strong run in 2019.
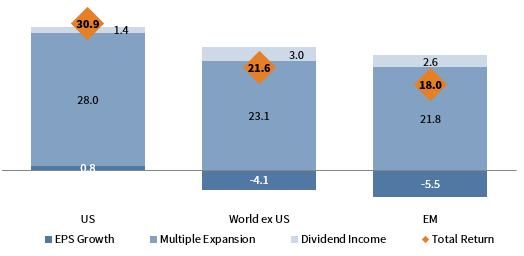
2019 EQUITY TOTAL RETURNS BY SOURCE
As of December 31, 2019 • Percent (%)
Sources: MSCI Inc. and Thomson Reuters Datastream. MSCI data provided “as is” without any express or implied warranties..
Notes: EPS growth is based on the percent change in aggregate 12-month forward earnings. Multiple expansion is based on the
percent change in 12-month forward price-earnings ratio. Dividend income is the compound difference between the 12-month
total return and the 12-month price return. All three components of return geometrically compound to total return. Total return
data for all MSCI indexes are net of dividend taxes and in local currency.
UK sterling surged after the Conservative Party won a Parliamentary majority in December’s general election, which avoided the Labour Party’s nationalization plans and cleared the way to “get Brexit done.” However, UK sterling pared some gains after passage of a law ensuring no extension of the transition period at 2020 end.
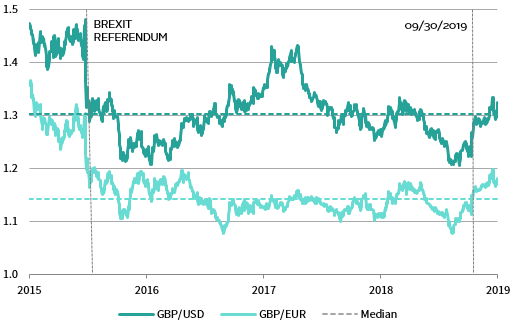
GBP/USD & GBP/EUR EXCHANGE RATES
December 31, 2015 – December 31, 2019
Sources: Refinitiv Benchmark Services Limited and Thomson Reuters Datastream.
Note: Data are daily.
Currency Performance as of December 31, 2019
The US dollar mostly depreciated in fourth quarter, but appreciated relative to the Japanese yen. The greenback declined the most vis-à-vis UK sterling, the Australian dollar, the Swiss franc, and the euro. The dollar generally lagged over the past year, but strengthened versus the euro and Australian dollar.
VERSUS THE US DOLLAR
Total Return (%)
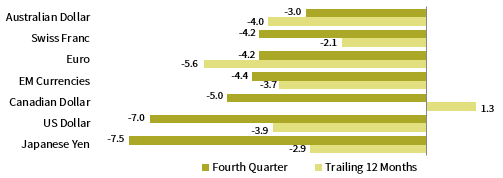
The euro was mixed, gaining the most versus the Japanese yen, US dollar, and Canadian dollar, but declining versus the UK sterling and Australian dollar. The common currency broadly depreciated over the past year, particularly versus the Canadian dollar and UK sterling.

VERSUS THE EURO
Total Return (%)
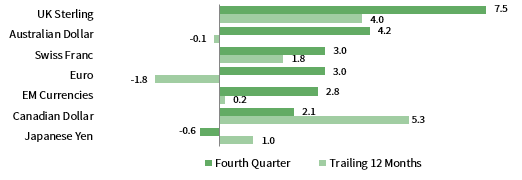
UK sterling appreciated broadly in fourth quarter as Brexit uncertainties eased, strengthening the most against the Japanese yen, US dollar, and Canadian dollar. Sterling generally appreciated over the past year as well, losing in value against only the Canadian dollar.
VERSUS THE POUND STERLING
Total Return (%)
Note: EM currencies is an equal-weighted basket of 20 currencies.
USD Market Performance as of December 31, 2019
Equities and commodities delivered top performance during fourth quarter’s risk-on environment. EM and US small caps outperformed their developed and US large cap counterparts, respectively. Rising yields weighed on US Treasuries and REITs; US high-yield and IG corporate bonds gained the most among fixed income assets.
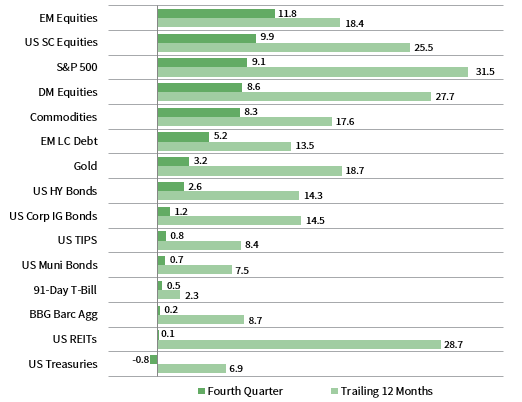
INDEX PERFORMANCE (US$)
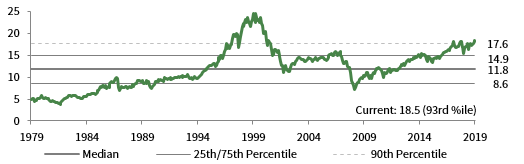
CYCLICALLY ADJUSTED PRICE-TO–CASH EARNINGS RATIO:: MSCI US
December 31, 1979 – December 31, 2019
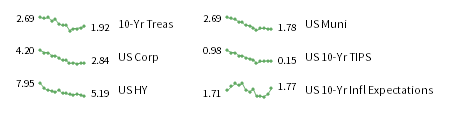
FIXED INCOME YIELDS
December 2018 – December 2019
Sources: Bloomberg Index Services Limited, Bloomberg L.P., FTSE International Limited, Frank Russell Company, Intercontinental Exchange, Inc., J.P. Morgan Securities, Inc., MSCI Inc., National Association of Real Estate Investment Trusts, Standard & Poor’s, and Thomson Reuters Datastream. MSCI data provided “as is” without any express or implied warranties.
Euro Market Performance as of December 31, 2019
Equities advanced, whereas IG bonds declined. Small caps gained the most, followed by EM stocks, while Europe ex UK underperformed among equities. Europe ex UK REITs and commodities also gained, but gold declined. European high-yield and EM LC bonds posted the only gains among fixed income categories.

INDEX PERFORMANCE (€)
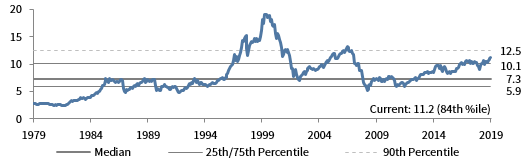
CYCLICALLY ADJUSTED PRICE-TO–CASH EARNINGS RATIO:: MSCI EUROPE EX UK
December 31, 1979 – December 31, 2019
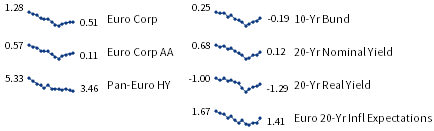
FIXED INCOME YIELDS
December 2018 – December 2019
Sources: Bloomberg Index Services Limited, Bloomberg L.P., EPRA, FTSE International Limited, J.P. Morgan Securities, Inc., MSCI Inc., National Association of Real Estate Investment Trusts, Standard & Poor’s, and Thomson Reuters Datastream. MSCI data provided “as is” without any express or implied warranties.
GBP Market Performance as of December 31, 2019
Domestically oriented UK mid caps outperformed among equities as a Conservative Party election victory removed prospects of nationalization, and UK REITs also surged. UK stocks outperformed developed counterparts, while EM bested DM. UK high-yield bonds outperformed IG counterparts, which declined.
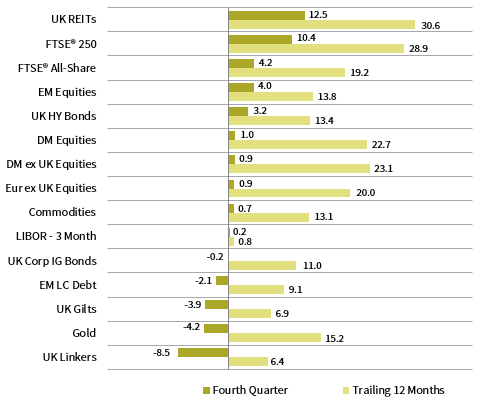
INDEX PERFORMANCE (₤)
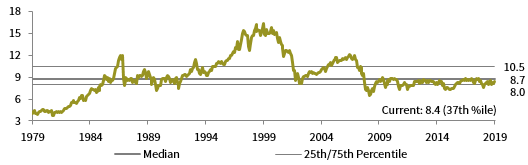
CYCLICALLY ADJUSTED PRICE-TO–CASH EARNINGS RATIO: MSCI UK
December 31, 1979 – December 31, 2019
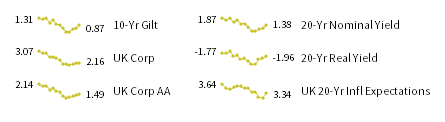
FIXED INCOME YIELDS
December 2018 – December 2019
Sources: Bloomberg Index Services Limited, Bloomberg L.P., EPRA, FTSE International Limited, Intercontinental Exchange, Inc., J.P. Morgan Securities, Inc., MSCI Inc., National Association of Real Estate Investment Trusts, Standard & Poor’s, and Thomson Reuters Datastream. MSCI data provided “as is” without any express or implied warranties.
Exhibit Notes
Performance Exhibits
Total return data for all MSCI indexes are net of dividend taxes.
US dollar index performance chart includes performance for the Bloomberg Barclays Aggregate Bond, Bloomberg Barclays Corporate Investment Grade, Bloomberg Barclays High-Yield Bond, Bloomberg Barclays Municipal Bond, Bloomberg Barclays US TIPS, Bloomberg Barclays US Treasuries, BofA Merrill Lynch 91-Day Treasury Bills, FTSE® NAREIT All Equity REITs, J.P. Morgan ELMI+, J.P. Morgan GBI-EM Global Diversified, MSCI Emerging Markets, MSCI World, Russell 2000®, S&P 500, and S&P GSCI™ indexes.
Euro index performance chart includes performance for the Bloomberg Barclays Euro-Aggregate: Corporate, Bloomberg Barclays Pan-Euro High Yield, Citigroup EMU Govt Bonds, Citigroup Euro Broad Investment-Grade Bonds, Euribor 3-month, FTSE® EPRA/NAREIT Europe ex UK, J.P. Morgan ELMI+, J.P. Morgan GBI-EM Global Diversified, MSCI Emerging Markets, MSCI Europe, MSCI Europe ex UK, MSCI Europe Small-Cap, MSCI World ex EMU, MSCI World, and S&P GSCI™ indexes.
UK sterling index performance chart includes performance for the Bloomberg Barclays Sterling Aggregate: Corporate Bond, BofA Merrill Lynch Sterling High Yield, FTSE® 250, FTSE® All-Share, FTSE® British Government All Stocks, FTSE® British Government Index-Linked All Stocks, FTSE® EPRA/NAREIT UK RE, J.P. Morgan ELMI+, J.P. Morgan GBI-EM Global Diversified, LIBOR 3M GBP, MSCI Emerging Markets, MSCI Europe ex UK, MSCI World, MSCI World ex UK, and S&P GSCI™ indexes.
Valuation Exhibits
The cyclically adjusted price-to–cash earnings ratio is calculated by dividing the inflation-adjusted index price by trailing ten-year average inflation–adjusted cash earnings. Cash earnings are defined as net income from continuing operations plus depreciation and amortization expense. MSCI does not publish cash earnings for banks and insurance companies and therefore excludes these two industry groups from index-level cash earnings.
Fixed Income Yields
US fixed income yields reflect Bloomberg Barclays Municipal Bond Index, Bloomberg Barclays US Corporate High Yield Bond Index, Bloomberg Barclays US Corporate Investment-Grade Bond Index, and the ten-year Treasury.
European fixed income yields reflect the BofA Merrill Lynch Euro Corporate AA Bond Index, BofA Merrill Lynch Euro Corporate Bond Index, Bloomberg Barclays Pan-European Aggregate High Yield Bond Index, Bloomberg Twenty-Year European Government Bond Index (nominal), ten-year German bund, 20-year European Inflation Swaps (inflation expectations), and the real yield calculated as the difference between the inflation expectation and nominal yield.
UK sterling fixed income yields reflect the Bank of England 20-year nominal yields, Bloomberg Generic UK 20-year inflation-linked (real) yields, ICE BofAML Sterling Corporate AA Bond Index, ICE BofAML Sterling Corporate Bond Index, and UK ten-year gilts.