Global equities tumbled in fourth quarter as the US stock market briefly touched bear market territory, and all major regions finished down in 2018. Emerging markets outperformed developed markets equivalents after underperforming year-to-date through September. Similarly, global value stocks outperformed growth counterparts, snapping a seven-quarter streak of value underperformance, and defensive sectors outpaced cyclicals in anticipation of slower global growth. Global fixed income returns were mixed, as developed markets sovereign bonds enjoyed gains due to safe-haven flows, while riskier credits, particularly high-yield corporate bonds, suffered losses amid spread widening. Natural resources equities and energy MLPs experienced a sharp sell-off caused by a plunge in crude oil prices. Developed markets REITs outperformed most risk asset categories, though regional performance varied considerably. Among major currencies, the Japanese yen and US dollar broadly appreciated as investors sought safety, the euro was mixed, and UK sterling depreciated against a majority of global currencies.
Volatility increased dramatically last quarter as tightening financial conditions, global growth concerns, and tempestuous political developments weighed on investor sentiment. Several major US and non-US equity indexes either approached or entered bear market territory amid the risk-off environment. Citing ongoing strength in the US economy, the US Federal Reserve hiked its benchmark policy rate in December (as expected), following which President Trump escalated his criticism of the Fed’s continued monetary tightening. While fundamentals remain healthy in the United States, slowing growth has become increasingly evident in the rest of the world. China’s economy has sputtered as the ongoing US/China trade war has taken a toll, and the two countries have until March 1 to come to an agreement, without which another US-imposed tariff is scheduled to take effect. In Europe, Germany posted disappointing economic results, driven not only by weakness in the auto industry due to new emissions standards but also by China’s ongoing slowdown. Meanwhile, Italy reached a deal with the European Commission (EC) to lower its deficit target for 2019, averting a potential crisis, but the economy continues to face stagnant growth. In the United Kingdom, Brexit uncertainties continue to weigh on near-term growth, as the Bank of England downgraded its GDP growth forecasts. Further reflecting global growth fears, oil prices plunged on worries of weakening global demand. A partial shutdown of the US government and anticipation of a divided Congress following the midterm election contributed to investor anxiety as the year came to a close.
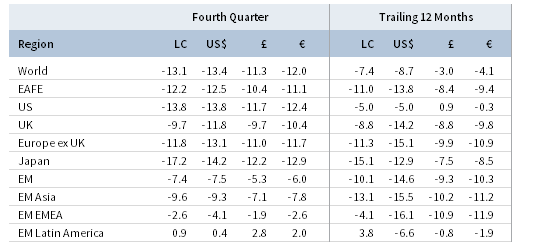
TOTAL RETURN FOR MSCI INDEXES (%)
US equities (-13.5% for the S&P 500 Index) sold off in fourth quarter, underperforming developed markets peers and testing a technical bear market before finishing the year down in total return terms for the first time since 2008. The sell-off was initially fueled by concerns that earnings and economic growth in the United States have peaked and was later exacerbated by the Fed’s signaling in December that it expects two additional rate hikes in 2019—a more hawkish stance than some market participants had anticipated. Value and large-cap stocks significantly outperformed growth and small-cap equivalents; notably, US small caps had their worst quarter since 2011. Among sectors, only utilities notched a gain; other defensive sectors—consumer staples and healthcare—declined but still outperformed. Energy stocks declined the most, following crude oil prices into a bear market, and the consumer discretionary, industrials, and information technology sectors also notably underperformed. The sell-off in equities contrasted with the positive fundamental backdrop as third quarter earnings grew an estimated 27% year-over-year, representing the strongest growth rate since 2010 and coming in significantly above consensus expectations. Additionally, third quarter GDP grew at a healthy 3.4% annualized rate, non-farm payrolls data surprised to the upside, and the ISM non-manufacturing purchasing managers’ index (PMI) hit a record high, indicating strength in the US services sector. Strong economic data prints in fourth quarter were instrumental in the Fed’s decision to raise rates another 25 basis points (bps) in December, despite fragile investor sentiment and equity market turbulence prior to the decision.
European equities (-12.7% in USD, -11.3% in EUR, -10.6% in GBP) weathered the late-December volatility relatively well and managed to outperform developed markets peers for the quarter. UK stocks notably outperformed in local currency terms despite a tense domestic political climate; however, broad sterling weakness amid heightened Brexit uncertainty weighed on returns in major currency terms. After months of Brexit negotiations, the United Kingdom and European Union came to terms in November on a draft text of the withdrawal agreement and political declaration on the future relationship, raising hopes for desperately needed clarity on the trade outlook. Yet, Prime Minister Theresa May called off a mid-December vote in the British Parliament that was expected to reject the agreement by a wide margin, leaving the deal in limbo and further heightening uncertainty as to the ultimate outcome. In contrast to mixed Brexit developments, the stand-off between Italy and the EC over the former’s expected budget deficit in the coming years was largely resolved in December after the Italian government agreed to lower its estimated deficit in 2019 from 2.4% to just above 2.0% of GDP, avoiding any punitive measures by the European authorities. European earnings overall grew 10% year-over-year in third quarter but only 5% excluding the energy sector, and economic data largely disappointed. The Eurozone’s third quarter GDP registered just a 0.2% quarter-over-quarter gain, its weakest reading in four years, and the bellwether German economy shrank 0.2% in third quarter, its first drop since 2015. Meanwhile, widespread “yellow vest” protests across France were a drag on economic activity and forced the Macron administration to reverse itself on recently enacted fiscal tightening. Despite recent economic weakness, European Central Bank (ECB) President Mario Draghi ended the bank’s asset purchase plan in December as planned, although it appears increasingly unlikely that the ECB will begin shrinking its balance sheet or raising the policy rate in 2019.
Japanese equities (-14.2% in USD, -12.9% in EUR, -12.2% in GBP) experienced their worst quarterly return since the global financial crisis, plunging into bear market territory in local currency terms, although broad yen strength boosted returns in major foreign currency terms. Third quarter GDP growth was revised downward to a 2.5% annualized contraction; the weakness was due, in part, to multiple natural disasters suffered during the quarter. A robust 2.9% monthly increase in factory output in October was partially offset by a subsequent 1.1% decline in November; similarly, strong October retail sales data were tempered by November results that came in below expectations. In December, the Japanese government further fueled negative sentiment when it cut its GDP growth estimate for fiscal 2018 (12 months ending March 2019) from 1.5% to 0.9% and its fiscal 2019 estimate from 1.5% to 1.3%. In December, the Bank of Japan (BOJ) warned that the recent fall in oil prices could further delay achieving its 2% inflation target and indicated that BOJ policymakers are concerned about potential negative effects on the economy stemming from global trade uncertainty.
Emerging markets equities (-7.5% in USD, -6.0% in EUR, -5.3% in GBP) declined for the quarter but significantly outperformed developed markets peers. After experiencing a sharp decline in October despite undemanding valuations, many investors appeared to go bargain hunting, as evidenced by meaningful estimated non-resident portfolio flows into emerging markets during November and wide outperformance relative to developed markets in December. Additionally, the precipitous drop in oil prices provided a boost to import-dependent countries such as India, South Africa, and Turkey. Among EM regions, Latin America stood out as the only region globally to record a positive return, while emerging Europe, the Middle East & Africa declined, but still outperformed the broader EM index. Heavily weighted emerging Asia underperformed. Latin America’s outperformance was driven by Brazil, where right-wing firebrand and seemingly pro-markets advocate Jair Bolsonaro won the October presidential election in a landslide. In contrast, index heavyweight China remained mired in a deep bear market as economic data disappointed amid a bitter trade dispute with the United States. In October, Chinese authorities announced new rounds of targeted monetary and fiscal stimulus to help stem the slowdown, but those measures didn’t prevent the country’s official manufacturing PMI from falling into contractionary territory in December for the first time since 2016. Frontier markets equities (-4.3% in USD, -2.8% in EUR, and -2.0% in GBP) outperformed emerging markets counterparts, as index heavyweights Argentina, Kuwait, and Nigeria held up quite well despite USD strength and plunging oil prices.
Real assets weren’t spared from the fourth quarter downturn in risk assets; commodities futures (-9.4% for the Bloomberg Commodity TR Index and -22.9% for the energy-heavy S&P GSCI™ Index) experienced a particularly sharp drawdown as crude oil prices ($53.80 for Brent and $45.41 for WTI) closed around 40% lower, compared to their early-October highs. Multiple factors—weakening global growth outlook, buoyant US inventory numbers, and the Trump administration’s granting of temporary waivers to eight major buyers of Iranian oil (despite the re-imposition of US economic sanctions against Iran)—rattled oil markets. Energy MLPs (-17.3%) and global natural resources equities (-19.7% for the MSCI World Natural Resources Index in USD terms) also faltered, driven lower by the rout in crude oil; industrial metals also fell sharply amid the global growth slowdown. US REITs (-6.1%) outperformed global equities, while Europe ex UK REITs (-8.1%) and UK REITs (-9.3%) lagged due to Brexit concerns.
Global fixed income returns were mixed: developed markets sovereign bonds gained, while riskier credits struggled as spreads meaningfully widened during fourth quarter. US Treasuries (2.6%) enjoyed their best quarter since early 2016 as the ten-year benchmark yield fell over 50 bps from an intra-quarter high north of 3.2%; five- and ten-year yields ended the quarter 43 bps and 36 bps lower, declining to 2.51% and 2.69%, respectively. UK gilts (1.9%) also rallied as heightened Brexit uncertainty led to a drop in yields as five- and ten-year yields fell 24 bps and 26 bps in the quarter, ending at 0.91% and 1.31%, respectively. EMU government bonds (1.5%) posted more modest gains, led higher by a 23 bp drop in ten-year German bund yields and a sharp December drop in Italian BTP yields following a budget agreement between Italy and the EC. US credit spreads widened as Treasuries outperformed both investment-grade (-0.2%) and high-yield (-4.5%) corporate bonds. Nominal Treasuries also outperformed US tax-exempt bonds (1.7%) and US TIPS (-0.4%). Outside the United States, UK linkers (1.9%) performed in-line with nominal gilts.
Among major currencies, the US dollar was mostly stronger, the euro was mixed, and the UK sterling was weaker on Brexit concerns. In addition to USD strength, the safe-haven Japanese yen broadly appreciated against a backdrop of heightened volatility in risk assets. The US dollar was stronger against all major currencies save for the yen. In contrast, the UK sterling was generally weaker, only appreciating against the commodity-driven Australian and Canadian dollars. The euro notched gains against the Canadian and Australian dollars as well as UK sterling, but depreciated vis-à-vis the yen, the US dollar, a basket of EM currencies, and the Swiss franc. Notably, the Australian and Canadian dollars depreciated due to the sharp declines in natural resources prices
Market Exhibits
The spread between ten-year and two-year US Treasury yields—widely considered a leading recession indicator, particularly once it turns negative—was one of the most closely watched metrics in fourth quarter, falling to an intra-quarter low just over 10 bps before recovering a bit higher.
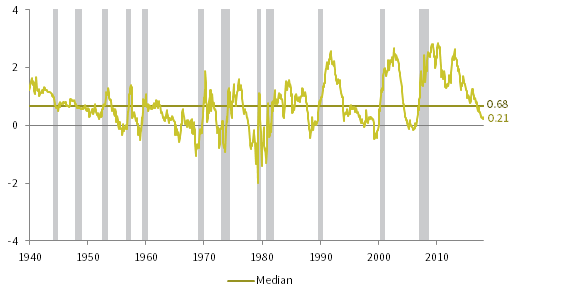
US TREASURY 10-YR/2-YR YIELD SPREAD AND RECESSIONS
1940–2018 • Percent (%)
Sources: Global Financial Data, Inc. and National Bureau of Economic Research (NBER).
Notes: Gray bars represent NBER-defined US recessions. Data are monthly.
ETFs and mutual funds tracking US high-yield bonds and leveraged loans saw record outflows late in fourth quarter, as investors soured on the riskiest credits. Concerns about elevated corporate debt loads coupled with weak covenants on speculative-grade bonds and loans led to a sharp price drop and wider spreads.
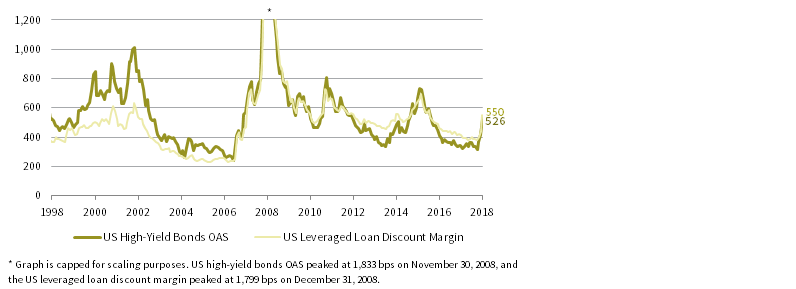
US HIGH-YIELD BOND OPTION-ADJUSTED SPREAD (OAS) VS US LEVERAGED LOAN DISCOUNT MARGIN
December 31, 1998 – December 31, 2018 • Basis Points (bps)
Sources: Bloomberg Index Services Limited, Credit Suisse, and Intercontinental Exchange, Inc.
Note: US high-yield bond data and US leveraged loan data are represented by the Bloomberg Barclays US Corporate High Yield Bond Index and Credit Suisse Leveraged Loan Index, respectively.
Through the first three quarters of 2018, EM equities significantly underperformed DM equivalents, wiping out all of its relative outperformance since the early February 2016 low. However, EM stocks strongly outperformed DM counterparts during the fourth quarter sell-off, as relative valuations appeared to come back into focus.
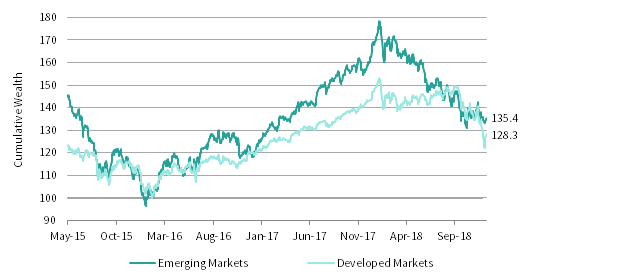
EMERGING VERSUS DEVELOPED MARKETS PERFORMANCE
May 21, 2015 – December 31, 2018 • February 11, 2016 = 100 • US Dollar
Sources: MSCI Inc. and Thomson Reuters Datastream. MSCI data provided “as is” without any express or implied warranties.
Notes: Data are based on daily price levels. The data are rebased to 100 on February 11, 2016, the recent trough for the MSCI ACWI Index in USD terms. The data begin on May 21, 2015, the prior peak for the MSCI ACWI Index in USD terms.
Crude oil prices experienced a nasty drawdown of roughly 40% in fourth quarter, dragging down energy stocks and MLPs in their wake. Factors contributing to the sell-off included the Trump administration granting waivers to major buyers of Iranian oil and downgraded global growth forecasts, which weighed on the oil demand outlook.
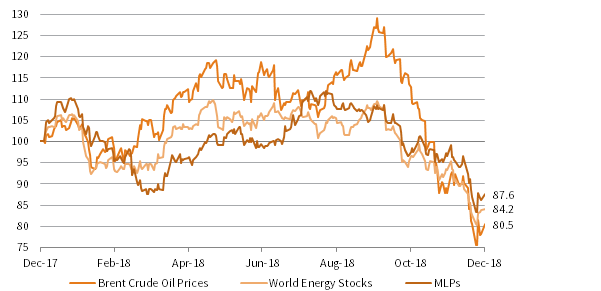
PERFORMANCE OF SELECT ENERGY ASSETS
December 31, 2017 – December 31, 2018 • US Dollar • December 31, 2017 = 100
Sources: Alerian, Bloomberg L.P., Intercontinental Exchange, MSCI Inc., and Thomson Reuters Datastream. MSCI data provided “as is” without any express or implied warranties.
Notes: MLPs, World Energy Stocks, and Brent Crude Oil Prices are represented by the Alerian MLP Total Return Index, MSCI World Energy Index, and the ICE Brent Crude Futures, respectively. Total return data for all MSCI indexes are net of dividend taxes. Data are daily.
Currency Performance as of December 31, 2018
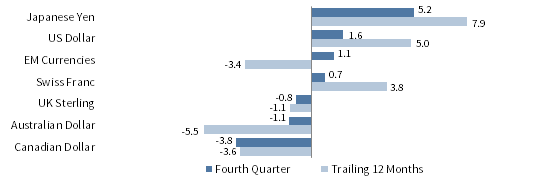
The US dollar was broadly stronger in fourth quarter, depreciating against only the safe-haven Japanese yen, while gaining the most versus the Australian and Canadian dollars. The greenback was broadly stronger over the trailing 12 months, weakening only relative to the Japanese yen.

VERSUS THE US DOLLAR
Total Return (%)
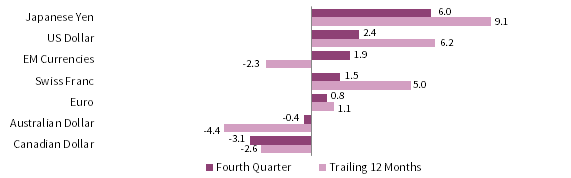
The euro was mixed last quarter, depreciating versus the Japanese yen, US dollar, a basket of EM currencies, and the Swiss franc but gaining relative to the Australian and Canadian dollars and UK sterling. The euro was also mixed for the year, weakening vis-à-vis the yen, USD, and Swiss franc but appreciating versus UK sterling.
VERSUS THE EURO
Total Return (%)
UK sterling was weaker against all currencies save for the Australian and Canadian dollars, which suffered due to a sharp decline in crude oil and industrial metals prices. Over the trailing 12 months, the pound was mostly weaker, with large losses versus the Japanese yen, US dollar, and Swiss franc.
VERSUS THE POUND STERLING
Total Return (%)
Note: EM currencies is an equal-weighted basket of 20 currencies.
USD Market Performance as of December 31, 2018
Commodities posted the worst fourth quarter performance, largely driven by a rout in crude oil prices, followed by US equities, among which small caps suffered a particularly sharp decline. US Treasuries were the best performers as yields plunged, significantly outperforming riskier investment-grade and high-yield corporate bonds.
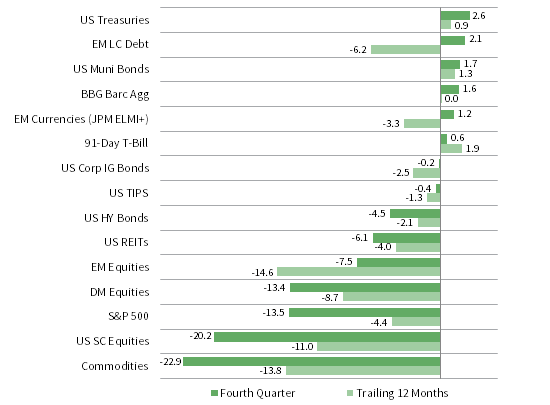
INDEX PERFORMANCE (US$)

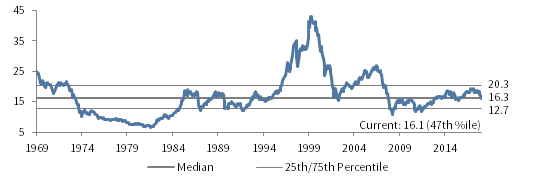
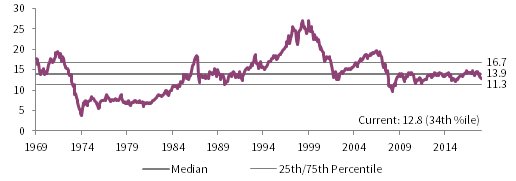
COMPOSITE NORMALIZED P/E: MSCI US
December 31, 1969 – December 31, 2018
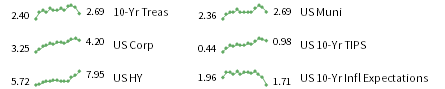
FIXED INCOME YIELDS
December 2017 – December 2018
Sources: Barclays, Bloomberg L.P., BofA Merill Lynch, FTSE International Limited, Frank Russell Company, J.P. Morgan Securities, Inc., MSCI Inc., National Association of Real Estate Investment Trusts, Standard & Poor’s, and Thomson Reuters Datastream. MSCI data provided “as is” without any express or implied warranties.
Euro Market Performance as of December 31, 2018
EM debt and currency assets posted the strongest gains in fourth quarter, while EMU sovereign bonds also rallied. Commodities and global equities performed the worst, although European stocks outperformed DM peers, despite elevated political risks on the Continent. Over the trailing 12 months, risk assets were broadly lower.

INDEX PERFORMANCE (€)
COMPOSITE NORMALIZED P/E: MSCI EUROPE EX UK
December 31, 1969 – December 31, 2018
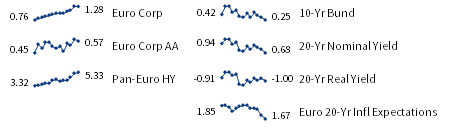
FIXED INCOME YIELDS
December 2017 – December 2018
Sources: Barclays, Bloomberg L.P., Citigroup Global Markets, EPRA, FTSE International Limited, J.P. Morgan Securities, Inc., MSCI Inc., National Association of Real Estate Investment Trusts, Standard & Poor’s, and Thomson Reuters Datastream. MSCI data provided “as is” without any express or implied warranties.
GBP Market Performance as of December 31, 2018
Commodities and global equities tumbled in fourth quarter. UK equities outperformed DM peers but underperformed EM stocks. EM debt and currency assets gained, in contrast; UK gilts and linkers also rallied as bond yields fell. UK REITs underperformed DM equivalents but slightly outperformed UK equities.
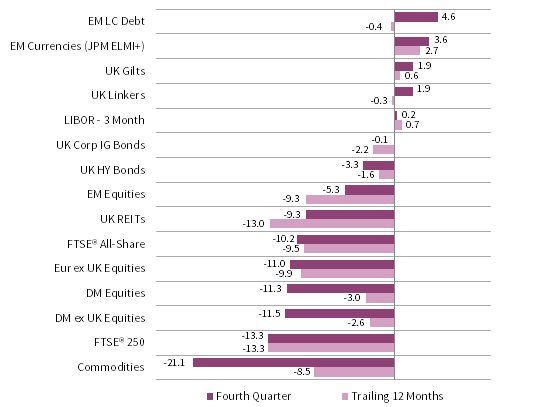
INDEX PERFORMANCE (₤)
COMPOSITE NORMALIZED P/E: MSCI UK
December 31, 1969 – December 31, 2018

FIXED INCOME YIELDS
December 2017 – December 2018
Sources: Barclays, Bloomberg L.P., BofA Merill Lynch, EPRA, FTSE International Limited, J.P. Morgan Securities, Inc., MSCI Inc., National Association of Real Estate Investment Trusts, Standard & Poor’s, and Thomson Reuters Datastream. MSCI data provided “as is” without any express or implied warranties.
Exhibit Notes
Performance Exhibits
Total return data for all MSCI indexes are net of dividend taxes.
US dollar index performance chart includes performance for the Bloomberg Barclays Aggregate Bond, Bloomberg Barclays Corporate Investment Grade, Bloomberg Barclays High-Yield Bond, Bloomberg Barclays Municipal Bond, Bloomberg Barclays US TIPS, Bloomberg Barclays US Treasuries, BofA Merrill Lynch 91-Day Treasury Bills, FTSE® NAREIT All Equity REITs, J.P. Morgan ELMI+, J.P. Morgan GBI-EM Global Diversified, MSCI Emerging Markets, MSCI World, Russell 2000®, S&P 500, and S&P GSCI™ indexes.
Euro index performance chart includes performance for the Bloomberg Barclays Euro-Aggregate: Corporate, Bloomberg Barclays Pan-Euro High Yield, Citigroup EMU Govt Bonds, Citigroup Euro Broad Investment-Grade Bonds, Euribor 3-month, FTSE® EPRA/NAREIT Europe ex UK, J.P. Morgan ELMI+, J.P. Morgan GBI-EM Global Diversified, MSCI Emerging Markets, MSCI Europe, MSCI Europe ex UK, MSCI Europe Small-Cap, MSCI World ex EMU, MSCI World, and S&P GSCI™ indexes.
UK sterling index performance chart includes performance for the Bloomberg Barclays Sterling Aggregate: Corporate Bond, BofA Merrill Lynch Sterling High Yield, FTSE® 250, FTSE® All-Share, FTSE® British Government All Stocks, FTSE® British Government Index-Linked All Stocks, FTSE® EPRA/NAREIT UK RE, J.P. Morgan ELMI+, J.P. Morgan GBI-EM Global Diversified, LIBOR 3M GBP, MSCI Emerging Markets, MSCI Europe ex UK, MSCI World, MSCI World ex UK, and S&P GSCI™ indexes.
Valuation Exhibits
The composite normalized P/E ratio is calculated by dividing the inflation-adjusted index price by the simple average of three normalized earnings metrics: ten-year average real earnings (i.e., Shiller earnings), trend-line earnings, and return on equity–adjusted earnings. We have removed the bubble years 1998–2000 from our mean and standard deviation calculations. All data are monthly.
Fixed Income Yields
US fixed income yields reflect Bloomberg Barclays Municipal Bond Index, Bloomberg Barclays US Corporate High Yield Bond Index, Bloomberg Barclays US Corporate Investment-Grade Bond Index, and the ten-year Treasury.
European fixed income yields reflect the BofA Merrill Lynch Euro Corporate AA Bond Index, BofA Merrill Lynch Euro Corporate Bond Index, Bloomberg Barclays Pan-European Aggregate High Yield Bond Index, Bloomberg Twenty-Year European Government Bond Index (nominal), ten-year German bund, 20-year European Inflation Swaps (inflation expectations), and the real yield calculated as the difference between the inflation expectation and nominal yield.
UK sterling fixed income yields reflect the Bank of England 20-year nominal yields, Bloomberg Generic UK 20-year inflation-linked (real) yields, ICE BofAML Sterling Corporate AA Bond Index, ICE BofAML Sterling Corporate Bond Index, and UK ten-year gilts.