Capital markets performance was mostly positive in fourth quarter, bolstered by strong economic data, solid earnings growth, and market-friendly political and policy developments. Global equities continued their multi-year advance. Emerging markets outperformed developed markets, and growth stocks outgained value stocks in all major currencies for the fourth consecutive quarter. Global government bonds underperformed global equities as yield curves flattened across major economies. Real assets performance was generally positive as commodities, global natural resources equities, and global REITs advanced; only energy MLPs declined. Among currencies, the euro and UK sterling strengthened, while USD performance was mixed.
For capital markets, 2017 ended the way it began, with fourth quarter marked by historically low volatility and the strong performance of risk assets as the synchronized global economic expansion maintained its momentum, yet there were conflicting signals as to how much further the current cycle has to run. The ongoing flattening of the US Treasury yield curve at first blush suggests that the US economic cycle is closer to its end than its beginning. However, there are mitigating factors, such as a structurally low term premium due to central bank quantitative easing combined with rising short-term rate expectations as a result of improving economic data, which may diminish the relevance of the yield curve slope as a recession risk indicator. Also, while traditional risk assets such as emerging markets equities and high-yield corporate bonds outperformed, others such as small caps and value stocks did not, suggesting that investors remain somewhat cautious regarding the potential longevity of the current expansion. Finally, US stocks’ strong performance was driven in part by further rerating, however, the returns of other equity regions were primarily driven by upgraded earnings growth expectations. Irrespective of market cycle indicators, which remain largely benign heading into the new year, last year’s strong capital markets performance will be difficult to beat in 2018.
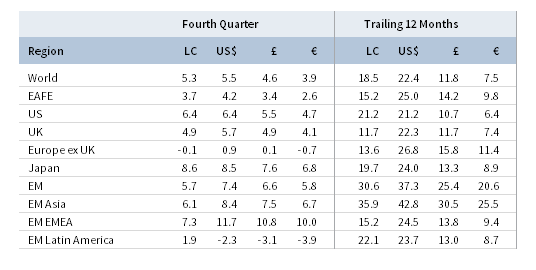
TOTAL RETURN FOR MSCI INDEXES (%)
US equities (6.6% for the S&P 500 Index) advanced for the ninth straight quarter, gaining 46.0% over that span. Positive returns were recorded in 19 of the past 20 quarters—the highest number of quarterly gains over a five-year stretch since data began in 1900. Market volatility continued to be exceptionally low, with the VIX measure of implied volatility reaching its lowest quarterly average level since data began in 1990 for the second consecutive quarter. All 11 sectors were in the black for the quarter; the consumer discretionary, information technology, and financials sectors outperformed the most, the former buoyed by the largest gain in holiday retail sales since 2011. US stock indexes again set new record highs as economic and earnings growth both exceeded expectations, the Federal Reserve raised interest rates as expected, and a major re-write of the US tax code was signed into law. Macro data continued to impress as consumer confidence reached a 17-year high in November, the unemployment rate reached its lowest level in 17 years, and GDP gained 3.2% in third quarter. Third quarter earnings per share grew an estimated 6% year-over-year according to FactSet, led by energy and information technology.
European equities (1.3%) gained but underperformed developed markets peers. UK stocks (4.9%) drove the gains as Europe ex UK (-0.1%) and EMU (-0.5%) equivalents declined in local currency terms. UK equities were buoyed by progress announced between UK and EU negotiators that could lower the risk of a disorderly Brexit, while ongoing euro strength was a headwind for EMU stock performance. Third quarter earnings per share for European stocks grew an estimated 9%; however, growth fell to 5% excluding the energy sector. The European Central Bank pulled off a “dovish taper” in October, announcing its plan to further taper its asset purchases, while emphasizing its policy will remain highly accommodative for the foreseeable future. Eurozone economic data remained strong as the unemployment rate reached its lowest level since January 2009, consumer confidence turned positive for the first time in almost 17 years, and the manufacturing PMI reached its highest reading since data began in 1997. Third quarter GDP growth in both the Eurozone and the United Kingdom were slightly above earlier estimates but reflected opposing trends; Eurozone growth continued to accelerate, while UK growth continued to slow. Eurozone political risks appeared to increase. Negotiations to form a coalition government in Germany fell apart in November. Spain’s central government disbanded the semi-autonomous Catalonia region’s local parliament following an independence referendum it deemed illegal, after which separatist parties still won a majority of local seats in a late December election. Italy’s prime minister dissolved parliament just before year-end, announcing national elections in March that will be hotly contested.
Japanese equities (8.6%) outperformed developed markets peers as the Japanese market reached its highest level since 1990. October’s snap election result and continued strong economic and earnings growth were boons for the market. Support for the incumbent Liberal Democratic Party-Komeito coalition exceeded expectations, maintaining its supermajority in Japan’s lower house and ensuring that Abenomics will continue. Third quarter GDP grew 2.5%, above earlier estimates; the seven consecutive quarters of economic growth is the longest streak since an eight-quarter run that ended in 2001. Japanese imports and exports surged 17% and 16%, respectively, in November, reflecting the synchronized global expansion. Despite positive economic data, the Bank of Japan kept monetary policy unchanged and maintained its massive stimulus program amid persistently low inflation. Earnings data also continued to impress; calendar third quarter earnings per share grew an estimated 16% year-over-year, boosted by strengthening domestic growth, robust global trade, and the weaker yen.
Emerging markets equities (7.4% in USD, 6.6% in GBP, and 5.8% in EUR) continued to outperform developed markets in fourth quarter. Relative to broader emerging markets, emerging Europe, the Middle East & Africa and heavily weighted emerging Asia outperformed; Latin America underperformed, declining due to sharp currency weakness in Mexico and Brazil, the only major emerging markets to suffer losses, in major currency terms. Among the major markets, India, Korea, and South Africa gained the most, the latter buoyed by the election of pro-business candidate Cyril Ramaphosa as leader of the ruling African National Congress party and likely the next president of the country. China, by far the largest country in the index at a nearly 30% weight, performed roughly in line with broader emerging markets in fourth quarter but was the top performer among major emerging markets for the calendar year.
Real assets performance was mostly positive. Commodity futures advanced (4.7% for the Bloomberg Commodity TR Index and 9.9% for the energy-heavy S&P GSCI™ Index), led by healthy gains in energy and industrial metals. Oil prices ($66.87 for Brent and $60.42 for WTI) increased, boosted by the late November announcement by OPEC and Russia to extend oil production cuts through the end of 2018 and by rising tensions in the Middle East. Global natural resources equities (7.9% for the MSCI World Natural Resources Index in USD terms) outgained global stocks, while energy MLPs (-0.9%) declined, although rebounded from earlier, deeper losses. Global REITs (3.8% in USD terms) underperformed equities but outperformed bonds; UK REITs (8.3%) and Europe ex UK REITs (5.5%) outperformed US REITs (2.5%). Gold (1.5%) advanced in USD terms to $1,303.46, finishing the year up 12.6%—its largest calendar year gain since 2010.
Global government bonds advanced but underperformed other asset classes. UK gilts (2.0%) outperformed EMU government bonds (0.6%) and US Treasuries (0.1%). The US Treasury yield curve continued to flatten, driven mostly by rising near-term rates as economic data exceeded expectations; the benchmark ten-year versus two-year yield spread finished the quarter at its lowest level since late 2007 as the Fed raised its benchmark interest rate 25 basis points (bps) in December. Yields for the five- and ten-year US Treasuries rose 28 bps and 7 bps to finish the quarter at 2.20% and 2.40%, respectively. Five- and ten-year UK gilt yields fell 3 bps and 14 bps despite the Bank of England raising interest rates—the first such hike in ten years—in November, finishing at 0.75% and 1.27%, respectively. US credit spreads tightened as US investment-grade corporate bonds (1.2%) and US high-yield bonds (0.5%) outperformed US Treasuries. US tax-exempt bonds (0.7%) also advanced but underperformed taxable investment-grade equivalents as uncertainty surrounding the final terms of the tax reform bill (private purpose bonds ultimately kept their tax-exempt status) drove a surge in municipal bond issuance into year-end. Among developed markets inflation-linked bonds, UK linkers (3.5%) and US TIPS (1.3%) outperformed nominal counterparts, reflecting higher inflation breakevens.
After strengthening early in fourth quarter, USD performance was mixed. The US dollar retreated against the euro, our equal-weighted basket of EM currencies, and UK sterling but gained against the Japanese yen, Canadian dollar, Australian dollar, and Swiss franc. Continuing recent trends, the Eurozone’s ongoing economic recovery helped the euro strengthen against all major currencies and our EM currency basket. UK sterling also strengthened against most major currencies as UK and EU negotiators announced progress on Brexit negotiations but weakened against the euro and our basket of EM currencies.
Market Exhibits
US equity implied volatility was exceptionally low for calendar year 2017. All four quarters were among the five lowest since data began in 1990, with average volatility in fourth quarter reaching its lowest level on record for the second consecutive quarter.

QUARTERLY S&P 500 IMPLIED VOLATILITY SORTED IN ASCENDING ORDER
First Quarter 1990 – Fourth Quarter 2017
Sources: Bloomberg L.P., Chicago Board Options Exchange, and Standard & Poor’s.
Notes: The Chicago Board Options Exchange Volatility Index (“VIX”) reflects a market estimate of future volatility, based on the weighted average of the implied volatilites for a wide range of strikes. Chart calculates average VIX observed for each quarter based on daily closes.
The benchmark ten-year versus two-year US Treasury yield spread finished at its lowest level since late 2007 as the Fed hiked 25 bps in December. Recent yield curve flattening has been driven by rising short-term rates as economic data have exceeded expectations, while long-term rates remained stable.
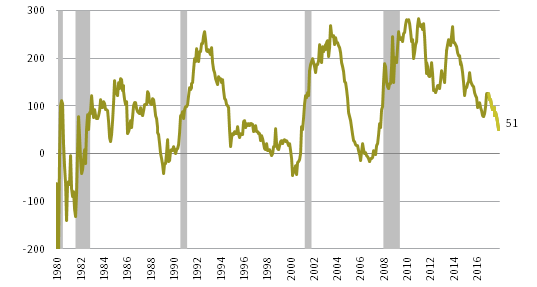
10-YEAR/2-YEAR US TREASURY YIELD SPREAD
January 31, 1980 – December 31, 2017 • Yield Spread (bps)
Sources: Federal Reserve, National Bureau of Economic Research (NBER), and Thomson Reuters Datastream.
Notes: Shaded areas indicate NBER-defined recessions. Lighter colored line depicts 2017 yield spread. Data are monthly.
Risk assets outperformed in 2017 but relative performance was mixed. EM equities outperformed DM equivalents and high-yield bonds outpaced government counterparts, but small caps were flat relative to large caps and value stocks underperformed growth equivalents for four consecutive quarters.
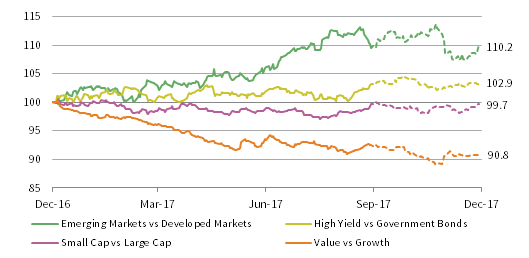
RELATIVE PERFORMANCE OF GLOBAL RISK ASSETS
December 31, 2016 – December 31, 2017 • December 31, 2016 = 100
Sources: Barclays, Bloomberg L.P., MSCI Inc., and Thomson Reuters Datastream. MSCI data provided “as is” without any express or implied warranties.
Notes: Asset classes represented by: MSCI Emerging Markets Index (Emerging Markets), MSCI World Index (Developed Markets), Bloomberg Barclays Global High Yield Index (High Yield), Bloomberg Barclays Global Treasury Bond Index (Government Bonds), MSCI All Country World Small Cap Index (Small Cap), MSCI All Country World Large Cap Index (Large Cap), MSCI All Country World Value Index (Value), and MSCI All Country World Growth Index (Growth). Total return data for all MSCI indexes are net of dividend taxes in local currency terms. Bloomberg Barclays data are in USD terms. Dashed lines indicate Q4 data.
Multiple expansion helped drive US equity returns in 2017 as US stock valuations continued to rerate higher but was much less of a factor in other major equity markets as global equity performance was largely driven by upgraded earnings growth expectations across regions.
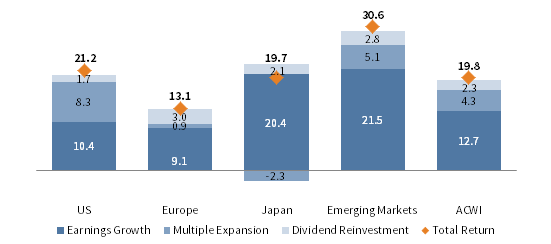
CY 2017 EQUITY RETURNS BY SOURCE FOR SELECT REGIONS
As of December 31, 2017 • Percent (%)
Sources: MSCI Inc. and Thomson Reuters Datastream. MSCI data provided “as is” without any express or implied warranties.
Notes: All returns are in local currency terms. Earnings growth is based on aggregate 12-month forward earnings. Multiple expansion is based on the percent change in 12-month forward price-earnings ratio. Dividend reinvestment is the 12-month total return minus the 12-month price return. All three components of return geometrically compound to total return. Total return data for all MSCI indexes are net of dividend taxes. Total return figure is in bold.
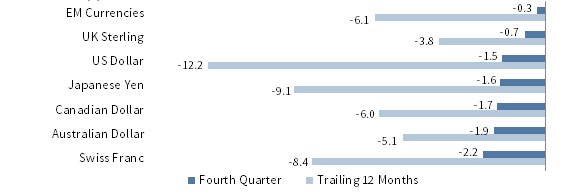
Currency Performance as of December 31, 2017
The US dollar retreated against the euro, our equal-weighted basket of EM currencies, and UK sterling but gained against the Japanese yen, Canadian dollar, Australian dollar, and Swiss franc. All major currencies have appreciated against the US dollar over the past 12 months.

VERSUS THE US DOLLAR
Total Return (%)
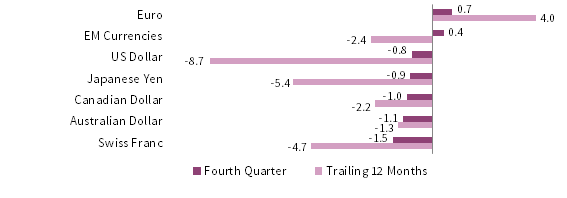
The euro strengthened against all major currencies and our EM currency basket over the past quarter, and also for the trailing 12 months as the Eurozone’s economic recovery progressed and currency markets anticipated tightening by the European Central Bank.
VERSUS THE EURO
Total Return (%)
UK sterling advanced against all major currencies, save for the euro and our equal-weighted basket of EM currencies, on positive developments in Brexit negotiations and the BOE’s dovish rate hike. The pound strengthened against all major DM currencies, aside from the euro, over the last year.
VERSUS THE POUND STERLING
Total Return (%)
Sources: MSCI Inc. and Thomson Reuters Datastream. MSCI data provided “as is” without any express or implied warranties.
Note: EM currencies is an equal-weighted basket of 20 currencies.
USD Market Performance as of December 31, 2017
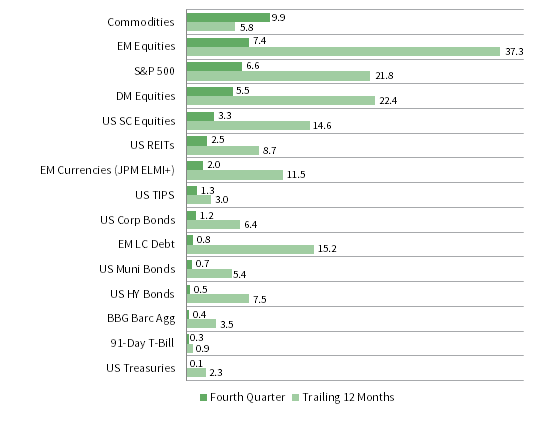
Commodities and EM equities led risk assets higher, outperforming developed markets stocks, domestic bonds, and US REITs, while US large caps bested US small caps. The US Treasury yield curve flattened and credit spreads tightened as US corporate bonds and US high-yield bonds outperformed US Treasuries.
INDEX PERFORMANCE (US$)
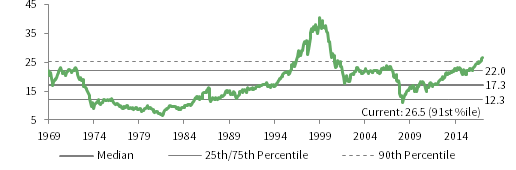
COMPOSITE NORMALIZED P/E: MSCI US
December 31, 1969 – December 31, 2017

FIXED INCOME YIELDS
December 2016 – December 2017
Sources: Barclays, Bloomberg L.P., BofA Merill Lynch, FTSE International Limited, Frank Russell Company, J.P. Morgan Securities, Inc., MSCI Inc., National Association of Real Estate Investment Trusts, Standard & Poor’s, and Thomson Reuters Datastream. MSCI data provided “as is” without any express or implied warranties.
Euro Market Performance as of December 31, 2017
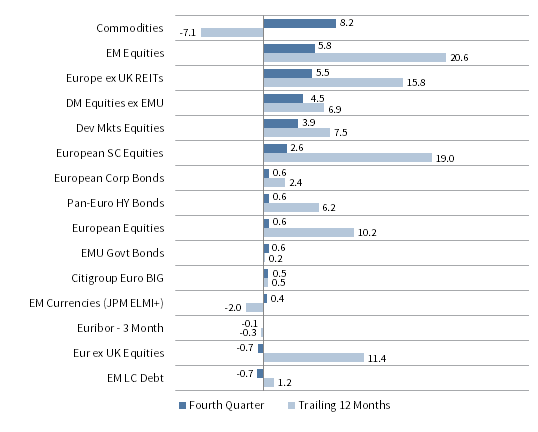
Commodities, , EM equities, and Europe ex UK REITs led gains. European small caps and DM equities outperformed European large caps, whose modest gains were matched by European bonds. EM local currency debt and Europe ex UK equities declined last quarter but gained for the year.
INDEX PERFORMANCE (€)
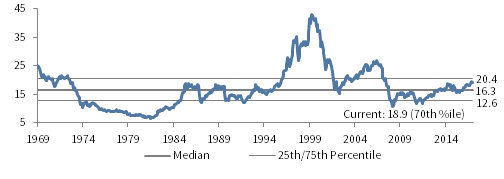
COMPOSITE NORMALIZED P/E: MSCI EUROPE EX UK
December 31, 1969 – December 31, 2017

FIXED INCOME YIELDS
December 2016 – December 2017
Sources: Barclays, Bloomberg L.P., Citigroup Global Markets, EPRA, FTSE International Limited, J.P. Morgan Securities, Inc., MSCI Inc., National Association of Real Estate Investment Trusts, Standard & Poor’s, and Thomson Reuters Datastream. MSCI data provided “as is” without any express or implied warranties.
GBP Market Performance as of December 31, 2017
Commodities, UK REITs, and EM equities outperformed, while EM local currency debt and Europe ex UK equities lagged the most. EM equities and UK mid-caps led gains for the year, and UK linkers and UK corporate bonds outperformed UK gilts for both the quarter and trailing 12 months.

INDEX PERFORMANCE (£)

COMPOSITE NORMALIZED P/E: MSCI UK
December 31, 1969 – December 31, 2017

FIXED INCOME YIELDS
December 2016 – December 2017
Sources: Barclays, Bloomberg L.P., BofA Merill Lynch, EPRA, FTSE International Limited, J.P. Morgan Securities, Inc., MSCI Inc., National Association of Real Estate Investment Trusts, Standard & Poor’s, and Thomson Reuters Datastream. MSCI data provided “as is” without any express or implied warranties.
Exhibit Notes
Performance Exhibits
Total return data for all MSCI indexes are net of dividend taxes.
US dollar index performance chart includes performance for the Bloomberg Barclays Aggregate Bond, Bloomberg Barclays Corporate Investment Grade, Bloomberg Barclays High-Yield Bond, Bloomberg Barclays Municipal Bond, Bloomberg Barclays US TIPS, Bloomberg Barclays US Treasuries, BofA Merrill Lynch 91-Day Treasury Bills, FTSE® NAREIT All Equity REITs, J.P. Morgan ELMI+, J.P. Morgan GBI-EM Global Diversified, MSCI Emerging Markets, MSCI World, Russell 2000®, S&P 500, and S&P GSCI™ indexes.
Euro index performance chart includes performance for the Bloomberg Barclays Euro-Aggregate: Corporate, Bloomberg Barclays Pan-Euro High Yield, Citigroup EMU Govt Bonds, Citigroup Euro Broad Investment-Grade Bonds, Euribor 3-month, FTSE® EPRA/NAREIT Europe ex UK, J.P. Morgan ELMI+, J.P. Morgan GBI-EM Global Diversified, MSCI Emerging Markets, MSCI Europe, MSCI Europe ex UK, MSCI Europe Small-Cap, MSCI World ex EMU, MSCI World, and S&P GSCI™ indexes.
UK sterling index performance chart includes performance for the Bloomberg Barclays Sterling Aggregate: Corporate Bond, BofA Merrill Lynch Sterling High Yield, FTSE® 250, FTSE® All-Share, FTSE® British Government All Stocks, FTSE® British Government Index-Linked All Stocks, FTSE® EPRA/NAREIT UK RE, J.P. Morgan ELMI+, J.P. Morgan GBI-EM Global Diversified, LIBOR 3M GBP, MSCI Emerging Markets, MSCI Europe ex UK, MSCI World, MSCI World ex UK, and S&P GSCI™ indexes.
Valuation Exhibits
The composite normalized P/E ratio is calculated by dividing the inflation-adjusted index price by the simple average of three normalized earnings metrics: ten-year average real earnings (i.e., Shiller earnings), trend-line earnings, and return on equity–adjusted earnings. We have removed the bubble years 1998–2000 from our mean and standard deviation calculations. All data are monthly.
Fixed Income Yields
US fixed income yields reflect Bloomberg Barclays Municipal Bond Index, Bloomberg Barclays US Corporate High-Yield Bond Index, Bloomberg Barclays US Corporate Investment-Grade Bond Index, and the ten-year Treasury.
European fixed income yields reflect the BofA Merrill Lynch Euro Corporate AA Bond Index, BofA Merrill Lynch Euro Corporate Bond Index, Barclays Pan-European Aggregate High Yield Bond Index, Bloomberg Twenty-Year European Government Bond Index (nominal), ten-year German bund, 20-year European Inflation Swaps (inflation expectations), and the real yield calculated as the difference between the inflation expectation and nominal yield.
UK sterling fixed income yields reflect the BofA Merrill Lynch Sterling Corporate AA Bond Index, BofA Merrill Lynch Sterling Corporate Bond Index, UK ten-year gilts, Bank of England 20-year nominal yields, and Bloomberg Generic UK 20-year inflation-linked (real) yields. Current UK 20-year nominal yield data are as of December 28, 2017.