Fourth quarter continued the reflationary trends that began driving global financial markets in July as the outcomes of the US election and OPEC summit in November and the US Federal Reserve meeting in December reinforced the reflation theme. Global government bonds sold off further, with US Treasuries suffering their worst quarter since 1980. Meanwhile, global equities continued to rally, with several developed markets touching their highest levels of the year in December. For the quarter, developed markets equities meaningfully outperformed emerging markets equivalents, which declined. Relative performance of individual equity markets and regions depended on one’s home currency given large currency fluctuations—the US dollar strengthened, while the euro and yen notably weakened. Developed natural resources equities outperformed global stocks as oil and industrial metals prices rallied, leading commodities higher. Gold dropped as higher rates weighed on sentiment; global developed REITs were similarly impacted.
Recent market developments reflect a shift in the balance of risks facing investors and changes in their portfolio positioning in response. Acute deflation concerns first associated with the oil price collapse and the potential for a Chinese hard landing to start the year and later following the UK’s historic “Brexit” vote in June have given way to a more even inflation risk outlook. Several factors have reduced the risk of outright deflation and contributed to higher inflation expectations—improving economic performance across several important markets; higher commodity prices; signs that some central banks are rethinking their use of negative interest rates; and anticipation of greater coordination between monetary and fiscal policies to support growth. These trends led to a distinct rotation within asset classes over the second half of the year and notably in fourth quarter. Higher interest rates hurt longer duration and yield-oriented assets in particular, as evidenced by the declines in long-term government bonds, REITs, and the utility and consumer staples equity sectors. Value stocks and cyclical sectors outperformed, driven in large part by a strong rally in financials. Developed markets value stocks enjoyed their largest quarter and calendar year of outperformance relative to growth counterparts since second quarter 2003 and 2006, respectively.
US equities (3.8%) were the third best-performing developed market for the quarter in USD terms as all major US stock indexes touched all-time highs in December. US small caps in particular enjoyed a strong rally following the election of Donald Trump, outperforming large caps by 500 basis points (bps) for the quarter, partly in anticipation of a combination of higher domestic growth and lower taxes, which stand to benefit small caps more. Better financial results announced during the quarter also helped drive US equities higher, as the S&P 500 produced positive year-over-year earnings growth for the first time in over a year. Small-cap results were particularly strong, with Russell® 2000 earnings per share growing almost 8% year-over-year in third quarter. Small-cap value was the best performing market segment in fourth quarter, while mid-cap growth was the worst. Most sectors advanced—exceptions were real estate, health care, and consumer staples. Financials were by far the best performing sector, rallying over 21% in the quarter. Despite improving fundamentals, US equity valuations look increasingly stretched, with US small-cap valuations now just below their highest level since 1978.
UK stocks (4.2%) flirted with all-time highs throughout December, with the FTSE® All-Share Index setting a new record on the last trading day of the year, but it wasn’t enough to outperform Europe ex UK (5.9%) equivalents. UK equities were the second best performing major developed market in local currency terms for the full calendar year, but extreme pound sterling weakness wiped out all of the gains in USD terms (-0.1%). Eurozone equities (8.0%) rallied in December after the European Central Bank (ECB) announced changes to its asset purchase program, including an extension through year-end 2017, which were well received by markets. Eurozone financials rallied over 23% for the quarter with the prospect of steeper yield curves and better economic growth to support bank profits. European markets also appear to have shrugged off recent political developments. Stocks in Italy (18.0%) rallied into year-end despite the failed December 4 constitutional referendum, the subsequent resignation of Prime Minister Matteo Renzi, and the announced government bailout of long-troubled lender Banca Monte dei Paschi di Siena at year-end.
Japanese equities (15.0%) rallied hard in fourth quarter, significantly outperforming global equivalents in local currency terms, but sharp yen weakness erased much of the gains in foreign currency terms, with Japanese stocks slightly declining in USD terms (-0.2%). Passive inflows from both domestic and foreign investors meant that the Japanese rally was broad-based—every sector advanced and a majority of sectors enjoyed double-digit gains. Financials jumped over 30% on anticipation that a steeper yield curve resulting from the Bank of Japan’s new yield targeting policy will ease pressure on Japanese bank margins. Japanese stocks were also supported by the continued strong pace of corporate buybacks, with 2016 share repurchases expected to surpass the level observed in 2015.
Emerging markets equities (-1.4% in local currency terms and -4.1% in USD terms) declined in fourth quarter as sentiment generally deteriorated in response to higher interest rates, a stronger US dollar, and expectations of more protectionist US trade policy. EM stocks meaningfully underperformed developed markets equivalents (around 600 to 700 bps depending on one’s currency) for the quarter though still outperformed for the calendar year, their first annual outperformance since 2012. Performance across regions was mixed—emerging Europe, Middle East, and Africa (3.7%) and Latin America (1.3%) enjoyed modest gains, while emerging Asia (-3.0%) stocks retreated. Fourth quarter also produced a wide spectrum of returns at the individual country level. Stocks in India (-6.2%) declined following the government’s surprise demonetization initiative announced in early November, with signs that economic activity and growth will suffer at least in the short run. Korea (3.9%) was the best performing Asian market in local currency terms despite news that President Park will face impeachment in response to corruption charges leveled against her and a close ally. The election of Donald Trump also contributed to the performance of some markets—sentiment toward the Philippines (-10.6%), China (-7.1%), and Mexico (-1.9%) appeared to suffer in light of his protectionist rhetoric, while stocks in Russia (15.7%) rallied in part due to statements by Trump supporting greater cooperation between the United States and Russia but also as a result of sharply higher oil prices.
Real assets experienced mixed performance across categories. Natural resources equities (6.8% in USD terms for the MSCI World Natural Resources Index) outperformed broad global equities with above market gains for both energy and metals & mining shares in response to strong price rallies in crude oil and industrial metals. WTI and Brent jumped 11.4% and 15.8% for the quarter, ending at $53.72 and $56.82, respectively. Such sharp moves reflected a shift in market positioning as some investors closed out short positions following the announced supply agreement between the OPEC cartel and some non-OPEC producers, led by Russia, to cut global production well below recent output levels starting in January. Energy MLPs (2.0%) saw more muted gains than traditional energy stocks for the quarter, but enjoyed a double-digit rally for the full year. Commodity futures (2.7% for the Bloomberg Commodity TR Index and 5.8% for the S&P GSCI™) also gained despite sharp losses for precious metals, with the gold spot price dropping 12.4% over the quarter to $1,157.49/troy ounce as higher interest rates weighed on sentiment. Global developed REITs (-5.4%) were similarly impacted.
Global developed markets government bonds (-3.2%) continued their second half correction, reflecting higher interest rates and steeper yield curves in most regions. US Treasuries (-3.8%) wiped out most of their calendar year gains and underperformed UK gilts (-3.4%) and EMU government bonds (-3.0%) for the quarter. The US Treasury yield curve shifted meaningfully higher over the fourth quarter; yields across maturities now sit slightly above levels of a year ago. Both the US election outcome and the Fed’s December rate hike were important factors driving US and global yields higher. Long-dated bonds corrected the most—yields for ten-year and thirty-year US Treasuries jumped 85 bps and 74 bps to 2.45% and 3.06%, respectively. US tax-exempt bonds (-3.6%) outperformed US Treasuries, as did US investment-grade corporate bonds (-2.8%). In contrast to investment-grade counterparts, US high-yield corporate bonds (1.8%) rallied in response to higher commodity prices and expectations for better domestic economic growth. Global inflation-linked bonds (-2.2%) declined, although rising inflation expectations meant that both US TIPS (-2.4%) and UK linkers (-2.7%) outperformed nominal equivalents.
The US dollar index touched a 14-year high during the quarter as the greenback appreciated against most of the currencies we track, including all the majors. Diverging monetary policies have led to rising interest rate differentials between US Treasuries and foreign government bonds that have contributed to dollar strength, most notably versus the euro and yen. The ECB’s decision to extend its asset purchases contributed to a weaker euro; among the major currencies only the yen depreciated more. The British pound was more mixed; sterling weakened versus the US dollar, Canadian dollar, Swiss franc, and our EM currency basket but appreciated relative to the yen, euro, and Australian dollar. All but three emerging markets currencies depreciated against the US dollar with the Turkish lira, South Korean won, and Polish zloty the hardest hit. The Chinese yuan fell 4% versus the greenback, touching an eight-year low, but was more stable against the trade-weighted currency basket maintained by an arm of the central bank.
Market Exhibits
US Treasury Yield Curve
The US Treasury yield curve shifted meaningfully higher over the fourth quarter with yields rising across maturities, and yields now sit slightly above levels of a year ago. Market expectations for future inflation, growth, and interest rates were upgraded following the election of Donald Trump and with Republicans retaining control of both the House and Senate
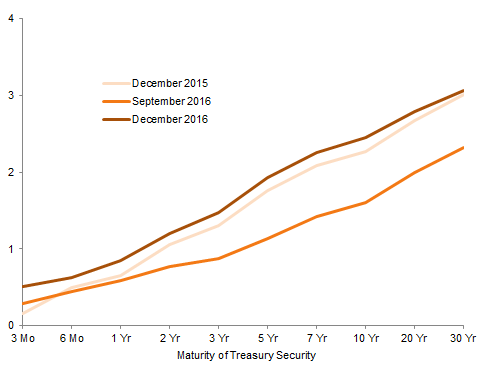
US Treasury Yield Curve
As of December 31, 2016 • Percent (%)
Sources: Thomson Reuters Datastream and US Treasury.
US Fed Funds Rate Expectations
Expectations for higher interest rates were reinforced by the Fed, which raised its benchmark Federal Funds rate by 25 bps, as expected, at its December meeting. Some FOMC members also raised their rate projections, which meant the “dot plot” showing the median FOMC member’s projections shifted higher for the first time since March
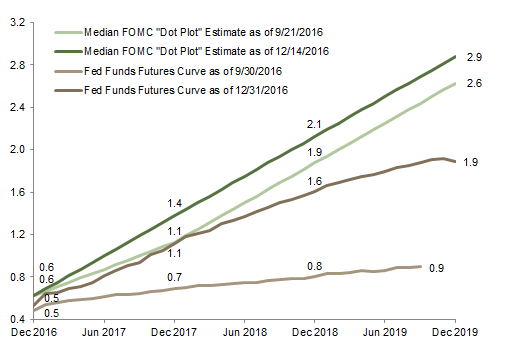
US Fed Funds Rate Expectations
Percent (%)
Sources: Bloomberg L.P. and Federal Reserve.
Notes: Data for September 2016 Fed Fund Futures curve available to August 2019. Pricing for September 2019 futures contract as of 10/03/16. Data for December 2016 Fed Fund Futures curve available to November 2019. Pricing for December 2019 futures contract as of 01/03/17.
Equity Returns by Source
Despite a global earnings recession, global equities enjoyed decent gains in 2016, primarily driven by P/E expansion. UK and Swiss equities in particular drove the multiple expansion in Europe, with their sharp earnings declines dragging down those for the region overall given more resilient Eurozone earnings. US and EM equities outperformed counterparts in Europe and Japan

Equity Returns by Source
Calendar Year 2016
Sources: MSCI Inc. and Thomson Reuters Datastream. MSCI data provided “as is” without any express or implied warranties.
Notes: All returns are in local currency terms. Multiple expansion is represented by the change in the price-earnings ratio. Earnings growth is based on aggregate 12-month trailing earnings. Dividend reinvestment is the 12-month total return minus the 12-month price return. All three components of return geometrically compound to total return. Total returns for MSCI developed markets indexes are net of dividend taxes. Total returns for MSCI emerging markets and AC world indexes are gross of dividend taxes.
Relative Performance of MSCI World Value vs MSCI World Growth
Developed markets value stocks outperformed growth equivalents both in the fourth quarter and for the full calendar year, the largest annual outperformance for value since 2006. The main drivers were the strong rebound in natural resources equities since the February low and the sharp rally in bank stocks alongside rising interest rates during the second half

Relative Performance of MSCI World Value vs MSCI World Growth
June 30, 2003 – December 31, 2016 • Rebased to 100 on June 30, 2003
Sources: MSCI Inc. and Thomson Reuters Datastream. MSCI data provided “as is” without any express or implied warranties.
Note: Performance data are local currency total returns, net of dividend taxes.
Currency Performance
The US dollar strongly appreciated versus all the major currencies and our EM currency basket for the quarter, with the greenback gaining the most against the euro and yen. With the exception of the sharply weaker British pound, the USD’s moves were more muted for the full calendar year, including weakness relative to the Canadian dollar and Japanese yen
The euro weakened in fourth quarter, falling the most against the US dollar and Canadian dollar. Only the Japanese yen depreciated versus the euro for the quarter, although the yen was the second best performer, after the Canadian dollar, for the calendar year
The British pound’s weakness in 2016 was unprecedented in recent memory, depreciating by double digits for the year against all but 2 of the 27 currencies we track. Sterling did regain some ground in fourth quarter, strengthening versus 11 of the currencies we track, including the Australian dollar, euro, and yen

Currency Performance
As of December 31, 2016
Sources: MSCI Inc. and Thomson Reuters Datastream. MSCI data provided “as is” without any express or implied warranties.
Note: EM currencies is an equal-weighted basket of 20 currencies.
Index Performance (USD)
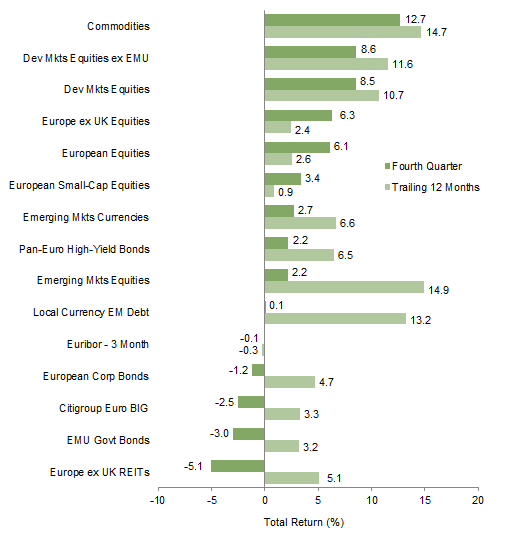
Commodities, developed markets equities, and US high-yield bonds advanced for the quarter. US stocks outperformed global equivalents, led by US small caps, while US TIPS, US investment-grade bonds, and US REITs declined. Emerging markets equities and local currency EM debt suffered the largest losses but remain among the top performers for the calendar year
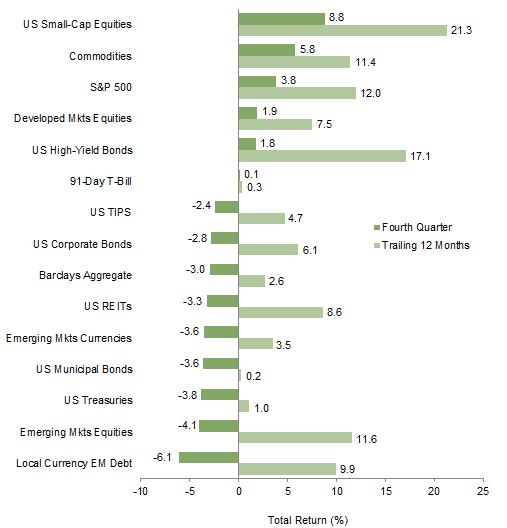
Index Performance (USD)
As of December 31, 2016
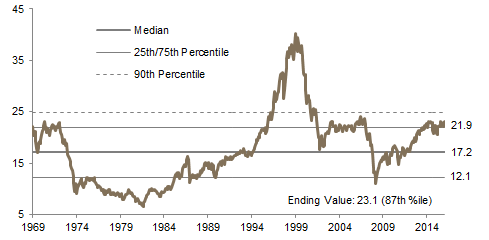
MSCI US Composite Normalized P/E
December 31, 1969 – December 31, 2016
Sources: Barclays, Bloomberg L.P., BofA Merill Lynch, FTSE International Limited, Frank Russell Company, J.P. Morgan Securities, Inc., MSCI Inc., National Association of Real Estate Investment Trusts, Standard & Poor’s, and Thomson Reuters Datastream. MSCI data provided “as is” without any express or implied warranties.
Fixed Income Yields
December 2015 – December 2016
Index Performance (€)
Commodities and developed markets equities outperformed Europe ex UK stocks for the quarter. Pan-euro high-yield bonds and emerging markets equities also advanced, while Eurozone investment-grade bonds and Europe ex UK REITs experienced declines. All major asset categories are in the black for the calendar year, led by emerging markets equities, commodities, and local currency EM debt
Index Performance (€)
As of December 31, 2016
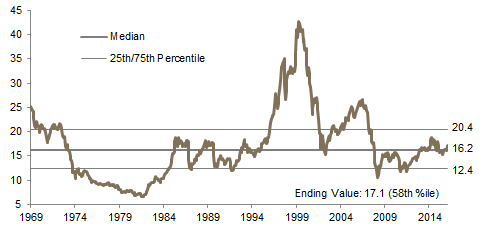
MSCI Europe ex UK Composite Normalized P/E
December 31, 1969 – December 31, 2016
Sources: Barclays, Bloomberg L.P., Citigroup Global Markets, EPRA, FTSE International Limited, J.P. Morgan Securities, Inc., MSCI Inc., National Association of Real Estate Investment Trusts, Standard & Poor’s, and Thomson Reuters Datastream. MSCI data provided “as is” without any express or implied warranties.
Fixed Income Yields
December 2015 – December 2016
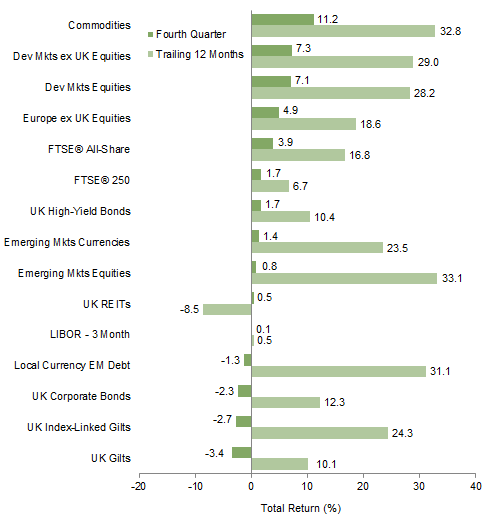
Index Performance (₤)
Commodities and developed markets equities enjoyed strong gains for the quarter. UK equities and UK high-yield bonds also advanced, as did emerging markets stocks and UK REITs. UK investment-grade corporate bonds declined, but outperformed linkers and gilts. For the calendar year, UK REITs were the only major asset class to decline, as most enjoyed double-digit gains, led by EM stocks
Index Performance (₤)
As of December 31, 2016
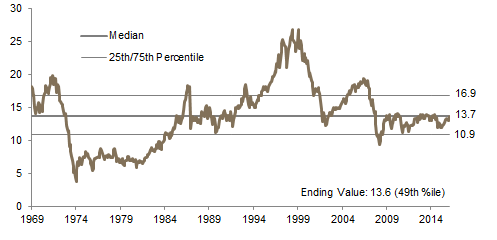
MSCI UK Composite Normalized P/E
December 31, 1969 – December 31, 2016
Sources: Barclays, Bloomberg L.P., BofA Merrill Lynch, EPRA, FTSE International Limited, J.P. Morgan Securities, Inc., MSCI Inc., National Association of Real Estate Investment Trusts, Standard & Poor’s, and Thomson Reuters Datastream. MSCI data provided “as is” without any express or implied warranties.
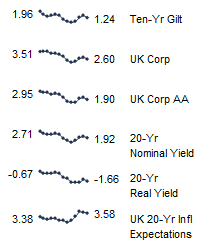
Fixed Income Yields
December 2015 – December 2016
Exhibit Notes
Performance Exhibits
Total returns for MSCI developed markets indexes are net of dividend taxes. Total returns for MSCI emerging markets indexes are gross of dividend taxes.
US dollar index performance chart includes performance for the Bloomberg Barclays Aggregate Bond, Bloomberg Barclays Corporate Investment Grade, Bloomberg Barclays High-Yield Bond, Bloomberg Barclays Municipal Bond, Bloomberg Barclays US TIPS, Bloomberg Barclays US Treasuries, BofA Merrill Lynch 91-Day Treasury Bills, FTSE® NAREIT All Equity REITs, J.P. Morgan ELMI+, J.P. Morgan GBI-EM Global Diversified, MSCI Emerging Markets, MSCI World, Russell 2000®, S&P 500, and S&P GSCI™ indexes.
Euro index performance chart includes performance for the Bloomberg Barclays Euro-Aggregate: Corporate, Bloomberg Barclays Pan-Euro High Yield, Citigroup EMU Govt Bonds, Citigroup Euro Broad Investment-Grade Bonds, EURIBOR 3M, FTSE® EPRA/NAREIT Europe ex UK, J.P. Morgan ELMI+, J.P. Morgan GBI-EM Global Diversified, MSCI Emerging Markets, MSCI Europe, MSCI Europe ex UK, MSCI Europe Small-Cap, MSCI World ex EMU, MSCI World, and S&P GSCI™ indexes.
UK sterling index performance chart includes performance for the Bloomberg Barclays Sterling Aggregate: Corporate Bond, BofA Merrill Lynch Sterling High Yield, FTSE® 250, FTSE® All-Share, FTSE® British Government All Stocks, FTSE® British Government Index-Linked All Stocks, FTSE® EPRA/NAREIT UK RE, J.P. Morgan ELMI+, J.P. Morgan GBI-EM Global Diversified, LIBOR 3M GBP, MSCI Emerging Markets, MSCI Europe ex UK, MSCI World, MSCI World ex UK, and S&P GSCI™ indexes.
Valuation Exhibits
The composite normalized P/E ratio is calculated by dividing the inflation-adjusted index price by the simple average of three normalized earnings metrics: ten-year average real earnings (i.e., Shiller earnings), trend-line earnings, and return on equity–adjusted earnings. We have removed the bubble years 1998–2000 from our mean and standard deviation calculations. All data are monthly.
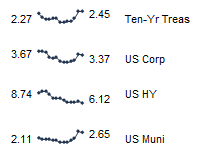
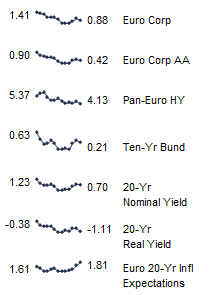
Fixed Income Yields
US fixed income yields reflect Bloomberg Barclays Municipal Bond Index, Bloomberg Barclays US Corporate High-Yield Bond Index, Bloomberg Barclays US Corporate Investment-Grade Bond Index, and the ten-year Treasury.
European fixed income yields reflect the BofA Merrill Lynch Euro Corporate AA Bond Index, BofA Merrill Lynch Euro Corporate Bond Index, Barclays Pan-European Aggregate High Yield Bond Index, Bloomberg Twenty-Year European Government Bond Index (nominal), ten-year German bund, 20-year European Inflation Swaps (inflation expectations), and the real yield calculated as the difference between the inflation expectation and nominal yield.
UK sterling fixed income yields reflect the BofA Merrill Lynch Sterling Corporate AA Bond Index, BofA Merrill Lynch Sterling Corporate Bond Index, UK ten-year gilts, and Bank of England 20-year nominal, real, and zero coupon (inflation expectations) yields.