Fourth quarter ended with highly anticipated central bank policy action on both sides of the Atlantic. The US Federal Reserve announced, as expected, its first rate increase since the global financial crisis, while the European Central Bank’s (ECB) expanded quantitative easing program disappointed investors by meeting, but failing to exceed, market expectations. The broad relief rally in global equities observed in October following the summer sell-off faded in November and fizzled further in December, yet the quarter still ranked as the best for developed markets equities in more than two years. Fixed income assets fared poorly in general as the fading accommodative bias of major central banks reflects economic improvement that reduces bonds’ attractiveness as a deflation hedge. Meanwhile, commodity markets continued to be roiled by excess supply and slowing demand, with oil prices suffering in particular. Energy-related assets declined in sympathy but not to the same extent as the underlying commodity.
The overall economic improvements that prompted the US Fed hike obscure the ongoing weakness in certain segments of the economy—namely, natural resources extraction and manufacturing. In fact, higher rates and a stronger US dollar are contributing to the challenges facing lower quality and leveraged businesses in the commodity and export sectors. This was evident in the sell-off of high-yield bonds in fourth quarter, a move that was exacerbated by poor market liquidity as stricter financial sector regulations have reduced dealer inventories. A widely publicized high-yield mutual fund closure added further fuel to the fire. The result is an ongoing debate over whether troubles in the debt markets are a harbinger of a looming economic recession and an equity bear market, as they were in the lead up to the global financial crisis, or a reflection of market-, sector-, or investor-specific issues that will remain contained.
US equities (7.0% fourth quarter S&P 500 return) slightly outperformed developed counterparts as third quarter earnings results were better than feared, and economic data releases further reassured investors that the recovery remains intact for now. Mega-cap growth stocks outperformed as they did all year; small-cap and value shares lagged. The US market’s narrow leadership in 2015, where a handful of technology and consumer stocks drove the lion’s share of the S&P 500’s muted gain, is a concern among some market observers who cite it as evidence of deteriorating market fundamentals and a US equity market cycle that is long in the tooth. Yet the outperformance of growth versus value was not strictly a US phenomenon in 2015, as growth handily outpaced value throughout both developed and emerging markets. This perhaps speaks more to investors’ ongoing penchant for quality growth companies in the face of an uncertain, low-growth global market environment.
The strong rally in European equities during the first two months of the quarter was led by EMU stocks, which ended the quarter up 6.5%, as investors anticipated additional decisive monetary easing by the ECB. German equities (10.7%) outperformed all major markets as a result. Policymakers pushed the deposit rate further into negative territory, expanded the pool of collateral for the central bank’s asset purchases, and extended the term of the program through at least March 2017. Yet investors were disappointed that ECB President Mario Draghi failed to “overdeliver” to support asset prices as he had in the past, and Eurozone equities slid sharply following the bank’s early December meeting. Europe ex UK (5.9%) and UK (3.5%) stocks still trailed their Eurozone peers for the quarter, with the UK market’s exposure to natural resources and emerging markets weighing on its latest earnings growth figures in particular.
Japanese equities (9.8%) were among the best-performing major markets in fourth quarter, a reversal of the previous quarter’s experience when foreigners’ holdings of Japanese stocks proved especially vulnerable to the growth fears triggered by China’s mishandling of its stock market bubble and currency devaluation. More recent signs of stability in the latter helped improve investor sentiment toward the former. Japanese stocks also remain supported by strong profit growth that belies continued economic weakness, as recent wage improvements have yet to bolster flagging household consumption. Growing domestic demand for equities, led by the government’s well-publicized move into stocks and corporate governance initiatives, has also helped offset profit-taking by offshore investors.
Emerging markets stocks (1.6%) continued to trail developed markets equivalents. Emerging Asia (3.0%) outperformed broader emerging markets on the quarter and performed in line on the year, while Latin America (-2.0%) continued to underperform for both the quarter and the year. Brazil (-3.8%) lagged significantly among major markets as the Petrobras corruption scandal has led to an impeachment case against deeply unpopular President Dilma Rousseff in the midst of the country’s worst recession since the Great Depression, prompting her to replace her finance minister in a further blow to investor sentiment. Emerging Europe, the Middle East & Africa (-1.4%) underperformed broader emerging markets for the quarter but outperformed for the year. Greece, now a miniscule part of the index, returned the worst calendar year performance of any country in the MSCI All Country World Index, with an eye-popping -56.8% return. South Africa (0.3%) underperformed for the quarter as embattled President Jacob Zuma unexpectedly replaced his well-regarded finance minister with a veritable unknown only to reverse course days later and name a proven and well-known successor. Such unsettling political developments across emerging markets help explain the further currency weakness that resulted in weaker performance for emerging markets equities (0.7%) for US$-based investors.
The US dollar strengthened against most major currencies in the lead up to Fed lift-off, though the greenback gave back some ground in December following the ECB meeting. Only the Australian dollar appreciated versus the US dollar for the quarter as the Reserve Bank of Australia refrained from further lowering its benchmark interest rate. The euro and pound sterling both weakened for the quarter, while the yen was more stable against the dollar. Emerging markets currencies continued to weaken, with the South African rand and Russian ruble depreciating the most.
Global government bonds (-0.1%) were virtually flat in aggregate. Eurozone sovereign bonds (0.5%) continued to benefit from central bank purchases despite the prevalence of negative yields, while UK gilts (-1.2%) and US Treasuries (-0.9%) suffered losses in fourth quarter but managed to eke out small gains for the calendar year. The US Treasury yield curve flattened considerably, with the two-year yield rising 42 bps over the quarter; yield increases for longer maturities were less pronounced. US tax-exempt bonds (1.5%) enjoyed a strong quarter despite Puerto Rico’s ongoing debt crisis, while losses among US investment-grade corporate credits (-0.6%) cemented similar slight declines for the calendar year. US high-yield bonds (-2.1%) sold off, as fund outflows were driven by further commodity price weakness and liquidity concerns after a high-yield mutual fund suspended redemptions in conjunction with its announcement to wind down.
Performance of inflation-sensitive assets was quite varied. Commodities (-10.5% for the Bloomberg Commodity Total Return Index and -16.6% for the energy-heavy S&P GSCI) suffered another leg down led by plummeting energy prices, with crude oil prices ($37.04 for WTI and $37.28 for Brent) ending the year near their post-crisis lows reached in December. The OPEC cartel’s decision to forego a production target following its most recent meeting and rising global inventories were to blame. Declines among energy-related assets were less severe, with global developed market energy stock prices (-0.5%) proving resilient and energy master limited partnerships (-2.8%) paring losses amid a volatile quarter. Outside of the natural resources space, US REITs (7.7%) rallied strongly, outperforming broader US equities, while US Treasury Inflation-Protected Securities (-0.6%) declined slightly as yields moved further into positive territory.
Fourth quarter saw oil prices suffer another leg down amid rising global inventories and after OPEC failed to set a production target. Energy-related assets declined in sympathy, though not to the same extent as the underlying commodity
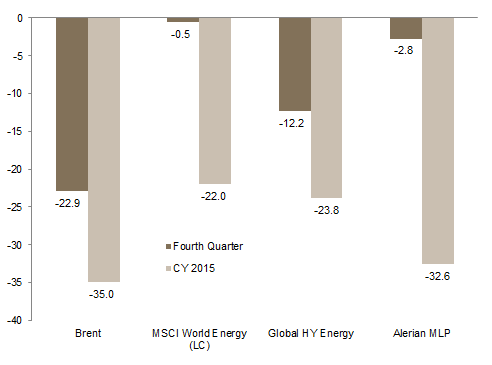
Oil and Energy–Related Equities Performance
As of December 31, 2015 • Percent Change (%)
Sources: Alerian, Barclays, Bloomberg L.P., MSCI Inc., and Thomson Reuters Datastream. MSCI data provided “as is” without any express or implied warranties.
Notes: Brent and MSCI World Energy are price returns. Alerian MLP and Global HY Energy data are total returns.
US high-yield bonds sold off in fourth quarter, with yields of the lowest-quality bonds skyrocketing 415 bps to over 16% from early November lows, while the yield on the composite index backed up over 140 bps. Energy- and mining-related credit fears and liquidity concerns drove fund redemptions
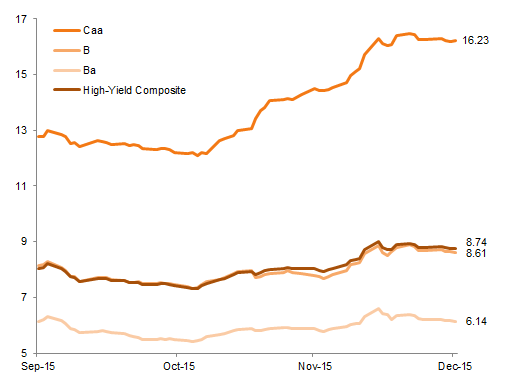
High-Yield Bond Yield by Credit Quality
September 30, 2015 – December 31, 2015 · Percent (%)
Source: Barclays.
Energy stocks are also pulling down aggregate earnings and revenue estimates for S&P 500 companies; earnings growth for calendar year 2015 is expected to be a healthy 6% excluding energy companies, but roughly flat for the full index
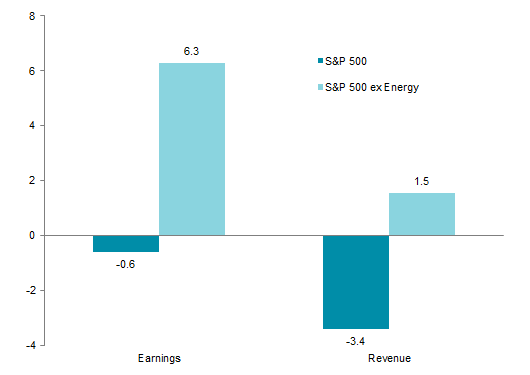
Calendar Year 2015 Earnings Growth and Revenue Growth Estimates
Percent (%)
Sources: FactSet Research Systems and Standard & Poor’s.
Note: Current estimates are as of January 4, 2016.
The long end of the US Treasury curve remains anchored around 3% even as the Fed’s December rate hike jump-started the shorter end of the curve, with yields on the two-year note up 42 bps since the end of third quarter
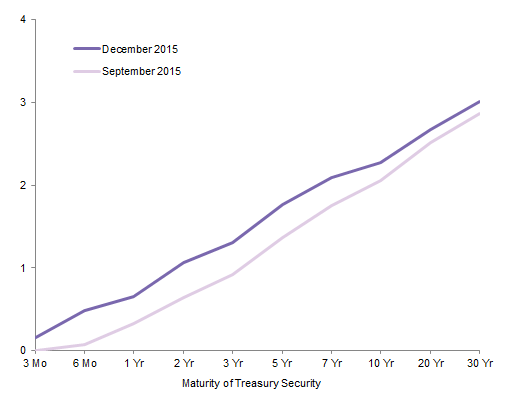
US Treasury Yield Curve
As of December 31, 2015 · Percent (%)
Sources: Thomson Reuters Datastream and US Treasury.
Strong fourth quarter (primarily October) performance from US REITs and US equities brought them into the black for the calendar year. Bond returns were mildly negative to midly positive for the year. For unhedged US-based investors, returns for emerging markets asset classes were dragged down by US$ strength, and both equities and bonds ended the year with double-digit losses. Commodities’ -33% return for the year matched losses in calendar year 2014
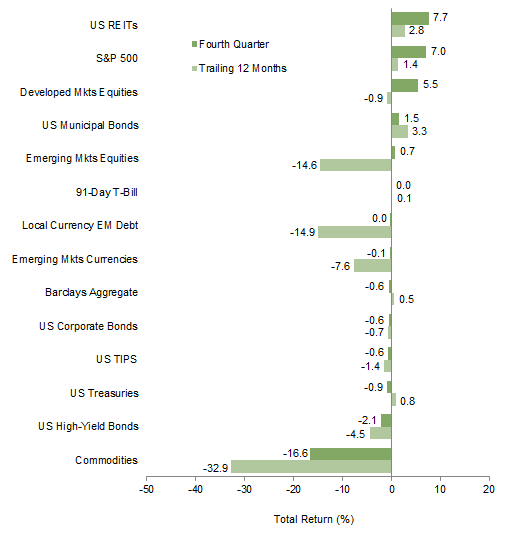
Index Performance (US$)
As of December 31, 2015
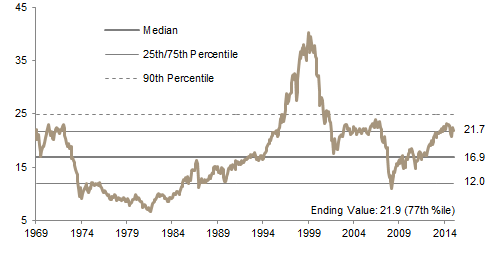
MSCI US Composite Normalized P/E
December 31, 1969 – December 31, 2015
Sources: Barclays, BofA Merill Lynch, FTSE International Limited, J.P. Morgan Securities, Inc., MSCI Inc., National Association of Real Estate Investment Trusts, Standard & Poor’s, and Thomson Reuters Datastream. MSCI data provided “as is” without any express or implied warranties.
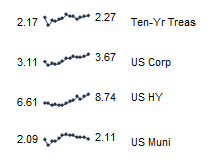
Fixed Income Yields
December 2014 – December 2015
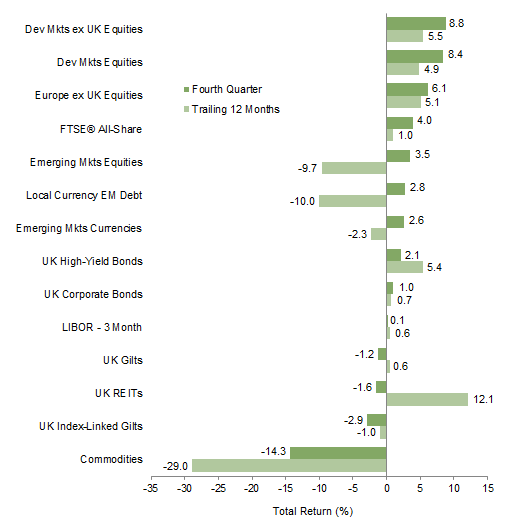
Many European assets enjoyed strong fourth quarter returns and posted double-digit gains for the year, and unhedged euro-based investors saw strong gains in developed markets equities due to the weakening euro. Bond returns were mildly negative to mildly positive for the year. Commodity losses were in double-digits for the quarter and year, while positive returns for emerging markets equities and bonds in fourth quarter helped reduce losses for the year
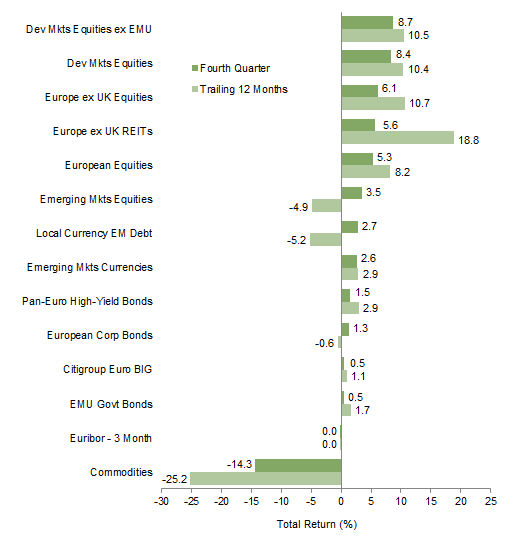
Index Performance (€)
As of December 31, 2015
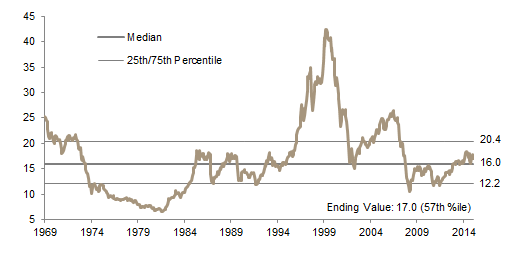
MSCI Europe ex UK Composite Normalized P/E
December 31, 1969 – December 31, 2015
Sources: Barclays, Bloomberg L.P., BofA Merill Lynch, Citigroup Global Markets, EPRA, FTSE International Limited, MSCI Inc., J.P. Morgan Securities, Inc., National Association of Real Estate Investment Trusts, Standard & Poor’s, and Thomson Reuters Datastream. MSCI data provided “as is” without any express or implied warranties.
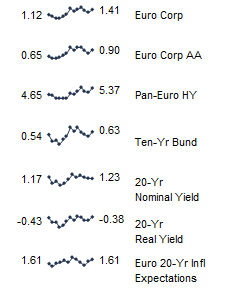
Fixed Income Yields
December 2014 – December 2015
UK equities trailed their developed peers in fourth quarter and posted a meager 1% for the calendar year. UK REITs, despite a poor fourth quarter, posted double-digit returns for the year. As in other regions, bond returns were mildly negative to mildly positive for the year. Positive returns for emerging markets equities and bonds helped reduce losses for the year, and commodities posted a second straight year of double-digit losses
Index Performance (₤)
As of December 31, 2015
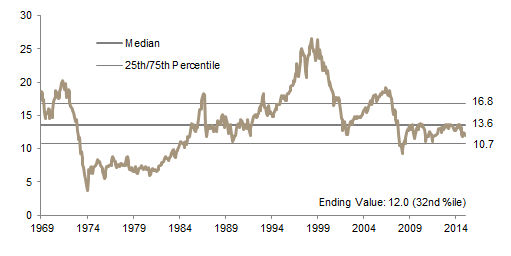
MSCI UK Composite Normalized P/E
December 31, 1969 – December 31, 2015
Sources: Bank of England, Barclays, BofA Merrill Lynch, EPRA, FTSE International Limited, J.P. Morgan Securities, Inc., MSCI Inc., National Association of Real Estate Investment Trusts, Standard & Poor’s, and Thomson Reuters Datastream. MSCI data provided “as is” without any express or implied warranties.
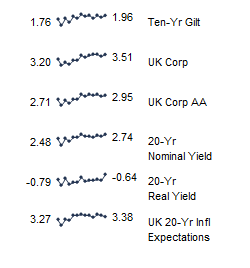
Fixed Income Yields
December 2014 – December 2015
US$ strength was the theme of 2015, although the Australian dollar’s fourth quarter gains reduced some of its losses against the US dollar for the year. The euro rebounded somewhat in December from its significant drop in November against the US dollar; still, for the quarter and the year, the euro posted substantial losses
The Japanese yen, Swiss franc, and US dollar were up strongly against the euro for the year, while a weak December for the Australian dollar, Canadian dollar, and our EM currency basket meant the euro strengthened against these currencies for the year
The UK pound was mixed for the year, showing strength against the Australian dollar, Canadian dollar, euro, and our EM currency basket, but weakening versus the Japanese yen, Swiss franc, and US dollar
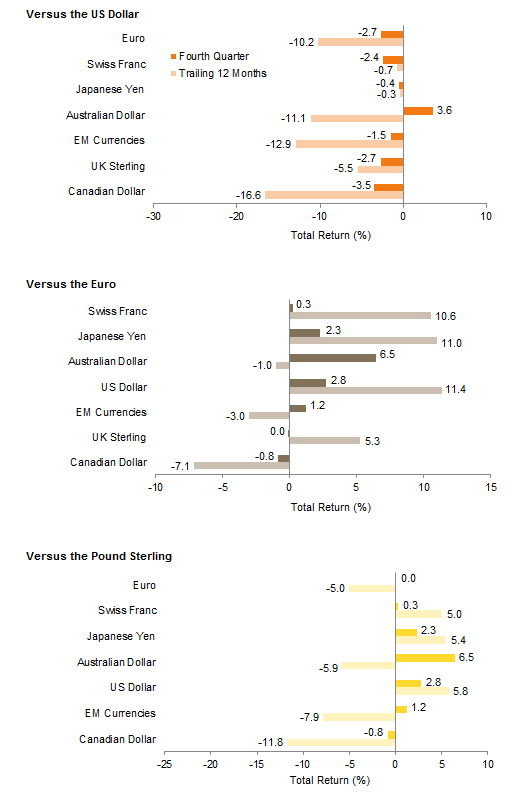
Currency Performance
As of December 31, 2015
Sources: MSCI Inc. and Thomson Reuters Datastream. MSCI data provided “as is” without any express or implied warranties.
Note: EM currencies is an equal-weighted basket of 20 currencies.
Exhibit Notes
Performance Exhibits
Total returns for MSCI developed markets indexes are net of dividend taxes. Total returns for MSCI emerging markets indexes are gross of dividend taxes.
US dollar index performance chart includes performance for the Barclays Aggregate Bond, Barclays Corporate Investment Grade, Barclays High Yield Bond, Barclays Municipal Bond, Barclays US TIPS, Barclays US Treasuries, BofA Merrill Lynch 91-Day Treasury Bills, FTSE® NAREIT All Equity REITs, J.P. Morgan ELMI+, J.P. Morgan GBI-EM Global Diversified, MSCI Emerging Markets, MSCI World, S&P 500, and S&P GSCI™ indexes.
Euro index performance chart includes performance for the Barclays Euro-Aggregate: Corporate, Barclays Pan-Euro High Yield, Citigroup EMU Govt Bonds, EURIBOR 3M, FTSE® EPRA/NAREIT Europe ex UK RE, J.P. Morgan ELMI+, J.P. Morgan GBI-EM Global Diversified, MSCI Emerging Markets, MSCI Europe, MSCI Europe ex UK, MSCI World, MSCI World ex EMU, and S&P GSCI™ indexes.
UK sterling index performance chart includes performance for the Barclays Sterling Aggregate: Corporate Bond, BofA Merrill Lynch Sterling High Yield, FTSE® All-Share, FTSE® British Government All Stocks, FTSE® British Government Index-Linked All Stocks, FTSE® EPRA/NAREIT UK RE, J.P. Morgan ELMI+, J.P. Morgan GBI-EM Global Diversified, LIBOR 3M GBP, MSCI Emerging Markets, MSCI Europe ex UK, MSCI World, MSCI World ex UK, and S&P GSCI™ indexes.
Valuation Exhibits
The composite normalized P/E ratio is calculated by dividing the inflation-adjusted index price by the simple average of three normalized earnings metrics: ten-year average real earnings (i.e., Shiller earnings), trend-line earnings, and return on equity–adjusted earnings. We have removed the bubble years 1998–2000 from our mean and standard deviation calculations. All data are monthly.
Fixed Income Yields
US fixed income yields reflect Barclays Municipal Bond Index, Barclays US Corporate High Yield Bond Index, Barclays US Corporate Investment-Grade Bond Index, and the ten-year Treasury.
European fixed income yields reflect the BofA Merrill Lynch Euro Corporate AA Bond Index, BofA Merrill Lynch Euro Corporate Bond Index, Barclays Pan-European Aggregate High Yield Bond Index, Bloomberg Twenty-Year European Government Bond Index (nominal), ten-year German bund, 20-year European Inflation Swaps (inflation expectations), and the real yield calculated as the difference between the inflation expectation and nominal yield.
UK sterling fixed income yields reflect the BofA Merrill Lynch Sterling Corporate AA Bond Index, BofA Merrill Lynch Sterling Corporate Bond Index, UK ten-year gilts, and Bank of England 20-year nominal, real, and zero coupon (inflation expectations) yields.