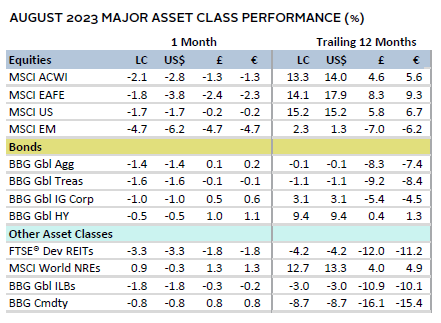
Most asset classes declined in August as higher bond yields and mixed economic signals weighed on risk appetite. Global equities retreated, particularly in emerging markets (EM), where Chinese shares were a significant detractor. Despite the increase in yields, growth equities held up better than value, while small caps lagged large caps. Most fixed income markets sold off as US Treasury yields touched their highest levels in more than 15 years. Real assets were mixed, highlighted by diverging energy and industrial metals prices, with the latter dragged down by weaker Chinese demand. The US dollar broadly advanced on the month, while the euro and UK sterling mostly appreciated as well.
Sources: Bloomberg Index Services Limited, Bloomberg L.P., EPRA, FTSE International Limited, MSCI Inc., National Association of Real Estate Investment Trusts, and Thomson Reuters Datastream. MSCI data provided “as is” without any express or implied warranties.
Note: Local currency returns for the Bloomberg fixed income indexes, the Bloomberg Commodity Index, and the FTSE® Developed REITs are in USD terms.
The Macro Picture
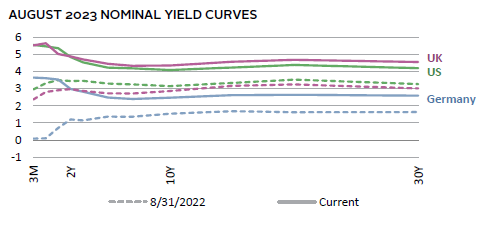
Rising bond yields were a key factor weighing on performance in August. The ten-year US Treasury yield touched 4.34%—its highest level since 2007—and ten-year inflation-adjusted yields rose 25 basis points (bps). Several factors contributed to upward pressure on yields, including hawkish central bank rhetoric, increased US Treasury issuance, reverberations from the Bank of Japan’s (BOJ) policy adjustment, and continued positive surprises for US economic data. In addition, Fitch’s US credit rating downgrade to AA+ weighed on the market and raised the prospect of higher borrowing costs. Central bankers noted that upside risks to inflation warranted a higher-for-longer approach to policy rates, and markets have increasingly priced in the possibility of another Federal Reserve rate hike by year end.
Contrasting economic activity around the globe was another key theme, especially considering the strength in the United States. In China, continued signs of a slowing economy and a disappointing policy response weighed heavily on equities. In addition, fears of contagion from the real estate sector resurfaced as a major property developer and a local asset manager with exposure to the real estate sector struggled to service debt. Sentiment toward the world’s second-largest economy has soured, with foreign investors pulling more than $10 billion out of local equity markets over a short time frame in August. In the euro area and the United Kingdom, Purchasing Managers’ Index (PMI) data suggested that the service sector unexpectedly contracted in August, as overall economic activity in the euro area fell to a 33-month low. The United Kingdom continued to struggle with acute inflationary pressures as CPI and wage data came in hotter than expected.
Equities
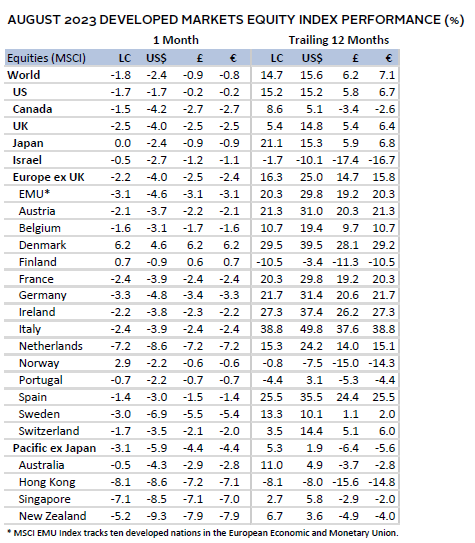
US equities posted their second monthly decline in 2023 and edged developed markets (DM) ex US peers in local currency terms. US shares outperformed by a wider margin in major currency terms as the dollar appreciated and have topped DM ex US counterparts in 2023 with a nearly 19% gain. Information technology had the largest impact on August performance, even though utilities, consumer staples, and materials posted the steepest declines, with the latter dragged down by slumping metals prices. Energy was the only sector that gained, but value still lagged growth. Small caps trailed large caps by more than 3 percentage points (ppts) after outperforming in the prior two months.
Despite relatively resilient US economic data of late, signs of cooling emerged in August. This drove investors to extrapolate less monetary tightening, contributing to a late-month stock rally. Q2 2023 GDP growth was downwardly revised by 30 bps but remained above 2% annualized. Several data releases pointed to a softening labor market, including job openings, which were lower than expected in July and fell to the lowest level since March 2021. Tougher job market conditions contributed to an unexpected drop in consumer confidence, although actual spending data for July remained strong. PMI data suggested that overall activity largely stagnated in August, driven by softness in new orders, output, and a weaker-than-expected expansion in the services sector. Additionally, US inflation was softer than anticipated across both headline and core (ex energy and food) measures. Rates continued to weigh on the housing market, as existing home sales underwhelmed and new mortgage applications fell to their lowest level in almost three decades. Still, tight supply allowed prices to rise and are now just shy of their highs from 2022.
European equities declined on par with broader DM ex US stocks. UK shares lagged Europe ex UK counterparts, as inflation and wage data pointed to further monetary tightening and catalyzed a sharp rise in gilt yields.
Elevated inflation and slumping growth in the euro area continued to pose a challenging backdrop. The pace of consumer price gains held steady at 5.3% year-over-year (YOY), proving more stubborn than anticipated. Although German input prices in July fell at the fastest rate since 2009, the European Central Bank (ECB) is widely expected to lift rates again in September, given the strong labor market, wage growth, and services inflation. Recent PMI data suggest that GDP could contract in Q3, as the composite reading for August remained in contractionary territory for the third consecutive month. Notably, services activity declined for the first time since last December amid ongoing malaise in manufacturing. In addition, consumer confidence fell for the first time since March. Monetary policy has been a contributing factor, with euro area money supply contracting in July for the first time since 2010, as lending activity has slowed.
Similar dynamics weighed on UK equities. The Bank of England (BOE) raised rates by 25 bps to 5.25% as inflation continued to run hotter than in other DM economies. Core inflation held steady at 6.9% YOY in July, and wage growth vastly outpaced expectations, hitting a record at just under 8% YOY. Although Q2 GDP growth topped expectations at 0.2% quarter-over-quarter (QOQ), retail sales fell more than forecast in July, and PMI data suggested overall activity contracted in August, with a surprise decline in services. The BOE is largely expected to hike rates again in September, despite recent data showing that money supply growth has stalled.
Japanese equities topped broader DM shares in August, resuming the recent spate of outperformance in local terms. However, stocks performed on par in USD terms as the yen depreciated 3% to its weakest level versus the US dollar since late 2022. A further widening in rate differentials weighed on the yen, as did BOJ Governor Kazuo Ueda’s comments that underlying inflationary pressures are softening, which suggests no imminent shift away from the ongoing loose monetary policy. Still, one measure of core inflation accelerated to 4.3% YOY in July, a new 40-year high. Calendar Q2 GDP growth widely topped expectations at 6.0% annualized but was bolstered by the weak yen leading to a surge in exports. Both private consumption and imports contracted, and unemployment has ticked higher, suggesting a softening in domestic demand conditions.
Pacific ex Japan equities lagged broader DM and have now underperformed by nearly 15 ppts year-to-date. Hong Kong and Singapore declined the most in August, given their economic linkages with China, and the Hang Seng Index entered a bear market. New Zealand shares also lagged as the Reserve Bank of New Zealand struck a more hawkish tone on the potential future path for rates despite a two-month hiking pause. Amid weak economic momentum—highlighted by another quarterly decline in retail sales in Q2—the government announced plans to cut spending, further weighing on the outlook. In Australia, retail sales bounced back, and the Reserve Bank of Australia held rates steady at 4.10% for a second month as inflation eased more than expected in July. PMI data pointed to contracting business activity in August as the service sector shrank at the fastest pace in 19 months, driven by a decline in new orders.
Sources: MSCI Inc. and Thomson Reuters Datastream. MSCI data provided “as is” without any express or implied warranties.
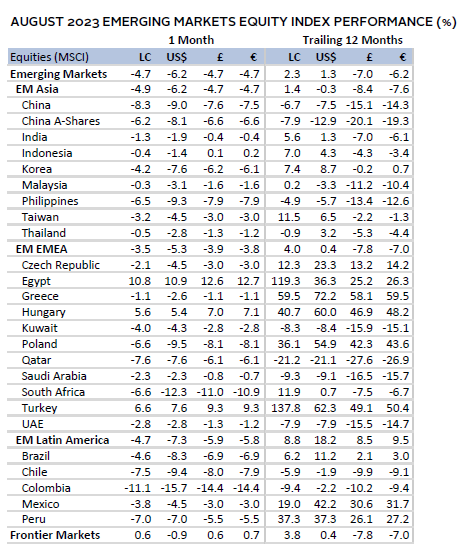
Emerging markets equities lagged DM peers for the sixth month this year, as China accounted for more than 60% of the decline. Most other major EM countries declined as well, with EM ex China performance more on par with the global benchmark. Among major EM regions, Asia lagged, whereas Europe, the Middle East & Africa and Latin America outperformed. The Banco Central do Brasil kicked off its monetary easing cycle with a larger-than-expected 50 bp rate cut, bringing the benchmark selic rate to 13.25%. While the Brazilian economy has generally surprised to the upside this year, PMI data suggested that activity contracted in July. Indian equities were more insulated from the broader equity drawdown. GDP growth topped expectations at 7.8% YOY in calendar Q2, driven by domestic factors, including private consumption and capital investment.
China’s economic woes deepened in August. Consumer prices fell into deflation at -0.3% YOY in July, emblematic of the weaker domestic demand conditions. A slew of other data painted a weak picture as well. Against this backdrop, the United States announced a long-awaited executive order limiting investment in targeted Chinese industries, such as semiconductors, microelectronics, artificial intelligence, and quantum computing. Weak sentiment also drove foreign direct investment in Q2 2023 to its lowest quarterly total on record since the late 1990s (less than $5 billion), and the yuan depreciated to one of its weakest levels since 2007. Although authorities introduced new policy support measures geared toward housing and driving local investors into the stock market, any positive market reaction proved short-lived. The People’s Bank of China did cut key interest rates, but the overall extent of the stimulus underwhelmed the market.
Sources: MSCI Inc. and Thomson Reuters Datastream. MSCI data provided “as is” without any express or implied warranties.
Fixed Income
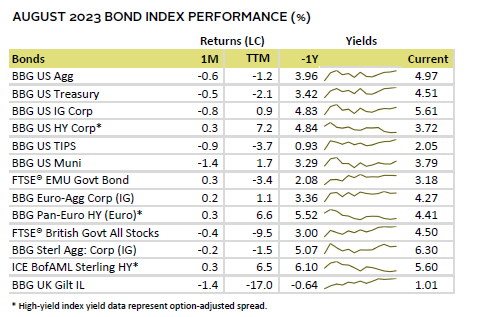
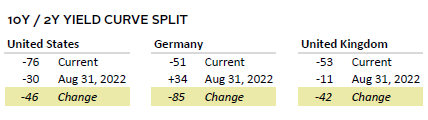
Most US fixed income assets ended lower in August as yields climbed. High-yield corporates were the exception, having outperformed broader investment-grade bonds by a wide margin over the past year. Credit spreads widened modestly for the month but remain well below median levels. Five- and ten-year US Treasury yields rose 5 bps and 12 bps to 4.23% and 4.09%, respectively. Despite the overall upward trajectory, the ten-year yield ended the month 25 bps lower than its peak levels hit in mid-August, as some signs of economic cooling emerged late in the month. The move higher was precipitated by rising real yields, with the ten-year US TIPS yield up 25 bps to 1.85%, which marked the highest month-end closing level since 2009.
Performance among UK and euro area government bonds diverged. Markets placed more weight on inflationary pressures in the United Kingdom driving yields higher, whereas economic concerns limited upward movement for core European bonds. Specifically, ten-year UK gilts rose 14 bps to 4.36%, whereas German yields were unchanged at 2.47%. Still, as in the United States, these closing values were lower than their intra-month peaks. Within both segments, high-yield corporates posted among the top returns, while UK linkers continued to lag.
Sources: Bank of England, Bloomberg Index Services Limited, Federal Reserve, FTSE Fixed Income LLC, FTSE International Limited, Intercontinental Exchange, Inc., and Thomson Reuters Datastream.
Real Assets
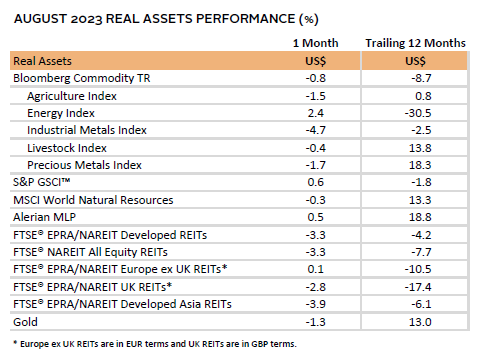
Real assets mostly declined in August as softening economic data, higher yields, and a stronger US dollar weighed on performance. Commodity futures were mixed. Industrial metals were buffeted by waning Chinese economic data, whereas energy commodities gained on tighter supply/demand dynamics.
Oil prices ($86.86 for Brent and $83.63 for WTI) were up roughly 2% on the month. While weaker economic performance out of China warranted lower prices, supply remained tight on the back of recent OPEC+ production cuts, and Saudi Arabia is widely expected to extend its voluntary cuts of 1 million barrels/day. Among other energy commodities, natural gas prices advanced, particularly in Europe, as a potential strike at a large Australian liquefied natural gas producer threatened to constrain global supplies.
Natural resources equities slightly declined in USD terms on the month, as gains for energy equities were offset by declines in the materials sector.
REITs mostly declined amid the rising yield environment in August. Europe ex UK REITs were the lone exception, trading flat for the month, as bond yield levels were held in check relative to other developed counterparts.
Gold prices declined to $1,942.45/troy ounce. The inverse correlation between gold prices and real yields reasserted itself during the month, and a stronger US dollar also weighed on the yellow metal.
Sources: Alerian, Bloomberg L.P., EPRA, FTSE International Limited, Intercontinental Exchange, Inc., MSCI Inc., National Association of Real Estate Investment Trusts, Standard & Poor’s, and Thomson Reuters Datastream. MSCI data provided “as is” without any express or implied warranties.
Note: Gold performance based on spot price return.
USD-Based Investors
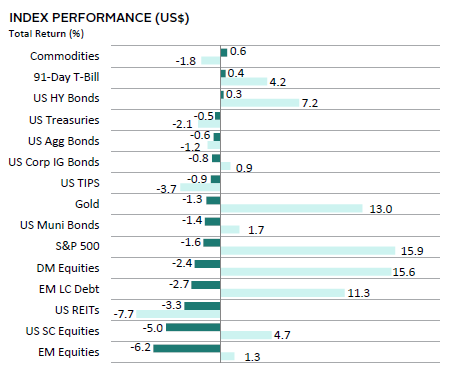
Risk assets sold off in August as higher yields and signs of slowing growth sapped risk appetite. EM equities and US small caps posted the steepest declines, while US large caps held up the best among major stock market categories. Most fixed income assets declined, save for high-yield corporate bonds, as less liquid segments of the market—including TIPS and munis—declined the most. Real assets performance was mixed: REITs tracked broader equities lower, gold prices declined, but commodities got a lift from stronger energy prices.
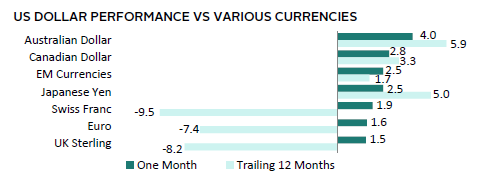
The US dollar advanced broadly, reflecting higher US interest rates and the risk off mood. The greenback gained the most versus the Australian and Canadian dollars and a basket of EM currencies. Performance was more mixed on a trailing 12-month view.
Signs of economic cooling emerged in August. Q2 2023 GDP growth was downwardly revised by 30 bps but remained above 2% annualized. Several data releases pointed to a softening labor market, including job openings, which were lower than expected in July and fell to the lowest level since March 2021. Tougher job market conditions contributed to an unexpected drop in consumer confidence, although actual spending data remained strong. PMI data suggested that overall activity largely stagnated in August, driven by softness in new orders, output, and a weaker-than-expected expansion in the services sector. US inflation was softer than anticipated across both headline and core (ex energy and food) measures. Existing home sales underwhelmed and new mortgage applications fell to their lowest in almost three decades. Still, tight supply allowed prices to rise in July.
Sources: Bloomberg Index Services Limited, FTSE International Limited, Frank Russell Company, Intercontinental Exchange, Inc., J.P. Morgan Securities, Inc., MSCI Inc., National Association of Real Estate Investment Trusts, Standard & Poor’s, and Thomson Reuters Datastream. MSCI data provided “as is” without any express or implied warranties.
EUR-Based Investors
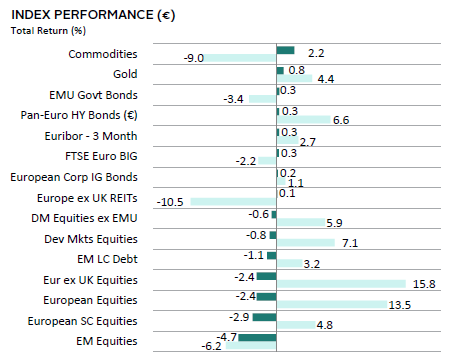
Performance was generally weak in August as higher yields and signs of slowing growth sapped risk appetite. EM equities and European small caps posted the steepest declines, DM shares held up the best among major stock market categories. Fixed income posted muted gains as core euro area bond yields ended the month little-changed. Real assets performance was mixed: REITs were flat, whereas gold prices and commodities advanced, the latter receiving a lift from stronger energy prices.
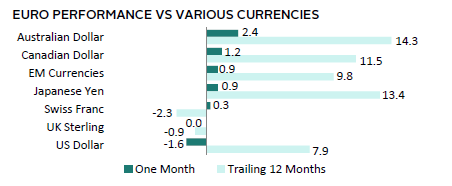
The euro generally appreciated, gaining the most vis-à-vis the Australian and Canadian dollars and a basket of EM currencies. The common currency traded flat versus the UK sterling and weakened against the broadly stronger US dollar. The euro has gained in value against most other currencies over the past year.
Elevated inflation and slumping growth in the euro area continued to pose a challenging backdrop. The pace of consumer price gains held steady at 5.3% YOY, proving more stubborn than anticipated. Although German input prices fell at the fastest rate since 2009 in July, the ECB is widely expected to lift rates again in September, given the strong labor market, wage growth, and services inflation. Recent PMI data suggest that GDP could contract in Q3, as the composite reading for August remained in contractionary territory for the third consecutive month. Notably, services activity declined for the first time since last December amid ongoing malaise in manufacturing. In addition, consumer confidence fell for the first time since March. Monetary policy has been a contributing factor, with euro area money supply contracting in July for the first time since 2010 as lending activity has slowed.
Sources: Bloomberg Index Services Limited, EPRA, European Banking Federation, FTSE Fixed Income LLC, FTSE International Limited, Intercontinental Exchange, Inc., J.P. Morgan Securities, Inc., MSCI Inc., National Association of Real Estate Investment Trusts, Standard & Poor’s, and Thomson Reuters Datastream. MSCI data provided “as is” without any express or implied warranties.
GBP-Based Investors
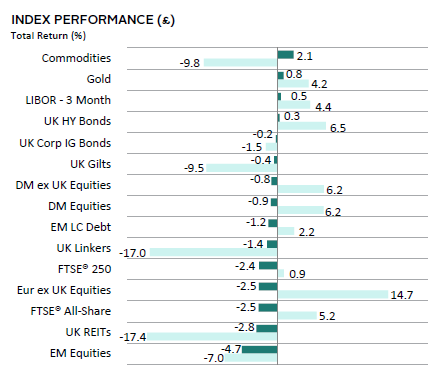
Performance was generally weak in August as higher yields and signs of slowing growth sapped risk appetite. EM equities posted the steepest declines, and UK stocks lagged their developed market counterparts. Mid-caps outperformed within the UK equity market. Most fixed income assets declined, save for high-yield corporate bonds, as UK linkers sold off the most. Real assets performance was mixed: REITs tracked broader equities lower, but gold prices and commodities advanced, with the latter receiving a lift from stronger energy prices.
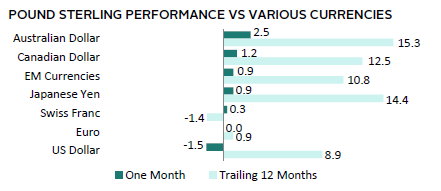
UK sterling generally appreciated on the month, gaining the most versus the Australian and Canadian dollars and a basket of EM currencies. The pound was flat vis-à-vis the euro and declined against the US dollar. Sterling mostly gained in value over the trailing 12-month period.
Persistent inflationary pressures and signs of slowing growth weighed on performance. The BOE raised rates by 25 bps to 5.25% as inflation continued to run hotter than in other DM economies. Core inflation held steady at 6.9% YOY in July, and wage growth vastly outpaced expectations, hitting a record at just under 8% YOY. Although Q2 GDP growth topped expectations at 0.2% QOQ, retail sales fell more than forecast in July and PMI data suggested overall activity contracted in August, with a surprise decline in services. The BOE is largely expected to hike rates again in September, despite recent data showing that money supply growth has stalled.
Sources: Bloomberg Index Services Limited, EPRA, FTSE International Limited, Intercontinental Exchange, Inc., J.P. Morgan Securities, Inc., MSCI Inc., National Association of Real Estate Investment Trusts, Standard & Poor’s, and Thomson Reuters Datastream. MSCI data provided “as is” without any express or implied warranties.
Performance Exhibits
All data are total returns unless otherwise noted. Total return data for all MSCI indexes are net of dividend taxes.
USD-Based Investors index performance chart includes performance for the Bloomberg US Aggregate Bond, Bloomberg US Corporate Investment Grade, Bloomberg US High Yield Bond, Bloomberg Municipal Bond, Bloomberg US TIPS, Bloomberg US Treasuries, ICE BofAML 91-Day Treasury Bills, FTSE® NAREIT All Equity REITs, J.P. Morgan GBI-EM Global Diversified, LBMA Gold Price, MSCI Emerging Markets, MSCI World, Russell 2000®, S&P 500, and S&P GSCI™ indexes.
EUR-Based Investors index performance chart includes performance for the Bloomberg Euro-Aggregate: Corporate, Bloomberg Pan-Euro High Yield (Euro), EURIBOR 3M, FTSE EMU Govt Bonds, FTSE Euro Broad Investment-Grade Bonds, FTSE® EPRA/NAREIT Europe ex UK RE, J.P. Morgan GBI-EM Global Diversified, LBMA Gold Price AM, MSCI Emerging Markets, MSCI Europe, MSCI Europe ex UK, MSCI Europe Small-Cap, MSCI World ex EMU, MSCI World, and S&P GSCI™ indexes.
GBP-Based Investors index performance chart includes performance for the Bloomberg Sterling Aggregate: Corporate Bond, Bloomberg Sterling Index-Linked Gilts, ICE BofAML Sterling High Yield, FTSE® 250, FTSE® All-Share, FTSE® British Government All Stocks, FTSE® EPRA/NAREIT UK RE, J.P. Morgan GBI-EM Global Diversified, LBMA Gold Price AM, LIBOR 3M GBP, MSCI Emerging Markets, MSCI Europe ex UK, MSCI World, MSCI World ex UK, and S&P GSCI™ indexes.
EM currencies is an equal-weighted basket of 20 emerging markets currencies.
Fixed Income Performance Table
Performance data for US TIPS reflect the Bloomberg US TIPS Index, with yields represented by the Bloomberg Global Inflation Linked Bond Index: US.