Risk-on sentiment returned in August as the global economic recovery continued, albeit at a slowing pace. Global equities again reached new all-time highs, posting strong gains, driven by US and Japanese stocks. Developed equities outgained emerging markets peers, although emerging markets edged developed ex US. Growth topped value, while large caps bested small caps for the sixth consecutive month. Global fixed income securities turned lower as government bonds and investment-grade corporates declined in sync on an aggregate basis; however, riskier high-yield bonds advanced for a fifth consecutive month. Real assets also mostly weakened as REITs were the only major asset class to advance. Among major currencies, the US dollar broadly advanced, the euro was mixed, and UK sterling mostly declined.

AUGUST 2021 MAJOR ASSET CLASS PERFORMANCE (%)
Sources: Bloomberg Index Services Limited, Bloomberg L.P., EPRA, FTSE International Limited, MSCI Inc., National Association of Real Estate Investment Trusts, and Thomson Reuters Datastream. MSCI data provided “as is” without any express or implied warranties.
Note: Local currency returns for the Bloomberg fixed income indexes, the Bloomberg Commodity Index, and the FTSE® Developed REITs are in USD terms.
The Macro Picture
The global economic recovery chugged along, despite some signs that momentum was fading amid disruptions from the resurgence of COVID-19. According to a Citigroup aggregated economic surprise index, US and global data releases are missing consensus forecasts at an increasing pace. And while some countries continue to ease restrictions, particularly across Europe, other major economies—including Japan, Australia, and the United States—are facing new and ongoing containment measures.
Beyond COVID, other risks are within view. Inflation continued to increase across Europe, reaching decade-plus highs amid global supply chain challenges and labor shortages. The so-called China tech crackdown shows no signs of abating as Beijing released a slew of new laws and regulations that are expected to last for years. Further, two of the world’s four largest economies—Japan and Germany—are set for national elections in the coming months, which could give way to at least some degree of regime change and potentially major policy shifts.
Still, corporate earnings continue to set records, and economic data remain strong relative to history. PMI data, though slowing, broadly remain well in expansionary territory, and global central banks feel comfortable enough about the economic situation to be outwardly discussing asset purchase tapering. While the global economic recovery may be cooling, data remained generally robust and risk assets continued to deliver exceptional returns.
Equities
US equities advanced for the seventh straight month, outgaining their developed ex US and emerging markets equivalents, and again reaching new all-time highs throughout the month. Ten of 11 S&P 500 Index sectors gained, led by financials, communication services, and utilities. Industrials and consumer staples gained the least, while energy declined. Growth topped value, and large caps bested small caps for the sixth consecutive month. Of S&P 500 companies, 99% have reported second quarter earnings, indicating a year-over-year earnings per share (EPS) growth rate of 91%—nearly 30 percentage points (ppts) above expectations on June 30. Revenues grew 25% with 88% of companies posting a positive surprise, setting a record since FactSet began tracking data in 2008.
High frequency US economic data remained robust, but momentum showed signs of fading. Preliminary services and manufacturing PMIs fell from elevated levels, ADP employment data showed only a modest pickup in hiring, and indexes of consumer confidence plunged on Delta variant fears—all of which came in well below consensus expectations. GDP growth was revised higher, but by less than expected, to a quarter-on-quarter annualized rate of 6.6% in second quarter. Inflation moderated on a month-over-month basis in July, seemingly aligning with the Federal Reserve’s “transitory” view, but it remains elevated relative to recent history. At the July Fed meeting, most participants judged that it could be appropriate to reduce the pace of asset purchases later this year. Chairman Jerome Powell later reaffirmed this view but noted that asset purchase tapering will not provide a direct signal about the timing of future rate hikes.
European equities gained but underperformed broader developed markets for the third consecutive month. Europe ex UK topped UK counterparts for the sixth time in the last seven months. European corporate earnings growth accelerated 71% year-over-year, boosted by the strong rebound in the energy sector.
Eurozone economic data releases remained strong, but momentum cooled in August. Preliminary composite PMI declined slightly from July’s 15-year high level but remained firmly in expansionary territory. Employment grew at a 21-year high rate again in August, although economic and consumer confidence declined more than expected. Supply chain disruptions have created significantly higher costs for businesses, contributing to a decade-high 3.0% year-over-year rise in Eurozone inflation. In Germany, inflation rose at its highest level in 13 years. Federal elections in late September will determine who succeeds outgoing Chancellor Angela Merkel, who has been at the helm of the Eurozone’s largest economy for 16 years.
In the United Kingdom, composite PMI fell to a six-month low in August, undershooting analyst expectations. The decline largely resulted from supply chain disruptions and staff shortages—the latter of which some economists attribute to smaller pools of cheap labor due to Brexit. However, inflation decelerated more than expected in July. The official preliminary second quarter GDP estimate indicated the UK economy returned to growth, expanding 4.8% quarter-over-quarter, in line with analyst expectations.
Japanese equities advanced in August, topping other major developed countries and regions; however, Japanese stocks are still the bottom performer year-to-date. Japan’s economy grew at an annualized rate of 1.3% in calendar second quarter 2021, rebounding from a decline in the prior quarter. Still, the country continues to grapple with a resurgence in COVID-19 infections, which has dampened the prospects for a robust recovery. Prime Minister Yoshihide Suga’s approval rating reached a new low in August, falling below 30% for the first time and increasing the likelihood of a general election in October.
Pacific ex Japan equities advanced in August but trailed broader developed markets for the sixth time in the last seven months and were the bottom performer among major developed countries and regions. Hong Kong equities declined for the third consecutive month. Moreover, the Hang Seng Index dipped into bear market territory, having declined more than 20% intramonth since its February peak as China’s ongoing tech crackdown continued to weigh on index performance. The Reserve Bank of New Zealand opted not to raise interest rates, citing a timing issue because the country entered a new COVID-19–related lockdown on the date of the rate decision. However, the central bank appears primed to embark on a rate tightening cycle in subsequent meetings. Similarly, the Reserve Bank of Australia unexpectedly decided early in the month to stick with its plan to taper its bond buying program starting in September, though the ongoing COVID-19 surge and lockdowns could raise the chances that they opt to delay.

AUGUST 2021 DEVELOPED MARKETS EQUITY INDEX PERFORMANCE (%)
Sources: MSCI Inc. and Thomson Reuters Datastream. MSCI data provided “as is” without any express or implied warranties.
Emerging markets equities advanced but trailed developed markets peers for the sixth time since January, bringing year-to-date underperformance to 15.6 ppts. However, emerging stocks topped developed equivalents in major currency terms in August due to strong currency appreciation. Most countries in the index advanced but a few of the largest emerging economies declined, including Brazil, Korea, and South Africa. Market heavyweight China was flat as the ongoing tech crackdown weighed on returns, while other major emerging economies India and Taiwan advanced. Among emerging regions, emerging Europe, the Middle East & Africa outperformed, heavily weighted emerging Asia was relatively even with the broad index, and Latin America lagged.
Chinese stocks remained volatile in August as domestic regulators announced a slew of new rules throughout the month. Among the major announcements included increased scrutiny of the online insurance sector, rules surrounding the collection and dissemination of data by tech firms, and enforceable curbs on the amount of time children can play video games. China’s State Council and the Chinese Communist Party’s Central Committee released a joint document indicating that authorities plan to continue to actively work on new laws and regulations across Chinese industries through at least 2025. The announcement mostly impacted offshore-listed Chinese equities and “consumer tech” names, which are mostly concentrated in the MSCI EM Index. While the crackdown contributed to investment outflows from offshore Chinese listed stocks, domestic A-shares, which are underweight tech, have seen a steady rise of inflows.

AUGUST 2021 EMERGING MARKETS EQUITY INDEX PERFORMANCE (%)
Sources: MSCI Inc. and Thomson Reuters Datastream. MSCI data provided “as is” without any express or implied warranties.
Fixed Income
US fixed income mostly declined in August as yields rose off multi-month lows. Treasuries declined less than investment-grade corporates, while high-yield equivalents were the only major US bond category to advance. Five- and ten-year Treasury yields gained 8 basis points (bps) and 6 bps to 0.77% and 1.30%, respectively. Longer-term 30-year Treasury yields advanced 3 bps to 1.92%. The ten-year/two-year Treasury yield curve spread steepened 5 bps to 110 bps. TIPS performance matched nominal Treasuries and ten-year breakeven inflation declined 7 bps to 2.33%. Tax-exempt municipal bonds were the bottom performer, trailing domestic Treasuries.
UK and Eurozone bonds followed a similar pattern as the United States, with investment-grade bonds declining and high-yield peers advancing; however, government trailed investment-grade corporates in both the United Kingdom and the Eurozone. UK linkers gained, topping nominal gilts. Five- and ten-year gilt yields rose 6 bps each to 0.35% and 0.71%, respectively. Ten-year German bund yields advanced 8 bps to -0.38%.
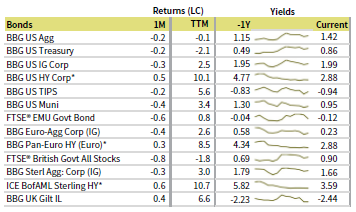
AUGUST 2021 BOND INDEX PERFORMANCE (%)

AUGUST 2021 NOMINAL YIELD CURVES

10Y/2Y YIELD CURVE SPLIT
Sources: Bank of England, Bloomberg Index Services Limited, BofA Merrill Lynch, Federal Reserve, FTSE Fixed Income LLC, FTSE International Limited, Intercontinental Exchange, Inc., and Thomson Reuters Datastream.
Real Assets
Commodity futures declined in August, dragged down by energy and precious metals as the near-term economic outlook stumbled amid rising Delta variant COVID-19 cases.
Brent ($72.99) and WTI ($68.50) oil prices declined 4.4% and 7.4%, respectively, but both rebounded off 15% declines mid-month. In mid-August, multiple forecasters revised 2021 and 2022 oil demand forecasts downward amid Delta variant concerns. By early September, OPEC+ members decided to continue with their July agreement to increase production by 400,000 bpd each month. Hurricane Ida made landfall in late August into the heart of the US energy industry, which accounts for about one-fifth of the US’s refinery capacity; however, oil prices were little affected as damage from the storm appeared minimal for the multiple refineries being temporarily shuttered.
Global natural resources equities and energy MLPs declined. Despite the decline, both remain firmly positive over the last year, with the Alerian MLP Index leading all real assets with a return of 55% over the last 12 months.
Global developed REITs advanced in July, led by UK REITs, Europe ex UK REITs, and US REITs; developed Asia REITs declined.
Gold prices declined to $1,806.30/troy ounce as market risk-on sentiment prevailed despite rising COVID-19 cases across major global economies and signs of declining economic sentiment. The yellow metal’s performance remains negative over the trailing 12-month period—making it the only major real asset to decline over that period.

AUGUST 2021 REAL ASSETS PERFORMANCE (%)
* Europe ex UK REITs are in EUR terms and UK REITs are in GBP terms.
Sources: Alerian, Bloomberg L.P., EPRA, FTSE International Limited, Intercontinental Exchange, Inc., MSCI Inc., National Association of Real Estate Investment Trusts, Standard & Poor’s, and Thomson Reuters Datastream. MSCI data provided “as is” without any express or implied warranties.
Note: Gold performance based on spot price return.
USD-Based Investors
Risk-on sentiment returned in August as the global economic recovery continued, albeit at a slowing pace. Equities were top performers, led by US stocks. US large caps bested small caps, while emerging markets edged developed peers, boosted by the US dollar weakening versus EM currencies. US high-yield bonds advanced, besting investment-grade equivalents. US Treasuries edged investment-grade corporates, although both declined. US REITs gained and led all major real asset classes, as commodities and gold declined the most.
The US dollar broadly strengthened in August, advancing the most versus the Canadian dollar, Swiss franc, and UK sterling, and falling only vis-à-vis our EM currency basket. The greenback was more mixed over the past year, declining the most against the Canadian dollar and UK sterling, while gaining the most vis-à-vis the Japanese yen and Swiss franc.
S&P 500 EPS grew at a year-on-year rate of 91% in second quarter—nearly 30 ppts above expectations on June 30. High frequency US economic data remained robust, but momentum showed signs of fading. Preliminary services and manufacturing PMIs fell from elevated levels, ADP employment data showed only a modest pickup in hiring, and indexes of consumer confidence plunged on Delta variant fears—all of which came in well below consensus expectations. Inflation moderated on a month-over-month basis in July, seemingly aligning with the Fed’s “transitory” view, but it remains elevated relative to recent history. At the July Fed meeting, most participants judged that it could be appropriate to reduce the pace of asset purchases later this year. Chairman Powell later reaffirmed this view but noted that asset purchase tapering will not provide a direct signal about the timing of future rate hikes.
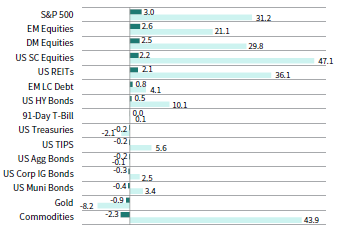
INDEX PERFORMANCE (US$)

US DOLLAR PERFORMANCE VS VARIOUS CURRENCIES
Sources: Bloomberg Index Services Limited, FTSE International Limited, Frank Russell Company, Intercontinental Exchange, Inc., J.P. Morgan Securities, Inc., MSCI Inc., National Association of Real Estate Investment Trusts, Standard & Poor’s, and Thomson Reuters Datastream. MSCI data provided “as is” without any express or implied warranties.
EUR-Based Investors
Risk-on sentiment returned in August as the global economic recovery continued, albeit at a slowing pace. Equities were top performers led by European small-cap stocks. European small caps bested large caps, while emerging markets edged developed peers, boosted by the euro weakening versus EM currencies. Pan-Euro high-yield bonds advanced, besting investment-grade equivalents. EMU government bonds trailed investment-grade corporate peers, although both declined. Europe ex UK REITs gained and led all major real asset classes, as commodities declined the most.
The euro was mixed in August, advancing the most versus the Canadian dollar, Swiss franc, and UK sterling, and falling vis-à-vis our basket of EM currencies, the US dollar, and the Japanese yen. The common currency mostly declined over the past year, falling the most versus the Canadian dollar, UK sterling, and EM currencies, while advancing vis-à-vis only the safe-havens Japanese yen and Swiss franc.
Eurozone economic data releases remained strong, but momentum cooled in August. Preliminary composite PMI declined slightly from July’s 15-year high level but remained firmly in expansionary territory. Employment grew at a 21-year high rate again in August, although economic and consumer confidence declined more than expected. Supply chain disruptions have created significantly higher costs for businesses, contributing to a decade-high 3.0% year-on-year rise in Eurozone inflation. In Germany, inflation rose at its highest level in 13 years. Federal elections in late September will determine who succeeds outgoing Chancellor Angela Merkel, who has been at the helm of the Eurozone’s largest economy for 16 years.
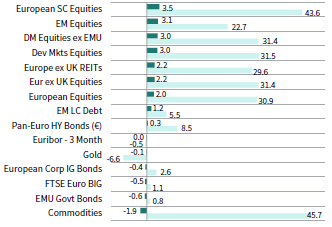
INDEX PERFORMANCE (€)
EURO PERFROMANCE VS VARIOUS CURRENCIES
Sources: Bloomberg Index Services Limited, EPRA, European Banking Federation, FTSE Fixed Income LLC, FTSE International Limited, Intercontinental Exchange, Inc., J.P. Morgan Securities, Inc., MSCI Inc., National Association of Real Estate Investment Trusts, Standard & Poor’s, and Thomson Reuters Datastream. MSCI data provided “as is” without any express or implied warranties.
GBP-Based Investors
Risk-on sentiment returned in August as the global economic recovery continued, albeit at a slowing pace. Equities were top performers led by UK mid-cap stocks. UK mid-caps bested large caps, while emerging markets edged developed peers, boosted by UK sterling weakening versus EM currencies. UK high-yield bonds advanced, besting investment-grade equivalents. UK gilts trailed investment-grade corporate peers, although both declined. UK REITs were also a top performer, gaining and leading all major real asset classes, as commodities declined the most.
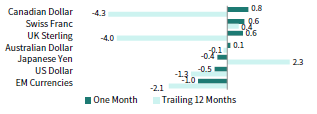
UK sterling mostly declined in August, falling the most versus our basket of EM currencies, the US dollar, and the Japanese yen, and gaining minimally vis-à-vis the Canadian dollar and Swiss franc. Over the past 12 months, sterling is mostly positive, gaining the most versus the Japanese yen, Swiss franc, euro, and Australian dollar, and declining only vis-à-vis the Canadian dollar.
UK composite PMI fell to a six-month low in August, undershooting analyst expectations. The decline largely resulted from supply chain disruptions and staff shortages—the latter of which some economists attribute to smaller pools of cheap labor due to Brexit. However, inflation decelerated more than expected in July. The official preliminary estimate of second quarter GDP indicated the UK economy returned to growth, expanding 4.8% quarter-over-quarter, in line with analyst expectations.

INDEX PERFORMANCE (£)

POUND STERLING PERFORMANCE VS VARIOUS CURRENCIES
Sources: Bloomberg Index Services Limited, EPRA, FTSE International Limited, Intercontinental Exchange, Inc., ICE Benchmark Administration Ltd., J.P. Morgan Securities, Inc., MSCI Inc., National Association of Real Estate Investment Trusts, Standard & Poor’s, and Thomson Reuters Datastream. MSCI data provided “as is” without any express or implied warranties.
Performance Exhibits
All data are total returns unless otherwise noted. Total return data for all MSCI indexes are net of dividend taxes.
USD-Based Investors index performance chart includes performance for the Bloomberg US Aggregate Bond, Bloomberg US Corporate Investment Grade, Bloomberg US High Yield Bond, Bloomberg Municipal Bond, Bloomberg US TIPS, Bloomberg US Treasuries, ICE BofAML 91-Day Treasury Bills, FTSE® NAREIT All Equity REITs, J.P. Morgan GBI-EM Global Diversified, LBMA Gold Price, MSCI Emerging Markets, MSCI World, Russell 2000®, S&P 500, and S&P GSCI™ indexes.
EUR-Based Investors index performance chart includes performance for the Bloomberg Euro-Aggregate: Corporate, Bloomberg Pan-Euro High Yield (Euro), EURIBOR 3M, FTSE EMU Govt Bonds, FTSE Euro Broad Investment-Grade Bonds, FTSE® EPRA/NAREIT Europe ex UK RE, J.P. Morgan GBI-EM Global Diversified, LBMA Gold Price AM, MSCI Emerging Markets, MSCI Europe, MSCI Europe ex UK, MSCI Europe Small-Cap, MSCI World ex EMU, MSCI World, and S&P GSCI™ indexes.
GBP-Based Investors index performance chart includes performance for the Bloomberg Sterling Aggregate: Corporate Bond, Bloomberg Sterling Index-Linked Gilts, ICE BofAML Sterling High Yield, FTSE® 250, FTSE® All-Share, FTSE® British Government All Stocks, FTSE® EPRA/NAREIT UK RE, J.P. Morgan GBI-EM Global Diversified, LBMA Gold Price AM, LIBOR 3M GBP, MSCI Emerging Markets, MSCI Europe ex UK, MSCI World, MSCI World ex UK, and S&P GSCI™ indexes.
EM currencies is an equal-weighted basket of 20 emerging markets currencies.
Fixed Income Performance Table
Performance data for US TIPS reflect the Bloomberg US TIPS Index, with yields represented by the Bloomberg Global Inflation Linked Bond Index: US.