Global equities surged higher in August. Developed markets equities, which notched their best August since 1986, outperformed emerging markets equivalents. Global growth stocks trounced value—a theme that has been persistent throughout 2020—while large caps bested small caps. High-yield bonds bested investment-grade corporates and sovereigns. Real assets mostly advanced, led by commodities as energy prices climbed; REITs advanced and gold prices ticked slightly lower. The US dollar declined against most major currencies, UK sterling mostly strengthened, and euro performance was mixed.

AUGUST 2020 MAJOR ASSET CLASS PERFORMANCE (%)
Sources: Bloomberg Index Services Limited, Bloomberg L.P., FTSE International Limited, MSCI Inc., and Thomson Reuters Datastream. MSCI data provided “as is” without any express or implied warranties.
Note: Local currency returns for the Bloomberg Barclays indexes, the Bloomberg Commodity Index, and the FTSE® Developed REITs are in USD terms.
The Macro Picture
The extraordinary risk rally continued, fueled by central bank stimulus, positive economic surprise momentum, and optimism surrounding progress towards a coronavirus vaccine. Historic changes to the US Federal Reserve’s monetary policy framework signaled that rates could stay low for a long time. The central bank will target an average inflation rate of 2% over time, indicating that inflation will be allowed to run moderately higher than this level in certain periods. In addition, the Fed also noted that it will only respond to “shortfalls” of employment, rather than “deviations,” meaning that it will be less inclined to raise rates in response to concerns about the labor market overheating.
Earnings and certain economic data also helped boost risk appetite throughout the month. Second quarter earnings results in most regions were stronger than initially expected, with many companies revising guidance higher. While economic data vary by region, broad global measures suggest that economic readings continue to beat expectations, despite the extraordinary challenges in the current environment. The COVID-19 pandemic continues to cast a cloud over the global economy, with more than 25 million cases globally. Cases had begun trending lower again in the United States, but fears of a second wave resurged in Europe, as France, Germany, Italy, and Spain all saw upticks in new daily cases. Yet, despite these grim statistics, better treatment options have helped to reduce pressures on global healthcare systems. The coronavirus outlook is highly uncertain, but the progress of worldwide efforts to create a vaccine at an unprecedented speed will continue to be one of the most important determinants of market sentiment moving forward.
Equities
US equities outgained their developed ex US counterparts, extending their year-to-date outperformance to 19 percentage points (ppts). The S&P 500 Index has now retraced its entire peak-to-trough drawdown, gaining 57.7% since the March 23 low and reaching new all-time highs. Nine of 11 S&P 500 sectors advanced, led by information technology, which posted a double-digit gain for the month. Consumer discretionary and communication services also surged, while utilities and energy were the only two sectors to decline. Large caps and growth stocks bested small caps and value equivalents, respectively. Year-to-date, large caps have topped small caps by 16 ppts, while growth outperformed value by a staggering 43 ppts, the widest margin since data began in 1975. Nearly all S&P 500 companies have reported second quarter earnings, with blended earnings growth estimated to have declined 31% year-over-year. While this decline reflects the largest year-over-year fall since first quarter 2009, it was significantly better than initial expectations. 84% of companies beat earnings per share (EPS) estimates, the highest percentage since FactSet began tracking the metric in 2008.
US second quarter GDP declined at a 31.7% annualized rate, better than initially expected, but still the biggest quarterly plunge on record. Manufacturing continued to gain momentum as August PMI data were better-than-expected and July readings of new orders for nondefense capital goods, excluding aircrafts, increased to just below pre-crisis levels. However, US consumer confidence plunged in August due to fears about rising COVID-19 cases and the failure of policymakers to extend enhanced unemployment benefits. The US job market continued its sluggish recovery; initial US jobless claims and continuing claims improved but remain well above levels reached during the peak of the Global Financial Crisis.
European equities trailed broader developed markets stocks for the fifth time in the past six months, increasing year-to-date underperformance versus developed ex Europe shares to more than 18 ppts. Europe ex UK stocks continued their dominance over UK equities, although both remain firmly negative year-to-date. Most Stoxx 600 companies have reported second quarter earnings, indicating overall year-on-year EPS growth of -26%, mildly worse than prior expectations.
The European Central Bank (ECB) reported no change to its second preliminary reading of its second quarter Eurozone GDP estimate at -12.1% (-40.3% annualized). The euro area recorded its second consecutive expansionary manufacturing PMI reading in August—and only its second positive PMI reading since mid-2018—as output and new orders both rose at considerable rates. Yet, preliminary services PMI were barely expansionary, and both manufacturing and services readings were lower than anticipated. Headline consumer price inflation slipped into deflationary territory in August with a preliminary reading of -0.2% year-on-year, boosting widespread speculation that the ECB will lower its inflation forecast further below the 2% target at its September 10 meeting.
The United Kingdom experienced the deepest contraction among G7 countries in second quarter, with a preliminary GDP growth estimate of -20.4% (-59.9% annualized), its largest decline since comparable data began in 1955. Notably, private consumption and fixed capital each declined about 25%. Retail sales unexpectedly advanced in July, while PMI readings indicated better-than-expected expansion of both manufacturing and services output. The Bank of England (BOE) left its benchmark policy rate unchanged early in the month, later stating it plans to leave monetary policy loose until inflation sustainably returns to target.
Japanese equities topped other major developed markets in both local and major currency terms, despite broad yen weakness. With most companies reported, second quarter year-on-year TOPIX EPS growth sits at -15%, roughly in line with earlier estimates. Japan’s second calendar quarter GDP fell at a 27.8% annualized rate, the sharpest contraction on record; still, the decline was less severe than US or European counterparts. The contraction marked the country’s third consecutive quarterly GDP decline, which began in part as a result of the increased national sales tax to 10% from 8% that went into effect on October 1, 2019. Japan’s longest-serving Prime Minister, Shinzo Abe, announced he would be imminently stepping down due to health concerns. Japan’s ruling Liberal Democratic Party set a rapid timetable, planning to select and vote on Abe’s replacement by mid-September.
Emerging markets equities advanced but trailed developed peers. In local and major currency terms, heavily weighted emerging Asia outgained the broader index, while emerging Europe, the Middle East & Africa, and Latin America lagged. Among major emerging markets countries, China outperformed the broader index, India and Korea advanced but trailed broad emerging markets, while Taiwan, South Africa, and Brazil declined. Emerging markets experienced a third consecutive month of positive net equity investment inflows, led by India and underpinned by a weaker dollar and loose US monetary policy. Frontier markets bested developed and emerging counterparts as Kuwait and Vietnam, which constitute more than half of the index, each advanced about 8%.
China’s economy continued to show signs of recovery in August. Official Non-Manufacturing PMI readings reached their strongest levels since 2018, while manufacturing data fell slightly from July but remained in expansionary territory. Still, production continues to outpace demand, creating challenges for a sustained recovery. Another challenge is that the ongoing tensions between the United States and China escalated in August. During the month, the Trump administration took steps to shore up what it deems to be unfair business practices and national security threats from Chinese companies. The United States also issued sanctions against 11 senior Chinese and Hong Kong officials over Hong Kong policy—including the territory’s Beijing-appointed chief executive Carrie Lam—setting off retaliatory sanctions from China. US health secretary Alex Azar made a controversial visit to Taiwan, which China views as a province of the mainland, drawing a sharp rebuke from Beijing. Despite the overarching tensions, both countries reaffirmed their commitment to the Phase One trade deal.

AUGUST 2020 EQUITY INDEX PERFORMANCE (%)
Sources: MSCI Inc. and Thomson Reuters Datastream. MSCI data provided “as is” without any express or implied warranties.
Fixed Income
US high-yield credits outperformed Treasuries and US investment-grade corporate equivalents in August. Treasuries modestly declined as yields rose off record (or near-record) lows across the entire yield curve, particularly for longer-dated maturities; ten-year and five-year yields gained 17 and 7 basis points (bps) to 0.72% and 0.28%, respectively, and the ten-year/two-year yield spread widened to 58 bps. TIPS outperformed nominal Treasuries, pushing real interest rates further into negative territory as Chairman Jerome Powell announced the Fed unanimously adopted a “flexible form of average inflation targeting,” aiming to achieve an average inflation rate of 2% over time. The move, which was widely expected as a result of its year-long monetary policy framework review, indicates the Fed will keep monetary policy more accommodative for longer following extended periods of persistently low inflation with the aim of pushing inflation above 2% for some time. Tax-exempt municipal bonds declined but bested nominal US government bonds.
Sterling- and euro-denominated credits outpaced sovereign equivalents. Ten- and five-year gilt yields rose 23 and 12 bps to 0.35% and 0.00%, respectively, and UK five-year gilt yields briefly turned positive for the first time since early June. Ten-year German bund yields gained 14 bps to -0.40%, and 30-year bund yields turned positive. UK linkers lagged nominal gilts.

AUGUST 2020 BOND INDEX PERFORMANCE (%)
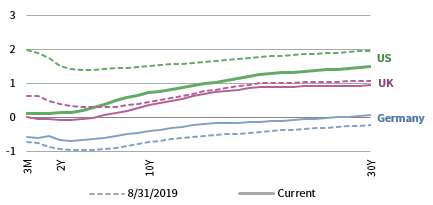
AUGUST 2020 NOMINAL YIELD CURVES
10Y/2Y YIELD CURVE SPLIT
* High-yield index yield data represent option-adjusted spread.
Sources: Bank of England, Bloomberg Index Services Limited, BofA Merrill Lynch, Federal Reserve, FTSE Fixed Income LLC, FTSE International Limited, Intercontinental Exchange, Inc., and Thomson Reuters Datastream.
Real Assets
Commodity futures advanced, led by energy and industrial metals.
Oil prices ($45.28 for Brent and $42.61 for WTI) advanced to their highest levels since the pandemic-related sell-off in March amid declining inventories and fears of potential US supply disruptions as Hurricane Laura approached the US Gulf Coast. The hurricane ultimately caused extensive damage across Louisiana, but refineries along the US energy corridor narrowly avoided significant disruptions.
Global natural resources equities and MLPs experienced mild gains in August; however, both remain deeply in the red year-to-date as investors grapple with what lower oil prices mean for future profitability.
Global developed REITs advanced, led by Asia REITs; Europe ex UK, UK REITs, and US REITs also gained, but underperformed the broader market.
Gold prices ($1,967.93 per troy ounce) exceeded $2,000 for the first time ever early in the month, before retreating to their first monthly decline since November 2019. The yellow metal has been in high demand this year, and remains the top performing major asset this year-to-date.

AUGUST 2020 REAL ASSETS PERFORMANCE (%)
* Europe ex UK REITs are in EUR terms and UK REITs in GBP terms.
Sources: Alerian, Bloomberg L.P., EPRA, FTSE International Limited, Intercontinental Exchange, Inc., MSCI Inc., National Association of Real Estate Investment Trusts, Standard & Poor’s, and Thomson Reuters Datastream. MSCI data provided “as is” without any express or implied warranties.
Notes: Total return data for all MSCI indexes are net of dividend taxes. Gold performance based on spot price return.
USD-Based Investors
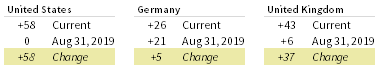
Risk assets advanced in August, led by equities and commodities. US equities outperformed developed ex US counterparts, extending their year-to-date outperformance to 19 ppts. The S&P 500 Index has now retraced its entire peak-to-trough drawdown, gaining 57.7% since the March 23 low and reaching new all-time highs. US large caps bested small caps equivalents, and broad developed markets equities outgained emerging markets stocks.
Commodity futures advanced, led by energy and industrial metals. US high-yield credits outperformed Treasuries and US investment-grade corporate equivalents, both of which were bottom performers as yields rose.
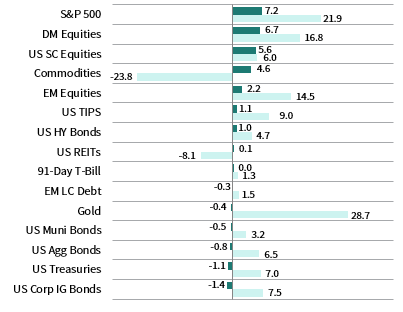
The US dollar continued its sell-off against most major currencies, falling the most versus the Australian and Canadian dollars and UK sterling; however, the dollar mildly gained vis-à-vis the Japanese yen and an equal-weighted basket of emerging markets currencies. Over the past year, the greenback has fallen the most versus the Swiss franc, UK sterling, and the Australian dollar, declining about 9% relative to all three respective currencies.
Chairman Jerome Powell announced the Fed unanimously adopted a “flexible form of average inflation targeting,” aiming to achieve an average inflation rate of 2% over time. The move, which was widely expected as a result of its year-long monetary policy framework review, indicates the Fed will keep monetary policy more accommodative for longer following extended periods of persistently low inflation with the aim of pushing inflation above 2% for some time.
INDEX PERFORMANCE (US$)
US DOLLAR PERFORMANCE VS VARIOUS CURRENCIES
Sources: Bloomberg Index Services Limited, FTSE International Limited, Frank Russell Company, Intercontinental Exchange, Inc., J.P. Morgan Securities, Inc., MSCI Inc., National Association of Real Estate Investment Trusts, Standard & Poor’s, and Thomson Reuters Datastream. MSCI data provided “as is” without any express or implied warranties.
EUR-Based Investors
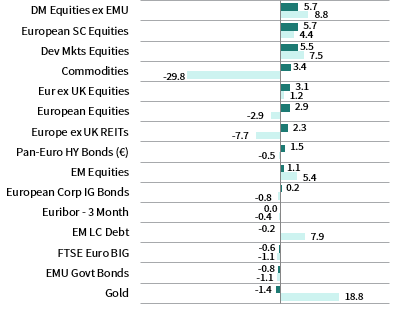
Risk assets advanced in August, led by equities and commodities. Developed ex EMU equities outperformed Eurozone counterparts, extending their year-to-date outperformance to 18 ppts in local currency terms. EMU small caps bested large and mid-cap equivalents. Broad developed markets equities outgained emerging markets counterparts.
Commodity futures advanced, led by energy and industrial metals. EMU high-yield credits topped investment-grade corporate equivalents and EMU government bonds as yields rose. Gold was the bottom-performing asset class on a weaker dollar (gold is priced in USD terms) and softer haven demand; despite this month’s decline, the yellow metal is by far the best-performing asset class over the past year.
Euro performance was mixed in August, appreciating versus the Japanese yen, an equal-weighted basket of emerging markets currencies, and the US dollar, while declining vis-à-vis the Australian and Canadian dollars and UK sterling; the common currency was roughly flat versus the Swiss franc. Over the past 12 months the euro mostly appreciated, gaining the most vis-à-vis the basket of EM currencies, the US dollar, and the Japanese yen.
Headline consumer price inflation slipped into deflationary territory in August, with a preliminary reading of -0.2% year-on-year, boosting widespread speculation that the ECB will lower its inflation forecast further below the 2% target at its September 10 meeting.
INDEX PERFORMANCE (€)

EURO PERFORMANCE VS VARIOUS CURRENCIES
Sources: Bloomberg Index Services Limited, EPRA, European Banking Federation, FTSE Fixed Income LLC, FTSE International Limited, ICE Benchmark Administration Ltd., J.P. Morgan Securities, Inc., MSCI Inc., National Association of Real Estate Investment Trusts, Standard & Poor’s, and Thomson Reuters Datastream.
GBP-Based Investors
Risk assets advanced in August, led by equities and commodities. Developed ex UK equities outperformed UK counterparts, extending their year-to-date outperformance to 26 ppts in local currency terms. UK mid-caps bested large-cap equivalents. Broad developed markets equities outpaced emerging markets counterparts.
Commodity futures advanced, led by energy and industrial metals. UK high-yield credits topped investment-grade corporate equivalents and UK gilts as yields rose. Nominal gilts bested UK linkers but both asset classes were bottom performers as yields rose.
UK sterling mostly strengthened in August, gaining the most versus the Japanese yen, an equal-weighted basket of emerging markets currencies, and the US dollar; sterling declined only vis-à-vis the Australian and Canadian dollars. Over the past 12 months, UK sterling broadly gained, advancing the most versus the emerging markets currency basket, the US dollar, and the Japanese yen.
The BOE left its benchmark policy rate unchanged early in the month, later stating it plans to leave monetary policy loose until inflation sustainably returns to target.

INDEX PERFORMANCE (£)

POUND STERLING PERFORMANCE VS VARIOUS CURRENCIES
Sources: Bloomberg Index Services Limited, EPRA, FTSE International Limited, Intercontinental Exchange, Inc., ICE Benchmark Administration Ltd., J.P. Morgan Securities, Inc., MSCI Inc., National Association of Real Estate Investment Trusts, Standard & Poor’s, and Thomson Reuters Datastream.
Performance Exhibits
All data are total returns unless otherwise noted. Total return data for all MSCI indexes are net of dividend taxes.
USD-Based Investors index performance chart includes performance for the Bloomberg Barclays US Aggregate Bond, Bloomberg Barclays US Corporate Investment Grade, Bloomberg Barclays US High Yield Bond, Bloomberg Barclays Municipal Bond, Bloomberg Barclays US TIPS, Bloomberg Barclays US Treasuries, ICE BofAML 91-Day Treasury Bills, FTSE® NAREIT All Equity REITs, J.P. Morgan GBI-EM Global Diversified, LBMA Gold Price, MSCI Emerging Markets, MSCI World, Russell 2000®, S&P 500, and S&P GSCI™ indexes.
EUR-Based Investors index performance chart includes performance for the Bloomberg Barclays Euro-Aggregate: Corporate, Bloomberg Barclays Pan-Euro High Yield (Euro), EURIBOR 3M, FTSE EMU Govt Bonds, FTSE Euro Broad Investment-Grade Bonds, FTSE® EPRA/NAREIT Europe ex UK RE, J.P. Morgan GBI-EM Global Diversified, LBMA Gold Price AM, MSCI Emerging Markets, MSCI Europe, MSCI Europe ex UK, MSCI Europe Small-Cap, MSCI World ex EMU, MSCI World, and S&P GSCI™ indexes.
GBP-Based Investors index performance chart includes performance for the Bloomberg Barclays Sterling Aggregate: Corporate Bond, Bloomberg Barclays Sterling Index-Linked Gilts, ICE BofAML Sterling High Yield, FTSE® 250, FTSE® All-Share, FTSE® British Government All Stocks, FTSE® EPRA/NAREIT UK RE, J.P. Morgan GBI-EM Global Diversified, LBMA Gold Price AM, LIBOR 3M GBP, MSCI Emerging Markets, MSCI Europe ex UK, MSCI World, MSCI World ex UK, and S&P GSCI™ indexes.
EM currencies is an equal-weighted basket of 20 emerging markets currencies.
Fixed Income Performance Table
Performance data for US TIPS reflect the Bloomberg Barclays US TIPS Index, with yields represented by the Bloomberg Barclays Global Inflation Linked Bond Index: US.