Global equities suffered broad drawdowns in August, despite a late-month rally. Developed markets stocks, led by US and Europe ex UK, outperformed emerging markets equivalents. Growth equities outpaced value stocks, and large caps bested small caps. Global government bonds outgained investment-grade corporates and high-yield bonds as yield spreads widened. Among real assets, commodity futures and natural resources equities declined, while REITs and gold prices advanced. The US dollar mostly appreciated, while UK sterling and euro were mixed; the safe-haven Japanese yen and Swiss franc were broadly stronger.
Volatility bounced back in August as geopolitical tensions heightened, economic data turned increasingly pessimistic, and a key segment of the US yield curve temporarily inverted. Unremitting trade frictions between the United States and China rattled global markets throughout the month. The United States officially labeled China a currency manipulator after Beijing allowed the yuan to slip beyond the seven-per-dollar mark, and the two countries escalated tit-for-tat tariffs, with the first round of additional import duties effective September 1. The Brexit debate came to a critical juncture, as Prime Minister Boris Johnson sought to suspend Parliament for five weeks; this maneuver aimed to remove the opportunity for Members of Parliament to prevent a “no-deal” departure from the EU on October 31. Opposition politicians sharply criticized the move and took steps to extend the Brexit deadline. Corporate earnings growth in second quarter was negative across major regions, and downward revisions to future quarters’ projections have reduced expectations for calendar year 2019 growth. Global economic indicators weakened, particularly in Europe, where consumer confidence fell further negative and manufacturing remained in contractionary territory. The IHS Markit US Manufacturing PMI™, a broadly followed US manufacturing measure, fell to its lowest level in nearly ten years, as many firms blamed stifled production on the trade war. The widely watched ten-year/two-year US treasury curve spread temporarily inverted for the first time since 2007 and unsettled markets because of its historical accuracy as an indicator of forthcoming recessions. Despite shaky economic data, consumer confidence remains near all-time highs, retail sales—a proxy for consumer spending, the main driver of the global economy—are growing, and most major equity markets remain up double digits year-to-date.
US equities (-1.6% for the S&P 500 Index) declined in August, but outperformed broader developed markets. Despite the decline, the United States remains up 18.3% year-to-date, leading all major global equity markets. Eight of 11 sectors delivered negative returns. Defensive and yield-oriented sectors—utilities, real estate, and consumer staples—gained, while energy, financials, and materials declined the most. Growth stocks outpaced value equivalents and large caps bested small caps, widening trailing 12-month outperformance to more than 15 percentage points. Second quarter year-over-year earnings per share (EPS) growth for the S&P 500 finished at -0.4%—better than previously expected, but negative for the second consecutive quarter, marking a technical “earnings recession” for the first time since early 2016. Companies issuing negative EPS guidance for third quarter outnumbered those providing positive guidance 79 to 30, continuing the trend of lower earnings in 2019 and reducing consensus full year 2019 earnings growth estimates to 2%, down from 10% last October. The second quarter US GDP growth estimate was revised slightly downward to 2.0%, above the Federal Reserve’s long-run growth expectations; it was driven by strong growth in consumer spending, which represents roughly 70% of overall US GDP. Fed Chairman Jerome Powell noted the global economic outlook “has been deteriorating” at the Fed’s annual symposium in Jackson Hole. Business-oriented data felt the impact of this deterioration, as industrial production unexpectedly declined, the manufacturing outlook fell to its lowest level in nearly ten years, and services activity growth slowed more than expected. The two major consumer outlook surveys both declined, but to varying degrees—the Conference Board survey fell less than expected, but the University of Michigan survey experienced its largest decline since 2012. Retail sales growth increased more than expected and was the bright spot of the month’s data releases.
European equities (-2.5% in USD, -1.4% in EUR, -2.0% in GBP) declined and lagged broader developed markets in August, dragged by UK equities. Europe ex UK was the best-performing developed markets region in local currency terms. Second quarter European EPS growth turned negative for the first time since 2016, and full year 2019 EPS growth projections now sit at 2%. Economic data out of the Eurozone continued to deteriorate as industrial output declined more than expected, manufacturing outlook remained in contractionary territory, and consumer confidence turned further negative. Germany, the Eurozone’s largest economy, experienced particularly poor economic data releases last month, as both industrial output and retail sales fell more than anticipated and already-poor sentiment surprised to the downside. German GDP growth turned negative, leading the Bundesbank, Germany’s central bank, to predict that the country is likely to enter a recession in third quarter. Elsewhere in the Eurozone, Italy’s Prime Minister Giuseppe Conte was given time to form a new coalition after the current government collapsed over a disagreement between the League and 5 Star parties about whether to trigger an early election. In the United Kingdom, Boris Johnson’s move to suspend Parliament until mid-October caused outcry based on concerns the move would increase the likelihood of a “no-deal” exit from the EU, setting the stage for a parliamentary showdown. UK GDP growth unexpectedly turned negative and, in line with Brexit uncertainty, exports and manufacturing declined more than expected. However, retail sales and CPI surprised to the upside.
Japanese equities (-1.0% in USD, 0.1% in EUR, -0.5% in GBP) declined and underperformed developed markets in local currency terms, but outperformed in major currency terms as the safe-haven Japanese yen strengthened on fears of a global economic slowdown. Japanese corporate EPS growth declined for the third consecutive quarter, the biggest decline since calendar second quarter 2016. Fiscal year 2019 EPS growth is now expected to be negative. Japanese GDP growth surprised to the upside at a 1.8% seasonally adjusted annual rate, well above the consensus 0.5% estimate. Counter to other major developed markets, industrial output topped expectations, while retail sales disappointed, declining more than anticipated. The political dispute between Korea and Japan heated up, as the former scrapped its intelligence sharing agreement with the latter after Japan placed export restrictions on Korea–its third largest export partner behind the United States and China. Exports fell 1.6% in July, marking the eighth straight month of declines. The Bank of Japan (BOJ) cut its bond purchases to below its previously specified band late in the month to prevent benchmark yields from falling to new-record lows. The next BOJ policy-setting meeting, scheduled for mid-September, is expected to be closely followed for potential additional easing from the central bank.
Emerging markets equities (-4.9% in USD, -3.8% in EUR, -4.4% in GBP) declined and underperformed developed markets peers for the seventh consecutive month in major currency terms. Among regions, emerging Asia outperformed broader emerging markets, while emerging Europe, the Middle East & Africa, and Latin America lagged. In local currency terms, Latin America was the best-performing region, but sharp depreciation in the Brazilian real dragged major currency returns lower. The decline was exacerbated by neighbor Argentina’s currency crisis after reformist president Mauricio Macri’s unanticipated defeat in primary elections. Argentina, which was promoted to the MSCI Emerging Markets Index at the end of May, declined 50% in major currency terms as it defaulted on its sovereign debt for the ninth time. India posted the only gains among major emerging markets, while Brazil, Taiwan, and South Africa declined, but outperformed broader emerging markets; Korea and China both lagged. Economic conditions declined in China as industrial output and retail sales disappointed. China’s central bank announced it would replace a formerly tightly controlled key lending rate with a more market-driven rate, effectively lowering interest rates, as a measure of ongoing stimulus. Frontier markets equities (-1.6% in USD, -0.5% in EUR, -1.1% in GBP) outperformed both developed and emerging markets stocks for the third time this year.
Real assets performance was mixed in August. Commodity futures (-2.3% for the Bloomberg Commodity TR Index and -5.6% for the energy-heavy S&P GSCI™ Index) declined as energy and agricultural prices fell, but precious metals posted gains. Oil prices fell as Brent and WTI declined 7.3% and 5.9% to $60.43 and $55.10, respectively. Global natural resources equities (-7.0% for the MSCI World Natural Resources Index in USD terms) and energy MLPs (-5.5%) underperformed broader equities amid declining energy prices and softening global economic growth outlook. Global developed REITs (1.9% in USD terms) advanced, led by US REITs (4.1%), Europe ex UK REITs (3.5%), and UK REITs (2.3%); Asia REITs (-0.6% in USD terms) declined. Gold prices (7.1%) rose to $1,529.31 per troy ounce as global economic and geopolitical fears deepened; the yellow metal has appreciated 27.1% over the past year, its largest gain since the 12 months ended in January 2012.
Global fixed income broadly advanced in August as the economic outlook deteriorated and negative yielding debt reached an all-time high. US Treasuries (3.4%) outperformed corporate investment-grade (3.1%) and high-yield (0.4%) bonds as credit spreads widened. Five- and ten-year Treasury yields declined 45 bps and 52 bps to 1.39% and 1.50%, respectively, and the 30-year yield reached an all-time low, falling to less than 2% for the first time. The ten-year minus three-month yield curve moved further negative, and has remained inverted for 71 of the past 72 trading days. The benchmark ten-year minus two-year yield curve briefly turned negative for the first time since June 2007, but finished the month flat. UK gilts (3.5%) gained, besting UK investment-grade corporate (1.5%) and high-yield (0.4%) bonds. Five- and ten-year gilt yields declined 8 bps and 24 bps to 0.30% and 0.44%, respectively. EMU government bonds (2.5%) gained as German ten-year bund yields continued their slide deeper into negative territory, finishing the month at -0.71%. Notably, German 30-year yields turned negative for the first time. Elsewhere in Europe, despite a struggling economy and domestic political turmoil, Italian ten-year government bond yields fell below 1% for the first time ever. Total global negative yielding investment-grade debt reached a new record US$17 trillion, which accounts for 30% of all outstanding global debt by market value. US TIPS (2.4%) and tax-exempt municipal bonds (1.6%) underperformed Treasuries. UK linkers (4.4%) outpaced nominal gilts.
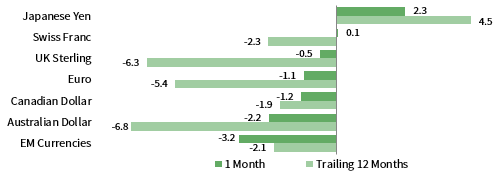
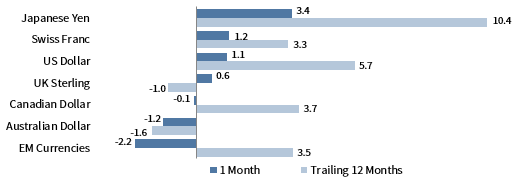
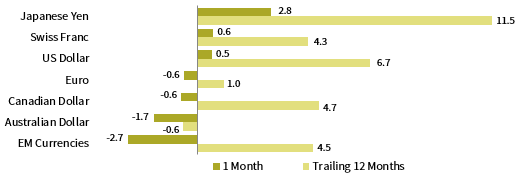
Among major currencies, the US dollar generally appreciated, while the euro and UK sterling were mixed. The greenback gained the most vis-à-vis commodity sensitive currencies, including our equal-weighted basket of emerging markets currencies, and the Australian and Canadian dollars. The US dollar weakened only against the safe-haven Swiss franc and Japanese yen. The euro and UK sterling declined against safe-haven currencies and appreciated vis-à-vis commodity-related currencies. UK sterling strengthened against the euro, boosted by news that the so-called “Irish backstop”—a sticking point in Brexit negotiation—could be amended.
Currency Performance as of August 31, 2019
The US dollar appreciated versus most major currencies in August, gaining the most versus our equal-weighted basket of emerging markets currencies, and the Australian and Canadian dollars. The greenback was broadly stronger over the trailing 12 months, weakening only relative to Japanese yen.
The euro was mixed over the past month, declining the most vis-à-vis Japanese yen, Swiss franc, and the US dollar, but gaining against our equal-weighted basket of EM currencies, and the Australian and Canadian dollars. Over the past 12 months, the euro is stronger against only UK sterling and the Canadian dollar.
UK sterling was mixed in August, depreciating the most against Japanese yen, Swiss franc, and the US dollar, but gaining against our equal-weighted basket of EM currencies, and the Australian and Canadian dollars. In the past 12 months, UK sterling has weakened against all but the Australian dollar.
Note: EM currencies is an equal-weighted basket of 20 currencies.
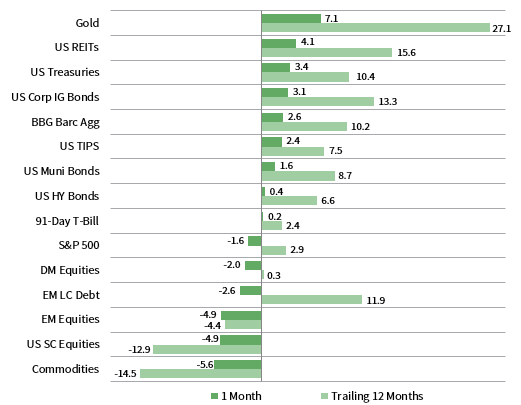
USD Market Performance as of August 31, 2019
Gold, US REITs, and bonds were top performers in August amid concerns of a global economic slowdown. US equities outperformed developed counterparts, and domestic large caps bested small caps. Treasuries outperformed IG and HY corporates. Commodities and EM equities declined amid US dollar strength.
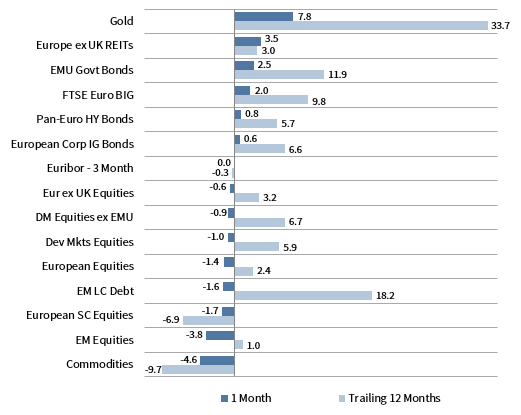
Euro Market Performance as of August 31, 2019
Gold, Europe ex UK REITs, and bonds were top performers in August as safe haven assets gained. EMU government bonds bested corporate IG and HY. Europe ex UK equities outperformed broader developed markets. Commodities and European small caps were among the bottom performers last month.
Sources: Bloomberg Index Services Limited, EPRA, European Banking Federation, FTSE Fixed Income LLC, FTSE International Limited, ICE Benchmark Administration Ltd., J.P. Morgan Securities, Inc., MSCI Inc., National Association of Real Estate Investment Trusts, Standard & Poor’s, and Thomson Reuters Datastream. MSCI data provided “as is” without any express or implied warranties.
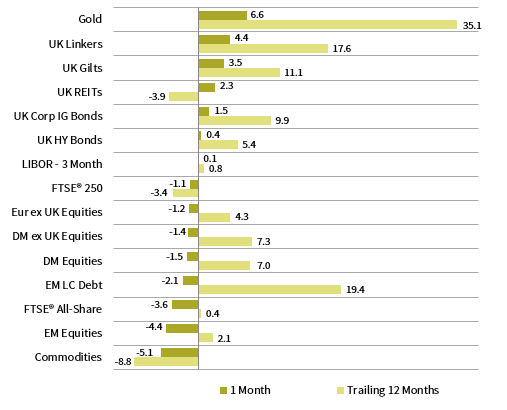
GBP Market Performance as of August 31, 2019
Gold, bonds, and UK REITs were top performers in August. UK equities were bested by developed counterparts. Linkers outgained nominal gilts, investment-grade corporates, and high-yield bonds. Domestic large caps were among the worst-performing asset classes.
Exhibit Notes
Performance Exhibits
Total return data for all MSCI indexes are net of dividend taxes.
US dollar index performance chart includes performance for the Bloomberg Barclays Aggregate Bond, Bloomberg Barclays Corporate Investment Grade, Bloomberg Barclays High-Yield Bond, Bloomberg Barclays Municipal Bond, Bloomberg Barclays US TIPS, Bloomberg Barclays US Treasuries, BofA Merrill Lynch 91-Day Treasury Bills, FTSE® NAREIT All Equity REITs, J.P. Morgan ELMI+, J.P. Morgan GBI-EM Global Diversified, MSCI Emerging Markets, MSCI World, Russell 2000®, S&P 500, and S&P GSCI™ indexes.
Euro index performance chart includes performance for the Bloomberg Barclays Euro-Aggregate: Corporate, Bloomberg Barclays Pan-Euro High Yield, Citigroup EMU Govt Bonds, Citigroup Euro Broad Investment-Grade Bonds, Euribor 3-month, FTSE® EPRA/NAREIT Europe ex UK, J.P. Morgan ELMI+, J.P. Morgan GBI-EM Global Diversified, MSCI Emerging Markets, MSCI Europe, MSCI Europe ex UK, MSCI Europe Small-Cap, MSCI World ex EMU, MSCI World, and S&P GSCI™ indexes.
UK sterling index performance chart includes performance for the Bloomberg Barclays Sterling Aggregate: Corporate Bond, BofA Merrill Lynch Sterling High Yield, FTSE® 250, FTSE® All-Share, FTSE® British Government All Stocks, FTSE® British Government Index-Linked All Stocks, FTSE® EPRA/NAREIT UK RE, J.P. Morgan ELMI+, J.P. Morgan GBI-EM Global Diversified, LIBOR 3M GBP, MSCI Emerging Markets, MSCI Europe ex UK, MSCI World, MSCI World ex UK, and S&P GSCI™ indexes.
Valuation Exhibits
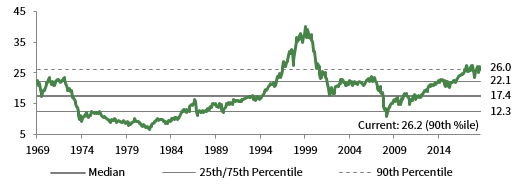
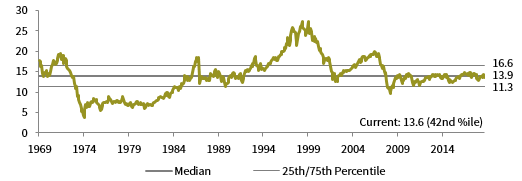
The composite normalized P/E ratio is calculated by dividing the inflation-adjusted index price by the simple average of three normalized earnings metrics: ten-year average real earnings (i.e., Shiller earnings), trend-line earnings, and return on equity–adjusted earnings. We have removed the bubble years 1998–2000 from our mean and standard deviation calculations. All data are monthly.
Fixed Income Yields
US fixed income yields reflect Bloomberg Barclays Municipal Bond Index, Bloomberg Barclays US Corporate High Yield Bond Index, Bloomberg Barclays US Corporate Investment-Grade Bond Index, and the ten-year Treasury.
European fixed income yields reflect the BofA Merrill Lynch Euro Corporate AA Bond Index, BofA Merrill Lynch Euro Corporate Bond Index, Bloomberg Barclays Pan-European Aggregate High Yield Bond Index, Bloomberg Twenty-Year European Government Bond Index (nominal), ten-year German bund, 20-year European Inflation Swaps (inflation expectations), and the real yield calculated as the difference between the inflation expectation and nominal yield.
UK sterling fixed income yields reflect the ICE BofAML Sterling Corporate AA Bond Index, ICE BofAML Sterling Corporate Bond Index, UK ten-year gilts, Bank of England 20-year nominal yields, and Bloomberg Generic UK 20-year inflation-linked (real) yields.

