Most global risk assets faltered in August, with the notable exception of US equities, which almost single-handedly drove gains in developed markets stocks; in contrast, emerging markets equivalents suffered further losses. Also in line with year-to-date trends, global growth stocks outperformed value counterparts (except in emerging markets, where value has bested growth in 2018), and small caps outgained large caps. Global investment-grade bonds mostly experienced muted gains as longer-dated US, UK, and German sovereign yields fell and curves flattened amid a flight to safety, although a sell-off in peripheral European bonds dragged EMU government bonds lower in aggregate. Global natural resources equities declined on falling metals prices, while developed markets REITs generally gained on lower bond yields. Currency performance painted the spectrum: the US dollar broadly gained along with the safe haven Swiss franc and Japanese yen, the euro was mixed, UK sterling mostly depreciated, and EM currencies were sharply weaker.
August performance reflected heightened uncertainty and ongoing risks to the global outlook arising from US-driven trade tensions and economic sanctions, as well as increasingly stretched market positioning, which beg the question: Are markets poised for sharp reversals if the “trade wars” narrative changes? These seemingly crowded trades include bullish sentiment toward US equities (particularly small caps), technology stocks, and the US dollar, set against bearish views with respect to emerging markets, industrial commodities, and Europe. Last month saw US equities set multiple all-time highs, and this year’s EM equity correction reached nearly 20% in USD terms. Further signs of market dislocations have been evident in relative valuations between growth and value indexes and between US and global ex US stocks, which are now well into the top decile of historical observations. Against this backdrop, trade negotiations between the United States and its major trading partners continue at a frenetic pace, with the crucial US mid-term elections fast approaching. It seems the Trump administration’s aggressive tactics have succeeded in bringing counterparties to the bargaining table; a recently announced “deal” was reached between the United States and Mexico to restructure parts of their trading relationship, currently regulated under NAFTA. Negotiations with Canada and China are ongoing, and if a compromise with either (or both) can be struck—by no means a certainty—recent market positioning could be unwound in a hurry.
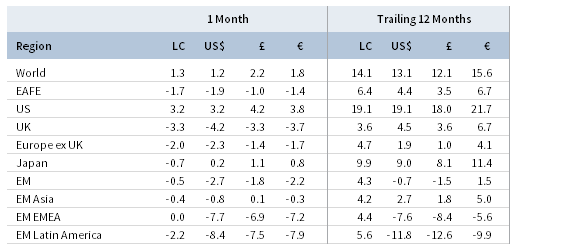
TOTAL RETURN FOR MSCI INDEXES (%)
US equities (3.3% for the S&P 500 Index) advanced for the fifth consecutive month and outperformed global ex US counterparts as the US market eclipsed its January 26 peak. The current bull market (which began on March 9, 2009) became the longest on record, surpassing the decade-long run-up to the 2000 dot-com peak, and Apple became the first publicly traded US company to achieve a $1 trillion market capitalization. Following a July pause in the year-to-date trends, small caps resumed their outperformance relative to large caps, and growth stocks bested value counterparts. Nine of 11 S&P 500 sectors were in the black for the month, led by information technology, consumer discretionary, and health care; the commodity-driven energy and materials sectors finished in the red. US stocks were bolstered by continued strength in corporate and economic fundamentals. Second quarter earnings growth exceeded expectations at 25% year-over-year, matching the first quarter rate and widely outpacing that of non-US peers. US economic activity also accelerated; second quarter GDP growth was revised upward to 4.2% annualized—the fastest rate since third quarter 2014—driven by robust consumption, net trade, and strengthening business investment. The US economy’s lone soft spot appears to be the housing market, which has begun feeling the drag of higher interest rates. The Federal Reserve held rates steady at their August meeting but signaled a continuation of gradual interest rate hikes as the Fed’s preferred inflation metric reached its 2% target in July.
European equities (-2.8% in USD, -2.2% in EUR, and -1.9% in GBP) underperformed broader developed markets amid rising concerns over “Brexit” negotiations, the new Italian government’s fiscal plans, and European banks’ exposure to deteriorating economic crises in Turkey and Latin America (i.e., Argentina and Venezuela). These developments overshadowed both a firming of economic data and an abatement of trade tensions with the United States. Against this backdrop, Europe ex UK stocks outpaced EMU and UK equivalents on the back of Nordic market gains. Eurozone second quarter GDP growth was revised higher in August to a 2.2% annualized rate, and the Eurozone composite PMI, which remains squarely in expansion territory, also improved in reaction to the recent easing of US/EU trade tensions. Eurozone core inflation remained tepid, which supported the European Central Bank’s earlier forecast of low rates well into next year. In the United Kingdom, second quarter GDP growth slowed to a 1.5% annualized rate, below the Bank of England’s (BOE) forecast, but retail sales in July largely exceeded consensus expectations and the unemployment rate fell to the lowest level in 43 years, affirming the BOE’s widely expected decision to raise rates at its early-August meeting. Second quarter European corporate earnings were decent, up roughly 10% year-over-year, but market volatility increased and sentiment deteriorated on the start of the new Italian coalition government’s budget deliberations. An official budget proposal is due to the EU by mid-October, a deadline which markets will undoubtedly be monitoring closely.
Japanese equities (0.2% in USD, 0.8% in EUR, and 1.1% in GBP) advanced on yen strength and outperformed non-US developed markets; yet equity performance was negative in local yen terms. Calendar second quarter earnings growth moderated to 9% year-over-year, the weakest pace in nearly two years. Calendar second quarter GDP growth improved to a 1.9% annualized rate following a mild contraction in first quarter, as strong consumer spending and the highest wage growth in more than 20 years contributed to a rebound in economic activity last quarter. Still, both headline and core inflation remain stubbornly low, and business activity remains hampered by global trade tensions. In an attempt to bolster the banking system the Bank of Japan slightly modified its monetary policy framework, which pushed up local yields early in the month.
Emerging markets equities (-2.7% in USD, -2.2% in EUR, and -1.8% in GBP) fell further and underperformed developed counterparts amid heightened geopolitical tensions, further US dollar strength, and growing external deficit funding concerns. Among EM regions in major currency terms, heavily weighted emerging Asia outperformed, while emerging Europe, the Middle East & Africa, and Latin America lagged the broader index. Turkey, Brazil, South Africa, and Russia all posted significant losses, mostly a result of sharply weaker currencies, as local currency returns were more muted. Index heavyweight China was also a notable detractor, declining nearly 4% in local currency terms, as Chinese internet stocks were hit hard by newly announced government restrictions regarding the popular online gaming industry. China’s trade spat with the United States intensified with another round of tit-for-tat tariff announcements, and trade tensions appeared to weigh on Chinese industrial activity as profits, exports, and fixed asset investment recently cooled. Low-level talks between United States and Chinese officials were held during the month with no formal signs of progress. Prior to the meeting, the Chinese yuan fell to a 15-month low before the Chinese central bank intervened to stabilize the exchange rate. Elsewhere on the geopolitical front, the United States imposed fresh sanctions on Russia, and US/Turkey relations also deteriorated. On the other hand, the United States and Mexico agreed to trade terms, particularly related to the auto sector, but the ultimate deal is unlikely to be finalized until early next year. Frontier markets equities (-5.4% in USD, -4.9% in EUR, and -4.5% in GBP) sold off, driven by a decline of more than 20% in Argentina. The Argentine peso slid to a new record low against the US dollar (posting its largest one-day decline since the peso was allowed to float in 2015), after the country requested an accelerated bailout from the International Monetary Fund.
Real assets once again experienced mixed performance. Commodity futures (-1.8% for the Bloomberg Commodity TR Index and 1.1% for the energy-heavy S&P GSCI™ Index) diverged due to differences in index construction; industrial metals, precious metals, and agriculture declined, while energy gained. Industrial metals are the worst-performing commodity sub-index year-to-date on the concern that a prolonged trade war between the United States and China will exacerbate the latter’s economic slowdown. Notably, copper prices, widely considered a barometer of global economic health, are off nearly 20% year-to-date. Crude oil prices ($77.42 for Brent and $69.80 for WTI) increased last month despite a stronger US dollar as US inventories fell and renewed US sanctions went into effect against Iran, limiting Iranian crude exports. Energy MLPs (1.6%) rose on favorable industry trends, but stronger energy prices were not enough to offset the drag from lower metals prices on natural resource equities (-4.4% for the MSCI World Natural Resources Index in USD terms). Developed markets REITs (1.0% in USD terms) were broadly positive in response to lower bond yields; US REITs (2.4%) and Europe ex UK REITs (1.5%) outperformed UK REITs (-2.0%) as Brexit concerns weighed on the latter. Gold prices (-1.6%) fell for the fifth consecutive month to $1,202.84/ounce, bringing trailing one-year performance to -8.6% in USD terms.
Global fixed income returns were slightly positive, as yields generally fell and rate curves flattened. US Treasuries (0.8%) advanced amid heightened geopolitical uncertainty and a global flight to safety. August also saw record short positioning at the longer end of the US Treasury curve, which likely contributed to the fall in yields as shorts were covered. The benchmark ten-year versus two-year yield spread fell to 24 basis points (bps) by month-end, but was down as low as 18 bps intra-month. Five- and ten-year Treasury yields declined 11 bps and 10 bps to end the month at 2.74% and 2.86%, respectively, but three-month yields climbed 8 bps to 2.11%. UK gilts (0.2%) gained as five- and ten-year gilt yields dropped 1 bp and 3 bps to 1.01% and 1.41%, respectively. Meanwhile, EMU government bonds (-0.6%) declined despite a rally in German bunds as spreads on Italian government bonds widened to the highest level in five years. US credit spreads also deteriorated as US Treasuries outperformed both high-yield (0.7%) and investment-grade (0.5%) corporate bonds. US Treasuries also outgained US TIPS (0.7%) and tax-exempt municipal bonds (0.3%). Nominal UK gilts outperformed UK linkers (-0.6%) as UK inflation came in below the BOE’s forecast.
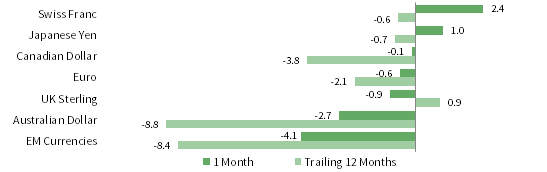
August saw sharp declines in several EM currencies, and some of the most commodity- and EM-exposed developed markets currencies also weakened; in contrast, safe-haven currencies rallied. The US dollar gained against all but the Swiss franc and Japanese yen, appreciating the most against an equal-weighted EM currency basket, the Australian dollar, and UK sterling; the greenback has appreciated against all but the pound over the past year. Euro performance was mixed, gaining against EM currencies, the Australian dollar, and UK sterling but declining relative to the Swiss franc, Japanese yen, and the US and Canadian dollars. UK sterling depreciated against most currencies, with the exception of the EM currency basket and the Australian dollar. The pound fell the most against the Swiss franc, Japanese yen, and US dollar, but UK sterling widely appreciated over the past year. Several EM currencies sold off sharply vis-à-vis the US dollar, particularly the Turkish lira (-25.9%), South African rand (-10.6%), Brazilian real (-8.8%), and Russian ruble (-7.4%).
Currency Performance as of August 31, 2018
The US dollar mostly strengthened in August, particularly vis-à-vis an equal-weighted EM currency basket and the Australian dollar, but depreciated relative to the Swiss franc and Japanese yen. Over the past year, the greenback broadly appreciated, most notably against the Australian dollar and EM currencies.
VERSUS THE US DOLLAR
Total Return (%)
Euro performance was mixed last month, gaining relative to EM currencies, the Australian dollar, and UK sterling, but falling against the Swiss franc, Japanese yen, and the US and Canadian dollars. The common currency mostly weakened over the past year, except versus EM currencies and the Australian and Canadian dollars.

VERSUS THE EURO
Total Return (%)
UK sterling generally depreciated for the month, weakening the most against the Swiss franc and Japanese yen but strengthening relative to EM currencies and the Australian dollar. In contrast, the pound broadly appreciated over the trailing 12 months.

VERSUS THE POUND STERLING
Total Return (%)
Note: EM currencies is an equal-weighted basket of 20 currencies.
USD Market Performance as of August 31, 2018
US equities led all asset categories in August, and US small caps outperformed large caps, as they have over the past year. US REITs continued to rebound and outpaced gains for commodities. US Treasuries outgained other domestic fixed income categories. EM assets declined in contrast amid broad currency weakness.

INDEX PERFORMANCE (US$)
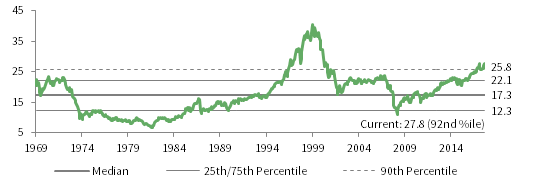
COMPOSITE NORMALIZED P/E: MSCI US
December 31, 1969 – August 31, 2018

FIXED INCOME YIELDS
August 2017 – August 2018
Sources: Bloomberg Index Services Limited, Bloomberg L.P., FTSE International Limited, Frank Russell Company, Intercontinental Exchange, Inc., J.P. Morgan Securities, Inc., MSCI Inc., National Association of Real Estate Investment Trusts, Standard & Poor’s, and Thomson Reuters Datastream. MSCI data provided “as is” without any express or implied warranties.
EUR Market Performance as of August 31, 2018
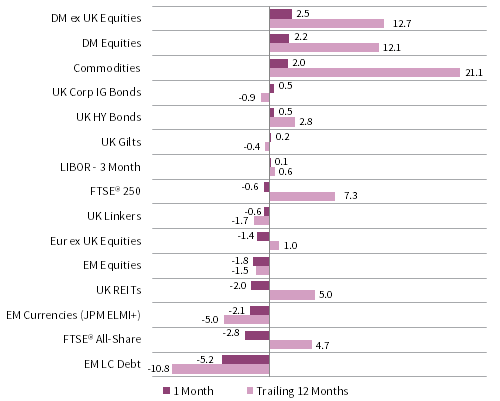
DM equities gained in August due to strong US outperformance, but European equities declined over 2%, matching losses by EM stocks. European fixed income also weakened but outperformed the region’s equities and EM LC debt, which suffered steep declines. Commodities and Europe ex UK REITs continued to rally last month.
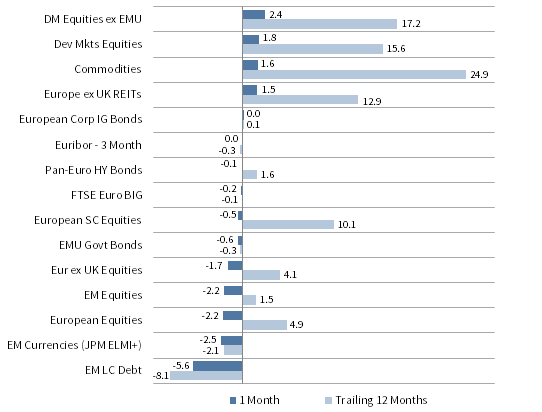
INDEX PERFORMANCE (€)
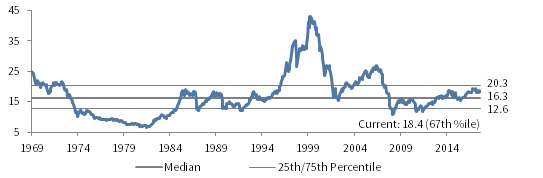
COMPOSITE NORMALIZED P/E: MSCI EUROPE EX UK
December 31, 1969 – August 31, 2018
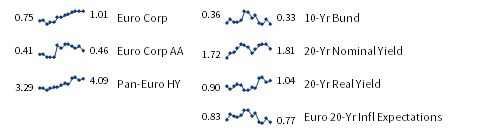
FIXED INCOME YIELDS
August 2017 – August 2018
Sources: Bloomberg Index Services Limited, Bloomberg L.P., EPRA, FTSE International Limited, J.P. Morgan Securities, Inc., MSCI Inc., National Association of Real Estate Investment Trusts, Standard & Poor’s, and Thomson Reuters Datastream. MSCI data provided “as is” without any express or implied warranties.
GBP Market Performance as of August 31, 2018
DM equities and commodities rallied last month, and returns for UK nominal fixed income assets were also marginally positive. UK equities declined in contrast, falling more than Europe ex UK and EM equivalents, though UK mid caps outperformed. UK REITs and EM LC debt also suffered losses.
INDEX PERFORMANCE (₤)
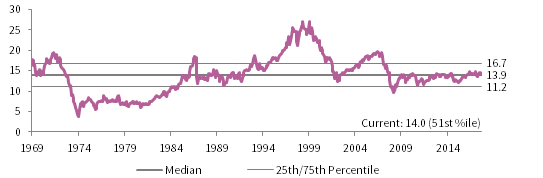
COMPOSITE NORMALIZED P/E: MSCI UK
December 31, 1969 – August 31, 2018
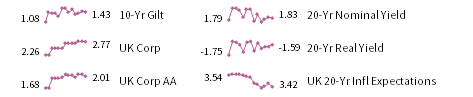
FIXED INCOME YIELDS
August 2017 – August 2018
Sources: Bloomberg Index Services Limited, Bloomberg L.P., EPRA, FTSE International Limited, Intercontinental Exchange, Inc., J.P. Morgan Securities, Inc., MSCI Inc., National Association of Real Estate Investment Trusts, Standard & Poor’s, and Thomson Reuters Datastream. MSCI data provided “as is” without any express or implied warranties.
Exhibit Notes
Performance Exhibits
Total return data for all MSCI indexes are net of dividend taxes.
US dollar index performance chart includes performance for the Bloomberg Barclays Aggregate Bond, Bloomberg Barclays Corporate Investment Grade, Bloomberg Barclays High Yield Bond, Bloomberg Barclays Municipal Bond, Bloomberg Barclays US TIPS, Bloomberg Barclays US Treasuries, ICE BofAML 91-Day Treasury Bills, FTSE® NAREIT All Equity REITs, J.P. Morgan ELMI+, J.P. Morgan GBI-EM Global Diversified, MSCI Emerging Markets, MSCI World, Russell 2000® , S&P 500 and S&P GSCI™ indexes.
Euro index performance chart includes performance for the Bloomberg Barclays Euro-Aggregate: Corporate, Bloomberg Barclays Pan-Euro High Yield, FTSE EMU Govt Bonds, FTSE Euro Broad Investment-Grade Bonds, EURIBOR 3M, FTSE® EPRA/NAREIT Europe ex UK RE, J.P. Morgan ELMI+, J.P. Morgan GBI-EM Global Diversified, MSCI Emerging Markets, MSCI Europe, MSCI Europe ex UK, MSCI Europe Small-Cap, MSCI World ex EMU, MSCI World, and S&P GSCI™ indexes.
UK sterling index performance chart includes performance for the Bloomberg Barclays Sterling Aggregate: Corporate Bond, ICE BofAML Sterling High Yield, FTSE® 250, FTSE® All-Share, FTSE British Government All Stocks, FTSE British Government Index-Linked All Stocks, FTSE® EPRA/NAREIT UK RE, J.P. Morgan ELMI+, J.P. Morgan GBI-EM Global Diversified, LIBOR 3M GBP, MSCI Emerging Markets, MSCI Europe ex UK, MSCI World, MSCI World ex UK, and S&P GSCI™ indexes.
Valuation Exhibits
The composite normalized P/E ratio is calculated by dividing the inflation-adjusted index price by the simple average of three normalized earnings metrics: ten-year average real earnings (i.e., Shiller earnings), trend-line earnings, and return on equity–adjusted earnings. We have removed the bubble years 1998–2000 from our mean and standard deviation calculations. All data are monthly.
Fixed Income Yields
US fixed income yields reflect Bloomberg Barclays Municipal Bond Index, Bloomberg Barclays US Corporate High Yield Bond Index, Bloomberg Barclays US Corporate Investment-Grade Bond Index, and the ten-year Treasury.
European fixed income yields reflect the ICE BofAML Euro Corporate AA Bond Index, ICE BofAML Euro Corporate Bond Index, Bloomberg Barclays Pan-European Aggregate High Yield Bond Index, Bloomberg Twenty-Year European Government Bond Index (nominal), ten-year German bund, 20-year European Inflation Swaps (inflation expectations), and the real yield calculated as the difference between the inflation expectation and nominal yield.
UK sterling fixed income yields reflect the ICE BofAML Sterling Corporate AA Bond Index, ICE BofAML Sterling Corporate Bond Index, UK ten-year gilts, Bank of England 20-year nominal yields, and Bloomberg Generic UK 20-year inflation-linked (real) yields.