Capital markets performance was mixed in August as several exogenous events caused some risk aversion to return to global markets. Global equities continued to advance, but at a more muted pace. Emerging markets outperformed developed markets for the eighth consecutive month in USD terms, and growth stocks once again outperformed value. Global yield curves flattened as investment-grade bonds outperformed equities in most major developed markets. Real assets were mixed as global REITs advanced but commodities and global natural resources equities underperformed global stocks. Among currencies, the euro strengthened, UK sterling declined, and the US dollar touched a multi-year low.
After historically low volatility during the first seven months of the year, volatility ticked up in August in reaction to geopolitical developments and a historic US natural disaster, and perhaps in anticipation of potential upcoming challenges involving the US debt ceiling, budget process, and tax reform. Mounting tensions between the West and North Korea, a new wave of Islamist terrorism in Europe, the US political fallout from the violent Charlottesville protests, and the devastating flooding in southern Texas from Hurricane Harvey all weighed on market sentiment and returns for the month. The headlines surrounding these events seemed to overshadow continued signs of broad-based global strength in economic activity and corporate results, as well as speeches by US Federal Reserve Chair Janet Yellen and European Central Bank (ECB) President Mario Draghi at the Kansas City Fed’s annual Jackson Hole economic symposium that underscored monetary policymakers’ contributions to global financial stability and the relatively benign economic environment. Despite the positive macroeconomic backdrop, recently higher market volatility could be sustained into September given the calendar of important central bank meetings in Europe, Japan, and the United States, and the aforementioned potential for ructions as the US Congress returns to session for important fiscal policy debates.
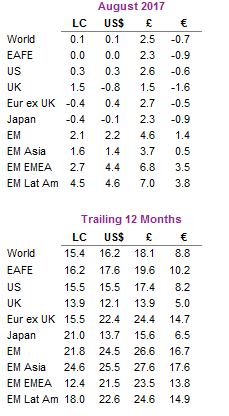
Total Return for MSCI Indexes (%)
US equities (0.3% for the S&P 500) advanced for the tenth consecutive month, and are now up 11.9% year-to-date. With almost 100% of S&P 500 companies reporting, second quarter earnings grew an estimated 10% year-over-year according to FactSet, above expectations; however, earnings per share growth fell to 3% excluding the energy, financials, and information technology sectors. Earnings have benefitted from a weak US dollar and strong economic data. Second quarter US GDP was revised upward to 3.0%, July retail sales beat expectations, consumer confidence reached its second-highest level since 2000, and July unemployment fell to 4.3%, tying May for the lowest level in 16 years. The Fed’s much-anticipated annual Jackson Hole symposium came and went without any major surprises from global central bankers. However, the Fed’s preferred inflation metric fell to 1.4% in July and the August non-farm payrolls report disappointed, complicating its plan to raise interest rates once more this year. Turning to sector performance, information technology and utilities gained the most in August; substantial positive surprises in earnings results benefited the former and a sharp drop in bond yields, the latter. Energy and telecommunication services lagged the most. The utilities sector has outpaced the related energy sector by 3,010 basis points (bps) year-to-date as depressed energy prices have hurt margins for energy producers and helped margins for energy consumers.
European equities (0.1%) performed in line with developed markets peers. UK stocks outperformed Europe ex UK and EMU equivalents in local currency terms but underperformed in EUR, GBP, and USD terms due to broad UK sterling weakness. With 84% of Stoxx 600 companies reporting, second quarter earnings per share grew 13% year-over-year. Although this was down from first quarter, it was still the second best growth rate for European companies in three years; excluding energy, earnings growth was lower, but a still-robust 9%. Economic data were more mixed; headline Eurozone inflation increased to 1.5% but core inflation remained at 1.2%, well below the ECB’s 2.0% target. Second quarter Eurozone GDP was revised up slightly to 2.2% and economic sentiment reached its highest level since July 2007. The unemployment rate remained steady at 9.1%—its lowest level since February 2009—but remains well above pre-crisis levels.
Japanese equities declined in USD (-0.1%) and EUR (-0.9%) terms but rose in GBP (2.3%) terms given pound weakness. As in other markets, TOPIX companies posted strong earnings results: with 97% of companies reporting, calendar second quarter earnings grew 22% year-over-year. A weaker yen provided a strong tailwind for Japanese earnings. Second quarter GDP was revised upward to 4.0%, sharply beating expectations; however, Bank of Japan (BOJ) Governor Haruhiko Kuroda was quick to downplay the results, stating the growth rate is not sustainable and that “around 2% growth” is more likely going forward. Real wages and retail sales for July also increased more than expected, and unemployment remained at a 23-year low, but headline and core inflation—both key metrics for the BOJ—remained anemic.
Emerging markets equities (2.2% in USD, 4.6% in GBP, and 1.4% in EUR) continued to outperform developed markets counterparts, supported by earnings strength, dollar weakness, and improving global economic trade. Latin America was the best-performing region for the second consecutive month; emerging Europe, the Middle East & Africa also outperformed the broader index, while emerging Asia lagged. Brazil was again a primary driver of Latin America’s outperformance as the country announced a plan to privatize billions of dollars of government assets, including oil fields, highways, and airports. Heavily weighted China accounted for more than half of emerging markets returns, despite emerging Asia’s underperformance. South Korea declined as the Vice Chairman of Samsung (which makes up more than one-quarter of the MSCI Korea Index) was sentenced to prison on corruption charges. Renewed tensions on the Korean peninsula also weighed on sentiment.
Real assets performance varied widely in August. Commodity futures were mixed (0.4% for the Bloomberg Commodity TR Index and -0.8% for the energy-heavy S&P GSCI™). Strong gains in industrial and precious metals were offset by sharp losses in agriculture and livestock. Energy prices diverged due to conflicting impacts from Hurricane Harvey. Brent crude oil finished the month roughly flat ($52.38), while WTI prices ($47.23) declined 6% as decreased demand from shuttered refineries more than offset the effects of decreased oil extraction in Texas and the Gulf of Mexico, contributing to the ongoing inventory glut. Gasoline prices spiked as almost one-third of US refineries—the world’s largest exporter of petroleum products—were affected by Harvey’s historic flooding. Global natural resource equities (-1.7% for the MSCI World Natural Resources Index) and energy MLPs (-4.9%) were among the worst-performing asset classes in August; however, metals and mining stocks (5.0%) significantly outperformed (all returns in USD terms). Global REITs (0.2% in USD terms) advanced for the fifth straight month. Europe ex UK REITs (1.9%) advanced the most and US REITs (0.6%) also gained; UK REITs (-0.2%) declined. Rising geopolitical risks helped gold advance 3.7% to $1,316.02/troy ounce; it has now gained 13.7% year-to-date.
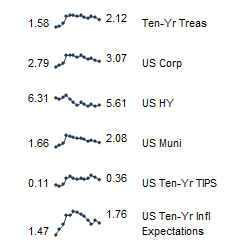
Yields declined across the board in August and global developed markets government bonds advanced, outperforming global equities. UK gilts (1.9%) outperformed US Treasuries (1.1%) and EMU government bonds (0.8%). Yields for five- and ten-year Treasuries fell 14 bps and 18 bps to 1.70% and 2.12%, respectively. The UK yield curve also flattened as the five- and ten-year yields fell 14 bps and 18 bps to 0.42% and 1.08%, respectively. US tax-exempt bonds (0.8%) underperformed Treasuries. US credit spreads widened as US investment-grade corporate bonds (0.8%) outperformed US high-yield bonds (0.0%), while both underperformed Treasuries. Among developed markets inflation-linked bonds, US TIPS (1.1%) kept pace with Treasuries and UK linkers (4.7%) outperformed nominal gilts.
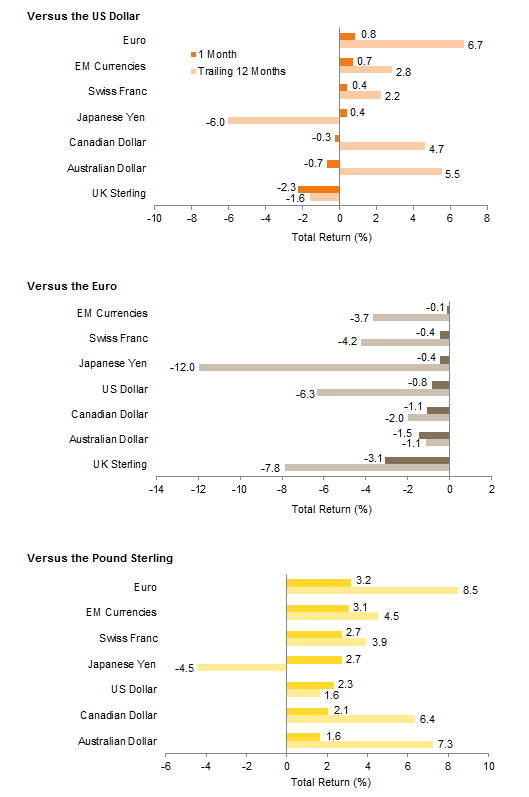
US dollar weakness continued in August as the trade-weighted greenback touched its lowest level since January 2015. The US dollar retreated against the euro, Swiss franc, Japanese yen, and our equal-weighted basket of EM currencies but gained against the Canadian dollar, Australian dollar, and UK sterling. Continuing recent trends, the euro strengthened against all major currencies and our EM currency basket, while UK sterling weakened across the board.
Market Exhibits
Currency Performance
The US dollar weakened in August, as the DXY Index touched a multi-year low. The greenback fell vis-à-vis the euro, Swiss franc, Japanese yen, and our EM currency basket but strengthened against the Canadian dollar, Australian dollar, and UK sterling
The euro strengthened against all major currencies—reaching multi-year highs against the US dollar and UK sterling—and our EM currency basket as the ECB showed no sign of tapering in the near term
UK sterling weakness resumed, after briefly strengthening against some major currencies in July, reflecting ongoing uncertainty over the UK’s economic future as “Brexit” talks continue
Currency Performance
As of August 31, 2017
Sources: MSCI Inc. and Thomson Reuters Datastream. MSCI data provided “as is” without any express or implied warranties.
Note: EM currencies is an equal-weighted basket of 20 currencies.
Index Performance (US$)
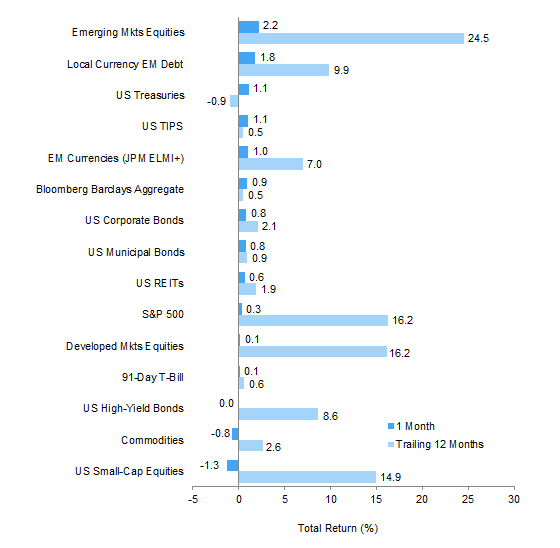
A weaker US dollar boosted emerging markets equities and emerging markets local currency debt, which outperformed developed markets equivalents both in August and over the past 12 months. The US Treasury yield curve flattened during the month and credit spreads widened as Treasuries outperformed investment-grade corporates and high-yield bonds. US large-cap equities gained slightly, outpacing small caps, which declined along with commodities
Index Performance (US$)
As of August 31, 2017

MSCI US Composite Normalized P/E
December 31, 1969 – August 31, 2017
Sources: Barclays, Bloomberg L.P., BofA Merill Lynch, FTSE International Limited, Frank Russell Company, J.P. Morgan Securities, Inc., MSCI Inc., National Association of Real Estate Investment Trusts, Standard & Poor’s, and Thomson Reuters Datastream. MSCI data provided “as is” without any express or implied warranties.
Fixed Income Yields
August 2016 – August 2017
Index Performance (€)
Europe ex UK REITs, emerging markets equities, and emerging markets local currency debt posted the best performance in August. The strengthening euro was a headwind for European and developed markets equities, which declined in contrast to gains for European investment-grade bonds. Commodities declined after briefly gaining in July
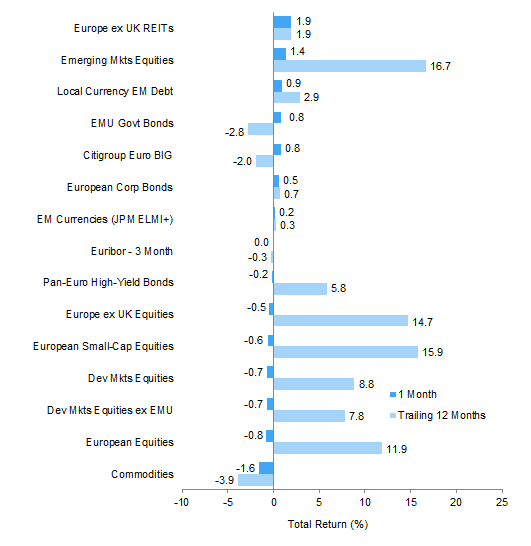
Index Performance (€)
As of August 31, 2017

MSCI Europe ex UK Composite Normalized P/E
December 31, 1969 – August 31, 2017
Sources: Barclays, Bloomberg L.P., Citigroup Global Markets, EPRA, FTSE International Limited, J.P. Morgan Securities, Inc., MSCI Inc., National Association of Real Estate Investment Trusts, Standard & Poor’s, and Thomson Reuters Datastream. MSCI data provided “as is” without any express or implied warranties.
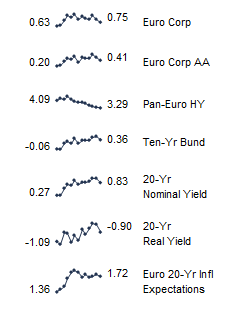
Fixed Income Yields
August 2016 – August 2017
Index Performance (£)
Sterling weakness helped all asset categories to advance for the month, save for UK REITs. UK linkers, emerging markets equities, and local currency EM debt led performance. Developed ex UK equities outperformed UK stocks, and UK large caps outpaced mid-caps. UK gilt yields declined and credit spreads widened as gilts outperformed investment-grade corporates and high-yield bonds
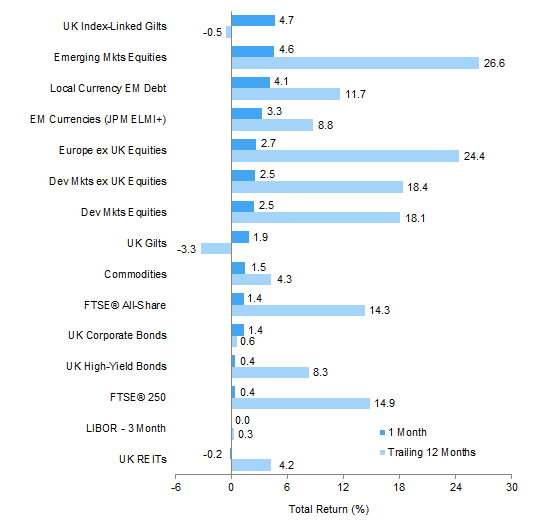
Index Performance (£)
As of August 31, 2017

MSCI UK Composite Normalized P/E
December 31, 1969 – August 31, 2017
Sources: Barclays, Bloomberg L.P., BofA Merill Lynch, EPRA, FTSE International Limited, J.P. Morgan Securities, Inc., MSCI Inc., National Association of Real Estate Investment Trusts, Standard & Poor’s, and Thomson Reuters Datastream. MSCI data provided “as is” without any express or implied warranties.
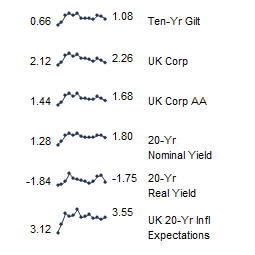
Fixed Income Yields
August 2016 – August 2017
Exhibit Notes
Performance Exhibits
Total return data for all MSCI indexes are net of dividend taxes.
US dollar index performance chart includes performance for the Bloomberg Barclays Aggregate Bond, Bloomberg Barclays Corporate Investment Grade, Bloomberg Barclays High-Yield Bond, Bloomberg Barclays Municipal Bond, Bloomberg Barclays US TIPS, Bloomberg Barclays US Treasuries, BofA Merrill Lynch 91-Day Treasury Bills, FTSE® NAREIT All Equity REITs, J.P. Morgan ELMI+, J.P. Morgan GBI-EM Global Diversified, MSCI Emerging Markets, MSCI World, Russell 2000®, S&P 500, and S&P GSCI™ indexes.
Euro index performance chart includes performance for the Bloomberg Barclays Euro-Aggregate: Corporate, Bloomberg Barclays Pan-Euro High Yield, Citigroup EMU Govt Bonds, Citigroup Euro Broad Investment-Grade Bonds, Euribor 3-month, FTSE® EPRA/NAREIT Europe ex UK, J.P. Morgan ELMI+, J.P. Morgan GBI-EM Global Diversified, MSCI Emerging Markets, MSCI Europe, MSCI Europe ex UK, MSCI Europe Small-Cap, MSCI World ex EMU, MSCI World, and S&P GSCI™ indexes.
UK sterling index performance chart includes performance for the Bloomberg Barclays Sterling Aggregate: Corporate Bond, BofA Merrill Lynch Sterling High Yield, FTSE® 250, FTSE® All-Share, FTSE® British Government All Stocks, FTSE® British Government Index-Linked All Stocks, FTSE® EPRA/NAREIT UK RE, J.P. Morgan ELMI+, J.P. Morgan GBI-EM Global Diversified, LIBOR 3M GBP, MSCI Emerging Markets, MSCI Europe ex UK, MSCI World, MSCI World ex UK, and S&P GSCI™ indexes.
Valuation Exhibits
The composite normalized P/E ratio is calculated by dividing the inflation-adjusted index price by the simple average of three normalized earnings metrics: ten-year average real earnings (i.e., Shiller earnings), trend-line earnings, and return on equity–adjusted earnings. We have removed the bubble years 1998–2000 from our mean and standard deviation calculations. All data are monthly.
Fixed Income Yields
US fixed income yields reflect Bloomberg Barclays Municipal Bond Index, Bloomberg Barclays US Corporate High-Yield Bond Index, Bloomberg Barclays US Corporate Investment-Grade Bond Index, and the ten-year Treasury.
European fixed income yields reflect the BofA Merrill Lynch Euro Corporate AA Bond Index, BofA Merrill Lynch Euro Corporate Bond Index, Barclays Pan-European Aggregate High Yield Bond Index, Bloomberg Twenty-Year European Government Bond Index (nominal), ten-year German bund, 20-year European Inflation Swaps (inflation expectations), and the real yield calculated as the difference between the inflation expectation and nominal yield.
UK sterling fixed income yields reflect the BofA Merrill Lynch Sterling Corporate AA Bond Index, BofA Merrill Lynch Sterling Corporate Bond Index, UK ten-year gilts, Bank of England 20-year nominal yields, and Bloomberg Generic UK 20-year inflation-linked (real) yields. Current UK 20-year nominal yield data are as of August 30, 2017.