Markets were mostly subdued in August as some measures of equity market volatility dropped against a backdrop of seasonally depressed trading volumes and supportive monetary policy announcements. Global equities generally posted small gains, and emerging markets stocks added to their outperformance of developed markets over the past year. Developed markets government bond returns fell as yields climbed from record lows, though UK gilts moved in the opposite direction in response to the Bank of England’s (BOE’s) decision to increase its asset purchases. The US dollar advanced, and expectations rose for a US rate hike before year-end following comments from US Federal Reserve officials that the economy’s recent improvement supports such a move. The stronger dollar weighed on commodity prices and was one reason the rebound in oil stalled.
Reflecting the benign market environment, riskier assets such as small caps, global high-yield corporate bonds, and USD-denominated emerging markets debt outperformed alongside emerging markets equities. Defensive equity strategies and sectors underperformed; in developed markets, utility stocks were the worst-performing sector in August after experiencing strong performance over the past year. The health care, consumer staples, and telecom services sectors also experienced declines for the month. Value stocks outperformed growth equities across the developed markets as financials, which make up a large portion of the value indexes, were the best-performing sector. The possibility that negative interest rates are approaching their lower bound was one likely driver of financials’ performance.
US equities (0.1%) were barely positive despite the S&P 500 reaching a new record high for a second consecutive month. Small-cap value was the best-performing segment in the US market, whereas large-cap growth shares underperformed, suffering declines in aggregate. Valuations climbed back to levels last seen in early 2015, just prior to the last major market correction, and are pricing in a strong earnings recovery over the next 12 months. While the worst of the earnings recession appears to have passed, as second quarter earnings results increased versus the prior quarter (they were still negative year-over-year), third quarter earnings expectations were dialed back as the recent results season progressed.
European stocks topped developed markets peers as UK equities (1.5%) slightly outperformed Eurozone (1.3%) and Europe ex UK (1.0%) stocks; the strong dollar pulled down returns for US investors (0.2%, 0.9%, and 0.4%, respectively). The UK economy appears to be weathering the post-Brexit uncertainty so far as the latest retail sales data and manufacturing surveys show that the currency is acting as an important shock absorber, though consumer and business confidence has certainly taken a hit. Supportive measures taken by the BOE have also eased some pressure on the real estate sector. Economic data releases in the Eurozone generally showed that the recovery remains intact, and the stress-test results announced at the end of July indicated that bank balance sheets have at least been strengthened in the past couple years. Still, Eurozone equities remain undervalued relative to global peers due to ongoing structural headwinds facing European banks and heightened political risk for the region. The Spanish ruling party’s inability yet again to form a functioning government in a month-end vote demonstrates the major obstacles facing Eurozone policymakers pursuing necessary structural reforms.
Japanese equities (1.3%) outperformed but continue to significantly lag developed markets equivalents over the trailing one-year period. The strong yen has weighed heavily on Japanese corporate profits and, by extension, share prices. The yen’s slight weakness in August thus provided some small relief to sectors with larger export exposures like materials, information technology, and consumer discretionary. The Bank of Japan’s (BOJ’s) decision in late July to refrain from cutting rates further into negative territory also helped financials to outperform. The economy remains weak, and the fiscal stimulus announced at the start of the month underwhelmed. All eyes will be on the BOJ’s monetary policy review due in late September, with Governor Haruhiko Kuroda recently stating that nothing should be ruled out.
Emerging markets equities (2.8%) continued their outperformance of developed markets stocks (0.4%) in August and lead by 458 bps over the past year. A strong rally in China (7.3%) following better than expected earnings results and amid signs of rising mainland interest in offshore listings led emerging Asia (3.8%) to outperform Latin America (1.1%) and emerging Europe, the Middle East, & Africa (-0.2%). A notable underperformer was South Africa (-2.0%), where political risk is rising as local elections saw the ruling African National Congress suffer its biggest defeat since taking power in 1994. An ongoing rift between President Jacob Zuma and his well-regarded finance minister has led the latter to become the subject of a federal investigation.
Real asset performance was generally negative, with a few exceptions. Returns for commodity futures (-1.8% for the Bloomberg Commodity TR Index and 1.8% for the energy-heavy S&P GSCI™) were a mixed bag as the energy category gained, while the metals and agriculture categories experienced large declines. Oil prices rebounded, ending their brief bear market experienced in July, as some investors closed out short positions in anticipation of more balanced supply and demand. However, the rally ended as quickly as it began due to growing crude and petroleum inventories and a strengthening dollar. The crude rebound contributed to small gains for energy equities, yet broader natural resources equities (-0.3%) were dragged lower by large declines in metals and mining stocks. The gold spot price weakened 3.1% to close at $1,307.93/troy ounce. Sentiment on US yield plays appeared to weaken as energy master limited partnerships (-1.3%) and US REITs (-3.5%) declined, giving back some of their strong year-to-date gains.
Global government bonds (-0.4%) mostly retreated as sovereign yields climbed from record lows. UK gilts (2.7%) were an exception as the BOE cut its benchmark interest rate to the lowest level in modern history and announced additional quantitative easing. The ten-year gilt yield fell 16 bps over the month to 0.64%, while short-term rates went unchanged. UK investment-grade corporate bonds (3.0%) rallied on the BOE’s plans to include them in its asset purchase program. US Treasuries (-0.5%) declined as yields on five-year and ten-year bonds rallied 16 bps and 12 bps, respectively, to end the month at 1.19% and 1.58%. EMU government bonds (-0.3%) also saw a slight rise in yields, although German bund yields remain in negative territory out to ten years. US tax-exempt bonds (0.1%) outperformed Treasuries, as did US investment-grade (0.2%) and US high-yield (2.1%) corporates. Turning to inflation-linked bonds, UK linkers (9.4%) experienced one of their strongest months ever as post-Brexit inflation expectations climbed in light of a weaker pound sterling. US TIPS (-0.4%) fell, resulting in a slight bump in real yields.
The US dollar strengthened relative to major developed markets currencies as well as versus an equal-weighted basket of emerging markets currencies; rising odds of a US rate hike before year-end contributed to the greenback’s rise. UK sterling depreciated further; only the Swiss franc was weaker versus the British pound among major currencies. The euro weakened against the US dollar and an EM currency basket, but appreciated relative to other currencies. Emerging markets currencies were generally stronger, with the exception of the South African rand, Chilean peso, and Peruvian sol, where falling metal prices contributed to currency weakness. The Chinese yuan was weaker versus the US dollar but gained against the trade-weighted CFETS basket.
Market Exhibits
S&P 500 Realized and Implied Volatility
The VIX dropped in August to levels not seen since mid-2015 and measures of realized volatility were also low.Announcements of further monetary policy stimulus in the United Kingdom and Japan to start the month and the late summer’s typically low seasonal trading volumes likely contributed to the benign environment for equities

S&P 500 Realized and Implied Volatility
December 31, 2014 – August 31, 2016
Notes: The VIX measures the implied volatility of near-term S&P 500 Index options. Realized volatility is the 30- and 90-day annualized standard deviation of the S&P 500 Index. Volatility data are daily.
S&P 500 Forward EPS and Forward P/E
The S&P 500 set multiple all-time highs in August, and valuations returned to levels last seen in early 2015, just prior to the last market correction. Current valuations are assuming a strong earnings recovery over the next 12 months and leave little room for further multiple expansion

S&P 500 Forward EPS and Forward P/E
August 31, 1996 – August 31, 2016 • US Dollar
Comparing Developed and Emerging Markets Equity Performance
EM equities continued to outperform, both in local currency and in USD terms, as they have for the past year following several years of underperformance relative to developed markets. An improving EM growth outlook, a range-bound US dollar, and historically low DM yields have all driven flows into EM assets
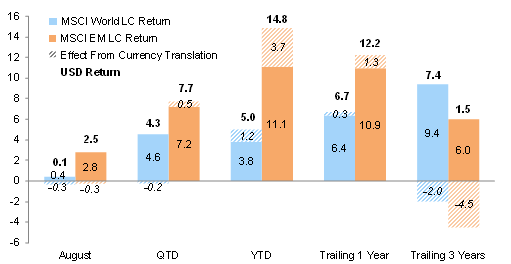
Comparing Developed and Emerging Markets Equity Performance
As of August 31, 2016 • Percent (%)
Sources: MSCI Inc. and Thomson Reuters Datastream. MSCI data provided “as is” without any express or implied warranties.
Notes: Performance represented by total returns. Bars show local currency returns with effect from foreign currency translation italicized. USD returns are bolded. Total returns for MSCI developed markets indexes are net of dividend taxes. Total returns for MSCI emerging markets indexes are gross of dividend taxes. Trailing three-year returns are annualized.
US Oil Price vs Inventory Level
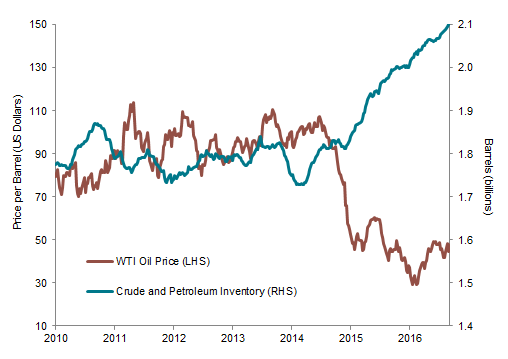
Oil prices experienced a strong rebound to start the month as some investors covered short positions in anticipation of more balanced supply and demand, yet US crude and petroleum inventories continued growing to record levels, helping to end the rally and causing prices to retreat into month-end
US Oil Price vs Inventory Level
January 1, 2010 – August 31, 2016
Sources: Bloomberg L.P. and Energy Information Administration.
Notes: Inventory data are as of August 26 and represent weekly ending stocks of US crude oil and petroleum products. WTI oil data represent weekly near-month futures contract prices.
Currency Performance
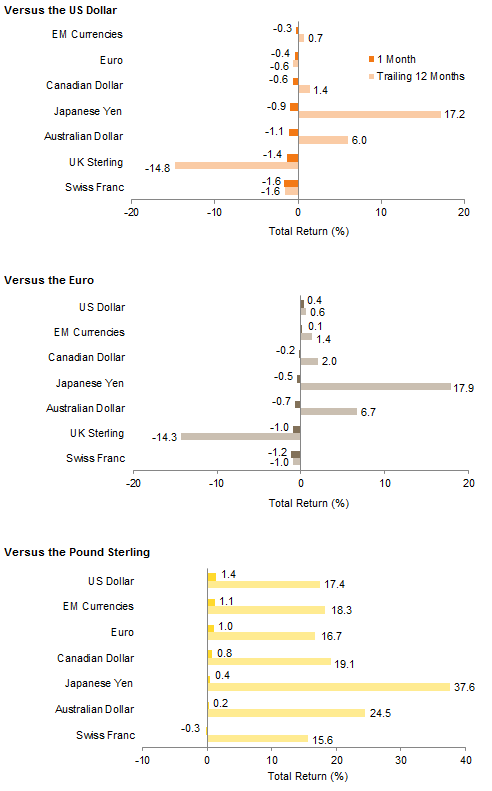
The US dollar strengthened relative to major DM currencies as well as versus a basket of EM currencies; rising odds of a US rate hike before year-end following recent comments from Fed officials contributed to the greenback’s rise
The euro weakened slightly versus the US dollar and a basket of EM currencies but strengthened relative to other major market currencies. The common currency has now appreciated against the Swiss franc over the last 12 months
The pound sterling depreciated further in August with the US dollar and euro gaining the most versus sterling among DM currencies; only the Swiss franc was weaker for the month. EM currencies also strengthened versus the pound, which is now down 15% or more against all major currencies over the past year
Currency Performance
As of August 31, 2016
Sources: MSCI Inc. and Thomson Reuters Datastream. MSCI data provided “as is” without any express or implied warranties.
Note: EM currencies is an equal-weighted basket of 20 currencies.
Index Performance (USD)
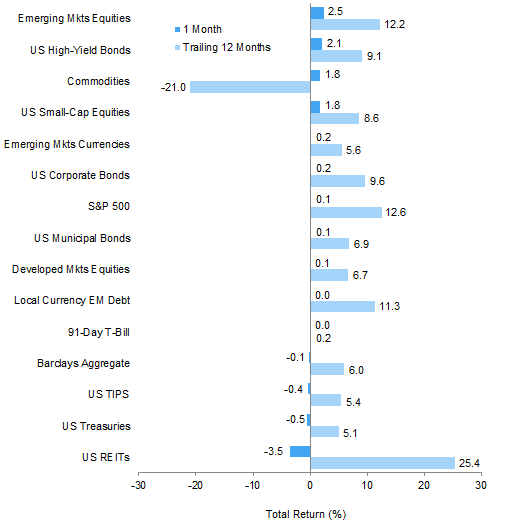
EM equities, US high-yield bonds, and US small caps outperformed US large caps and DM equities, which were barely positive. US investment-grade corporate bonds and US tax-exempt bonds also had slight gains, whereas US Treasuries declined. US REITs suffered losses but have still outperformed other asset classes over the trailing 12 months
Index Performance (USD)
As of August 31, 2016
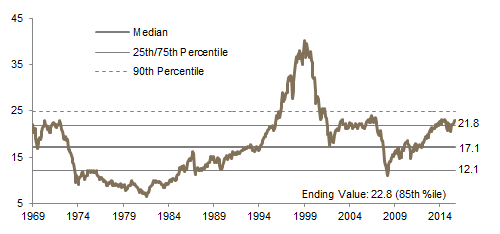
MSCI US Composite Normalized P/E
December 31, 1969 – August 31, 2016
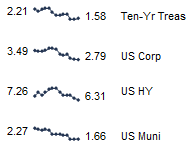
Fixed Income Yields
August 2015 – August 2016
Index Performance (€)
EM equities, Eurozone high-yield bonds, and European small caps outperformed Europe ex UK and DM equities in euro terms. Local currency EM debt and European investment-grade corporate bonds experienced small gains and outperformed Eurozone sovereign bonds, which declined as yields continued to rise from record lows

Index Performance (€)
As of August 31, 2016
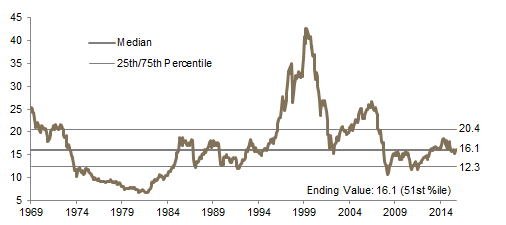
MSCI Europe ex UK Composite Normalized P/E
December 31, 1969 – August 31, 2016
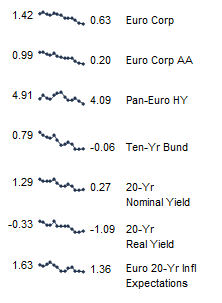
Fixed Income Yields
August 2015 – August 2016
Index Performance (₤)
Further currency weakness and a benign yet still uncertain investment environment meant all major asset classes notched gains in pound sterling terms. EM equities, UK corporate bonds, and UK mid caps outperformed UK large caps and DM equities. UK linkers enjoyed particularly strong performance, with August one of the best months in their history; UK gilts also rallied further as yields touched record lows. Over the past 12 months, only commodity futures and UK REITs have retreated

Index Performance (₤)
As of August 31, 2016

MSCI UK Composite Normalized P/E
December 31, 1969 – August 31, 2016
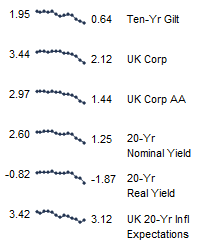
Fixed Income Yields
August 2015 – August 2016
Exhibit Notes
Performance Exhibits
Total returns for MSCI developed markets indexes are net of dividend taxes. Total returns for MSCI emerging markets indexes are gross of dividend taxes.
US dollar index performance chart includes performance for the Barclays Corporate Investment Grade, Barclays High Yield Bond, Barclays Municipal Bond, Barclays US TIPS, Barclays US Treasuries, BofA Merrill Lynch 91-Day Treasury Bills, FTSE® NAREIT All Equity REITs, J.P. Morgan ELMI+, J.P. Morgan GBI-EM Global Diversified, MSCI Emerging Markets, MSCI World, Russell 2000®, and S&P GSCI™ indexes.
Euro index performance chart includes performance for the Barclays Euro-Aggregate: Corporate, Barclays Pan-Euro High Yield, Citigroup EMU Govt Bonds, FTSE® EPRA/NAREIT Europe ex UK, J.P. Morgan ELMI+, J.P. Morgan GBI-EM Global Diversified, MSCI Emerging Markets, MSCI Europe, MSCI Europe ex UK, MSCI Europe Small Cap, MSCI World ex EMU, MSCI World, and S&P GSCI™ indexes.
UK sterling index performance chart includes performance for the Barclays Sterling Agg Corps, BofA Merrill Lynch Sterling High Yield, FTSE® British Government All Stocks, FTSE® British Government Index-Linked All Stocks, FTSE® EPRA/NAREIT UK RE, FTSE® 250, J.P. Morgan ELMI+, J.P. Morgan GBI-EM Global Diversified, MSCI Emerging Markets, MSCI Europe ex UK, MSCI World, MSCI World ex UK, and S&P GSCI™ indexes.
Valuation Exhibits
The composite normalized P/E ratio is calculated by dividing the inflation-adjusted index price by the simple average of three normalized earnings metrics: ten-year average real earnings (i.e., Shiller earnings), trend-line earnings, and return on equity–adjusted earnings. We have removed the bubble years 1998–2000 from our mean and standard deviation calculations. All data are monthly.
Fixed Income Yields
US fixed income yields reflect Barclays Municipal Bond Index, Barclays US Corporate High Yield Bond Index, Barclays US Corporate Investment-Grade Bond Index, and the ten-year Treasury.
European fixed income yields reflect the BofA Merrill Lynch Euro Corporate AA Bond Index, BofA Merrill Lynch Euro Corporate Bond Index, Barclays Pan-European Aggregate High Yield Bond Index, Bloomberg Twenty-Year European Government Bond Index (nominal), ten-year German bund, 20-year European Inflation Swaps (inflation expectations), and the real yield calculated as the difference between the inflation expectation and nominal yield.
UK sterling fixed income yields reflect the BofA Merrill Lynch Sterling Corporate AA Bond Index, BofA Merrill Lynch Sterling Corporate Bond Index, UK ten-year gilts, and Bank of England 20-year nominal, real, and zero coupon (inflation expectations) yields.