The so-called Goldilocks environment for risk assets persisted in August, as dovish comments emanating from a meeting of the world’s central bankers in Jackson Hole and weaker economic data helped convince investors that interest rate hikes are not imminent; US stocks led developed markets equities higher and the S&P 500 passed the key psychological 2,000 level, triggering a spate of bearish prognostications about future returns.
Reasonable earnings growth and dovish remarks by global central bankers at the Federal Reserve’s annual Jackson Hole symposium helped push risk assets higher in August, despite rising geopolitical tensions and mixed messages from economic releases. The S&P 500 Equity Index passed 2,000 for the first time, helping to trigger a growing number of reports advising investors to brace for lower returns. Given stretched US equity and bond valuations, we have some sympathy for this argument. Subdued inflationary pressures and the perceived central bank backstop also made for a strong month for sovereign bonds and credit.
US equities (4.0%) led developed markets peers (2.6%), bringing their year-to-date return to 9.9%. Earnings are now expected to grow 7% in 2014, creating two headwinds for investors. First, this is roughly twice the pace revenues are growing, begging the question whether margins can really rise further from historical highs. Second, as share price appreciation continues to outpace earnings, short-term multiples push ever higher. Slow revenue growth helps explain why many companies are looking at foreign mergers for “tax inversion” purposes. Domestic economic data are improving, with second quarter GDP coming in at 4.2% (annualized basis) and some housing data starting to improve (e.g., starts). Despite this, US fixed income also had a strong month as Treasury yields fell to the lowest levels in over 12 months. Fed Chair Janet Yellen’s comments about excess slack in the labor market were perceived as dovish and US bond yields look attractive when compared to global peers. The Barclays Aggregate Bond Index returned 1.1% while US high yield (1.6%) recouped all of July’s losses.
European Central Bank President Mario Draghi commented at Jackson Hole that he was prepared to use “all available instruments” to help the economy, boosting sentiment. Recent economic data underscore his concerns; Eurozone growth ground to a halt in the second quarter and consumer prices rose in August by just 0.3%, the slowest pace in five years. Eurozone fixed income had another strong month given this data and Draghi’s comments; long-dated Eurozone sovereign bonds returned 4.4% and have now returned an astonishing 21% year-to-date. European equities (1.8%) could not keep pace with bonds but recovered from earlier losses as tensions between Russia and Ukraine appeared to ease. In contrast with the macro data (which have looked healthier in the United Kingdom), the better news for equity investors is that profits are again growing in 2014; however, this is partly because some of the large financial sector write-offs make 2013 a favorable base for comparison. In August the euro fell 1.6% to an 11-month low versus the US dollar (the pound fell an identical amount), sparking hopes that European companies will receive a boost from translating their foreign earnings back into local currencies.
Tensions also weighed on Russian stocks and the ruble, which hit an all-time low against the US dollar. However, emerging markets equities (2.0%) had a strong month and now lead developed markets equities year-to-date. Brazilian equities rallied nearly 10% (and are up around 19% year-to-date) as hopes grew about more market-friendly election results. EM macro data were lackluster, with growth continuing to slow in major commodity exporters like Brazil and Russia, though looking much healthier in emerging Asia. EM earnings have been more resilient but face headwinds from slowing growth. The consensus now expects 8% growth this year, down from January but above levels expected in the United States and Europe (7% and 6%, respectively). Given concerns over a credit bubble in China, analysts poured over second quarter earnings results from major Chinese banks and questioned whether provisions for bad debts were sufficient. China’s five largest banks trade around 5 times 2014 earnings and are extremely profitable, which should offer some cushion if a rising share of loans start to default. Liberalized interest rates would presumably pressure margins.
Japan was the exception to the general rule of rising equity markets in August, as local equities returned -1.2%. Still, given that growth collapsed at nearly a 7% annual pace in the second quarter as the increased consumption tax came into effect, perhaps things could have been worse. After earnings soared in 2013 consensus estimates for the current year are being slashed given ongoing economic weakness. Speculation is rising that the Bank of Japan will expand QE efforts later in the year and that the main government pension fund (GPIF) will expand purchases of domestic equities, but many investors seem to have adopted a “show me the money” mentality. While analysts continue to cite inflation as the solution to Japan’s problems, given demographics and pressure on Japan’s current account, this may be harder and less beneficial than it seems.
Finally, August was a mixed bag for real assets. Commodities fell 1.0% and have now surrendered nearly all of their previous year-to-date gains. Energy supplies have exceeded expectations and fears over political stability in major exporters have (at least temporarily) eased. Many agricultural staples are expected to see bumper crops both in the United States and abroad. Real estate securities (3.3%) fared well but did not keep pace with master limited partnerships (8.2% in August, 21.4% year-to-date), in part because a significant consolidation by Kinder Morgan caused related assets to soar.
The S&P 500 passed the psychologically important 2,000 level, prompting a spate of bearish warnings about future returns from buy- and sell-side strategists. Equity returns are again outpacing earnings growth, which itself has been boosted by one-off factors such as mergers and stock buybacks.
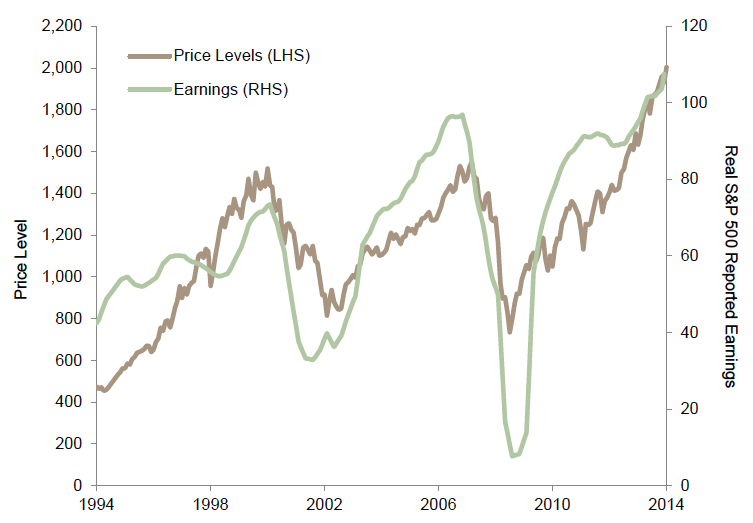
S&P Price Levels and Earnings
August 31, 1994 – August 31, 2014
Sources: Standard & Poor’s and Thomson Reuters Datastream.
Note: Data are monthly.
The euro fell around 1.6% during the month against the US dollar and sits at an 11-month low; the pound fell a similar amount but is basically unchanged against the US dollar year-to-date. Strategists expect cheaper currencies to boost earnings for European companies.
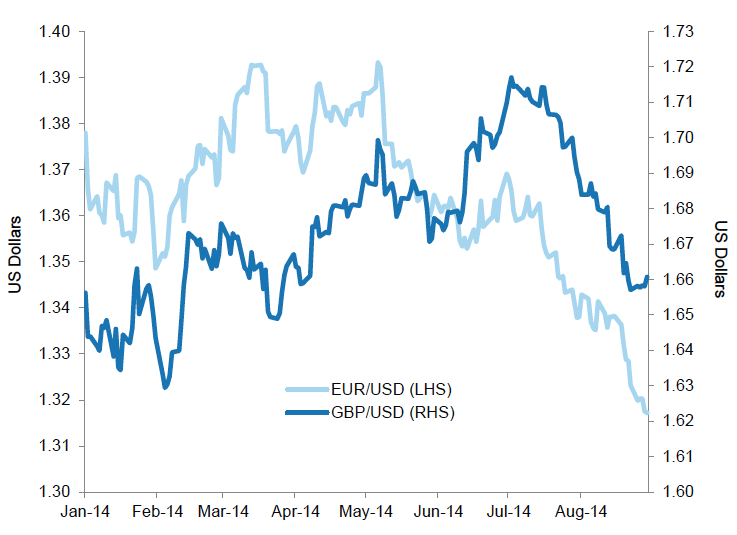
Euro and Sterling versus US Dollar
January 1, 2014 – August 31, 2014
Sources: Thomson Reuters Datastream and WM/Reuters.
The market expects that growth in the United States will outpace that of the Eurozone for some time, resulting in higher relative long-term interest rates. The significant decline in long-term Eurozone interest rates in 2014 has resulted in handsome gains for investors.
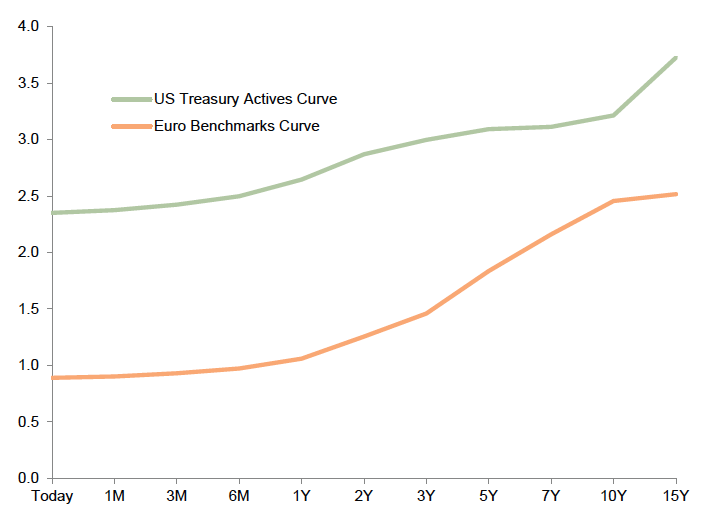
US and Eurozone Forward Ten-Year Curves
As of August 31, 2014
Source: Bloomberg L.P.
The Japanese economy shrank by nearly 7% (annualized) in the second quarter, as a hike in the consumption tax dampened activity and exports failed to benefit from the cheaper yen. Still, stocks suffered only minimal losses as hopes rose for a corporate tax cut and greater buying of equities by the largest government pension fund.
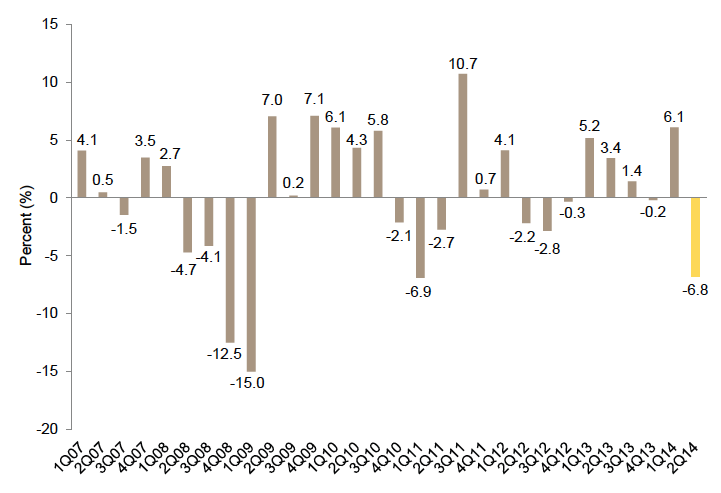
Japanese GDP (Quarter-over-Quarter Annualized)
First Quarter 2007 – Second Quarter 2014
Sources: Economic and Social Research Institute (ESRI), Cabinet Office for the Government of Japan, and Thomson Reuters Datastream.
The S&P 500 recorded its strongest gains since February, as growth improved and Yellen made dovish comments at Jackson Hole. Commodities declined, erasing what remained of year-to-date returns as supply concerns faded for agricultural crops and energy, and as gold miners continued to boost production in spite of easing demand.
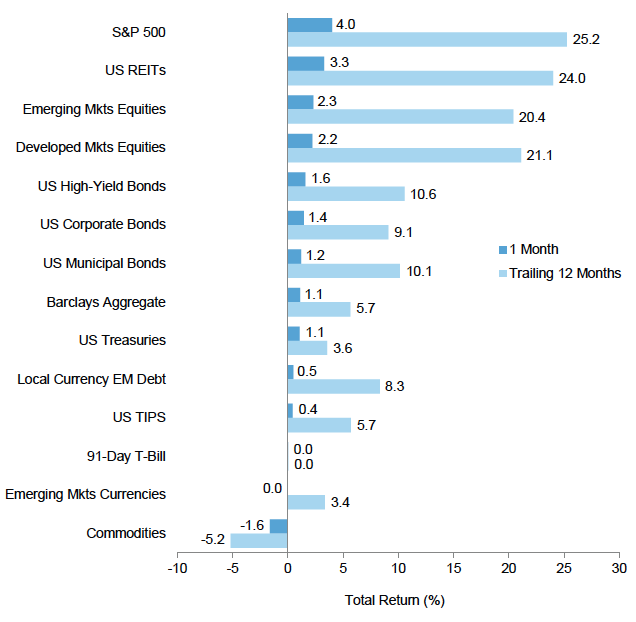
Index Performance (US$)
As of August 31, 2014
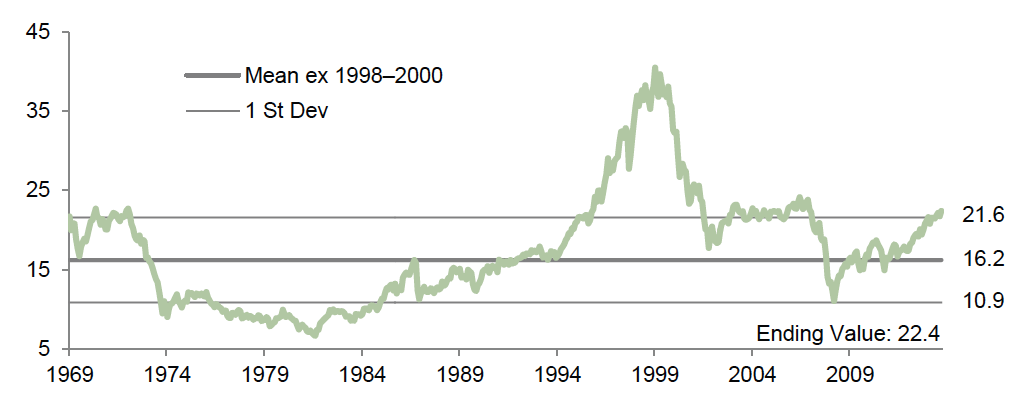
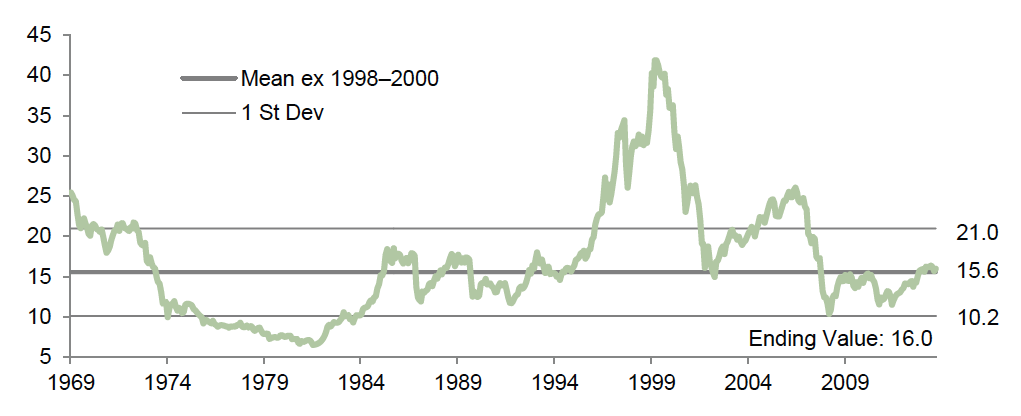
MSCI US Composite Normalized P/E
December 31, 1969 – August 31, 2014
Sources: Barclays, BofA Merrill Lynch, FTSE International Limited, J.P. Morgan Securities, Inc., MSCI Inc., National Association of Real Estate Investment Trusts, Standard & Poor’s, and Thomson Reuters Datastream. MSCI data provided “as is” without any express or implied warranties.
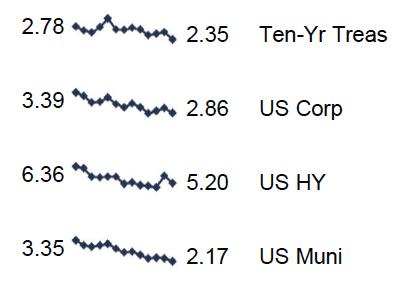
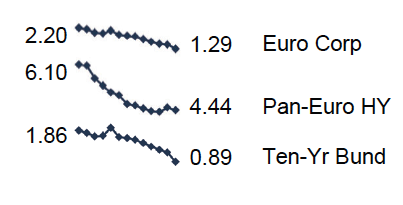
Fixed Income Yields
August 2013 – August 2014
Growth disappointed, inflation fell to the lowest levels in five years, and ECB President Mario Draghi hinted at more stimulus, spurring further gains for bonds. Eurozone sovereign bonds have returned 10% in 2014, nearly twice the return for local equities.
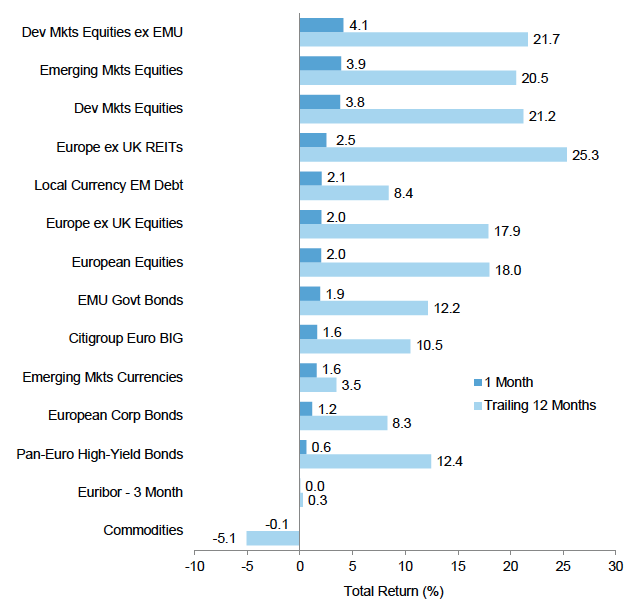
Index Performance (€)
As of August 31, 2014
MSCI Europe ex UK Composite Normalized P/E
December 31, 1969 – August 31, 2014
Sources: Barclays, BofA Merrill Lynch, Citigroup Global Markets, EPRA, FTSE International Limited, MSCI Inc., J.P. Morgan Securities, Inc., National Association of Real Estate Investment Trusts, Standard & Poor’s, and Thomson Reuters Datastream. MSCI data provided “as is” without any express or implied warranties.
Fixed Income Yields
August 2013 – August 2014
Weaker-than-expected inflation numbers and central banker comments combined to generate strong returns for UK gilts and inflation-linked securities, despite two Monetary Policy Committee members at the BOE effectively voting in favor of a rate hike. The FTSE® All- Share could not keep up with developed markets peers as the pound fell during the month.
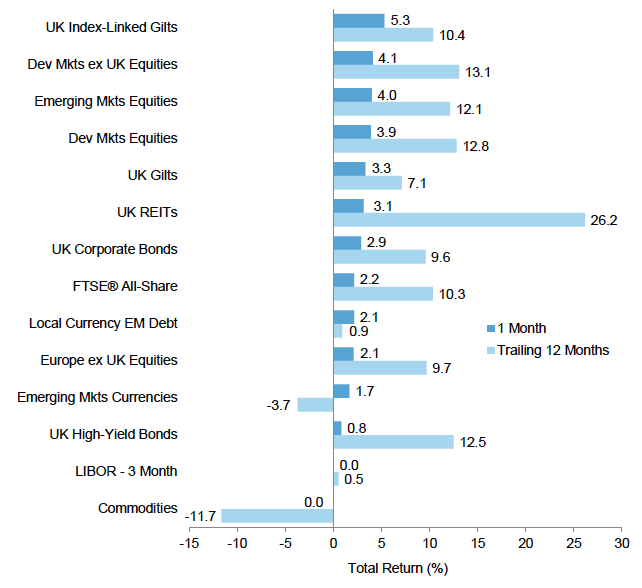
Index Performance (₤)
As of August 31, 2014
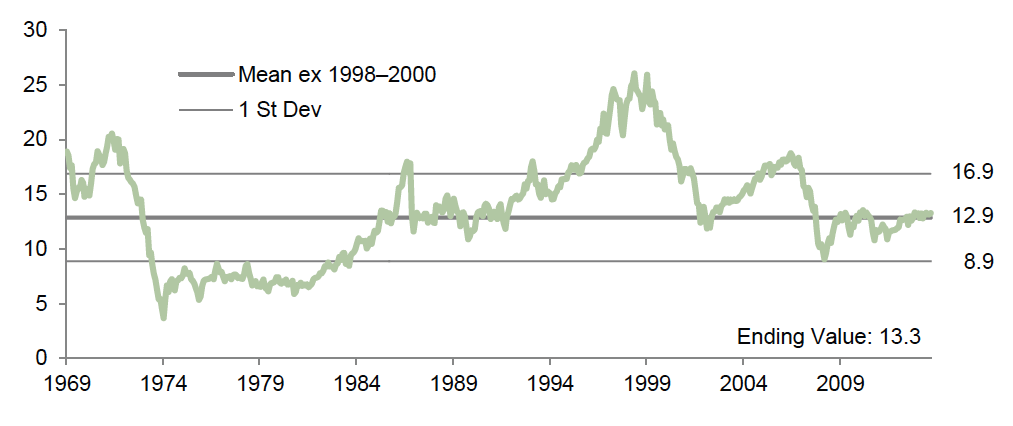
MSCI UK Composite Normalized P/E
December 31, 1969 – August 31, 2014
Sources: Barclays, BofA Merrill Lynch, EPRA, FTSE International Limited, J.P. Morgan Securities, Inc., MSCI Inc., National Association of Real Estate Investment Trusts, Standard & Poor’s, and Thomson Reuters Datastream. MSCI data provided “as is” without any express or implied warranties.
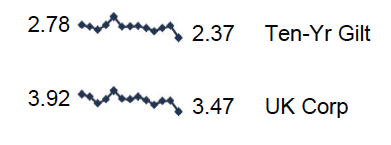
Fixed Income Yields
August 2013 – August 2014
The Fed and BOE signaled at Jackson Hole that they were considering pulling back on monetary stimulus while the ECB and BOJ conceded they may need to do more. Still, the US dollar was the outright winner during the month, appreciating against a variety of developed and emerging markets peers.
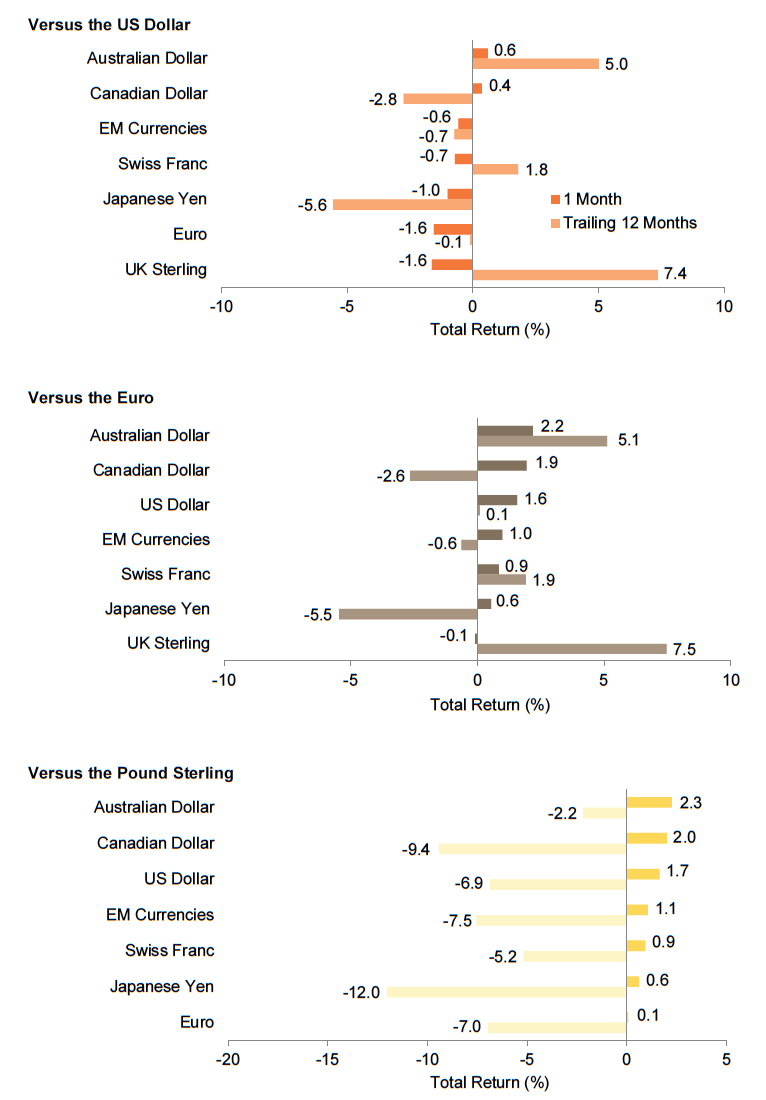
Currency Performance
As of August 31, 2014
Sources: MSCI Inc. and Thomson Reuters Datastream. MSCI data provided “as is” without any express or implied warranties.
Note: EM currencies is an equal-weighted basket of 20 currencies.
Exhibit Notes
Performance Exhibits
Total returns for MSCI developed markets indexes are net of dividend taxes. Total returns for MSCI emerging markets indexes are gross of dividend taxes.
US dollar index performance chart includes performance for the Barclays Corporate Investment Grade, Barclays High Yield Bond, Barclays Municipal Bond, Barclays US TIPS, Barclays US Treasuries, BofA Merrill Lynch 91-Day Treasury Bills, FTSE® NAREIT All Equity REITs, J.P. Morgan ELMI+, J.P. Morgan GBI-EM Global Diversified, MSCI Emerging Markets, MSCI World, and S&P GSCI™ indexes.
Euro index performance chart includes performance for the Barclays Euro-Aggregate: Corporate, Barclays Pan- Euro High Yield, Citigroup EMU Govt Bonds, FTSE® EPRA/NAREIT Europe ex UK RE, J.P. Morgan ELMI+, J.P. Morgan GBI-EM Global Diversified, MSCI Emerging Markets, MSCI Europe, MSCI Europe ex UK, MSCI World ex EMU, MSCI World, and S&P GSCI™ indexes.
UK sterling index performance chart includes performance for the Barclays Sterling Agg Corps, BofA Merrill Lynch Sterling High Yield, FTSE® British Government All Stocks, FTSE® British Government Index-Linked All Stocks, FTSE® EPRA/NAREIT UK RE, J.P. Morgan ELMI+, J.P. Morgan GBI-EM Global Diversified, MSCI Emerging Markets, MSCI Europe ex UK, MSCI World, MSCI World ex UK, and S&P GSCI™ indexes.
Valuation Exhibits
The composite normalized P/E ratio is calculated by dividing the inflation-adjusted index price by the simple average of three normalized earnings metrics: ten-year average real earnings (i.e., Shiller earnings), trend-line earnings, and return on equity–adjusted earnings. We have removed the bubble years 1998–2000 from our mean and standard deviation calculations. All data are monthly.