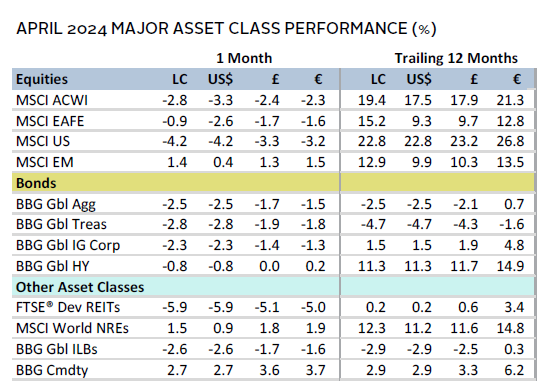
Global equities and bonds declined in tandem in April, driven by diminished prospects for Federal Reserve rate cuts. US equities were the primary laggard among developed markets (DM) as tech-related shares detracted, driving global growth stocks to lag value. Emerging markets (EM) stocks outperformed, led by a standout rally for Chinese equities. Bond markets declined steeply as government bond yields pushed higher. Real assets performance was mixed amid conflicting signals from a stronger US dollar, higher bond yields, rebounding global growth, and escalating tensions in the Middle East. Higher US interest rate expectations supported the US dollar, while the euro and UK sterling were mixed, and the Japanese yen depreciated sharply.
Sources: Bloomberg Index Services Limited, Bloomberg L.P., EPRA, FTSE International Limited, MSCI Inc., National Association of Real Estate Investment Trusts, and Thomson Reuters Datastream. MSCI data provided “as is” without any express or implied warranties.
Note: Local currency returns for the Bloomberg fixed income indexes, the Bloomberg Commodity Index, and the FTSE® Developed REITs are in USD terms.
The Macro Picture
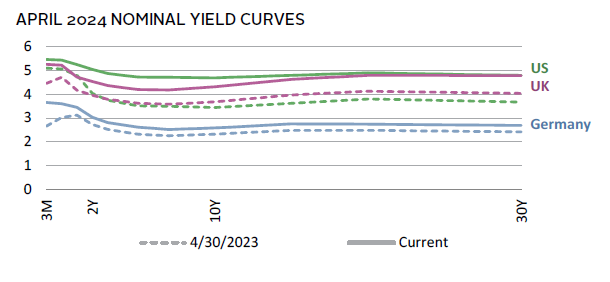
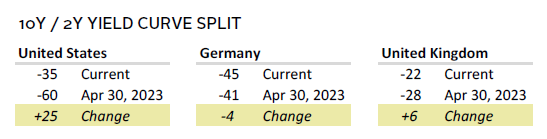
Hotter-than-anticipated US economic data and inflation weighed on performance across a broad swath of assets. US CPI surprised to the upside for a fourth straight month as the trend in shorter-term inflation inflected sharply higher. This forced investors to further dial back Fed rate cut expectations in 2024 to just one 25-basis point (bp) cut during the second half of the year. Chair Jerome Powell echoed this sentiment, effectively walking back earlier Fed expectations of three cuts in 2024. All told, the ten-year US Treasury yield surged nearly 50 bps in April, reaching the highest levels since late 2023, just prior to the dovish pivot.
The narrative diverged among other major DMs, as flash PMI data pointed to stronger economic activity. Eurozone core inflation cooled more than expected and guidance from the European Central Bank (ECB) cemented the prospect for a June rate cut. Meanwhile, the value of the Japanese yen continued declining, touching a new 34-year low against the dollar. The Bank of Japan (BOJ) held policy steady in April but has signaled further tightening this year.
Chinese equities were one of the few bright spots among major stock markets. The economy grew faster than expected in Q1 2024 and signs of a manufacturing rebound lifted sentiment. Still, the economy lost momentum in March, domestic demand remained weak, and stronger Q1 growth potentially lowered the odds of broader stimulus to be introduced this year. Optimism on a rebound in Chinese activity—coupled with escalating tensions in the Middle East—lifted commodity prices, particularly for industrial metals such as copper.
Equities
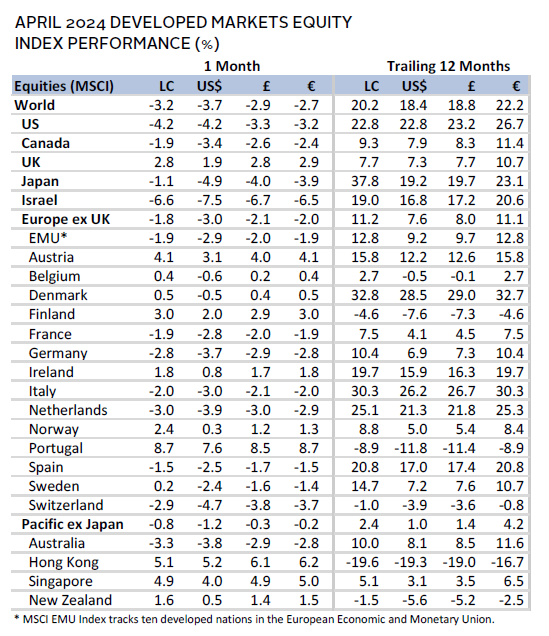
US equities underperformed global peers in April as higher interest rate expectations weighed on the tech-heavy market. Macro risks superseded optimism for artificial intelligence (AI), which has driven performance this year, despite strong earnings reports from mega-cap tech stocks. Sector performance reflected this dynamic, with utilities as the only sector to advance, whereas information technology and consumer discretionary declined mid-single digits. Rate-sensitive real estate fell the most, while healthcare lost more than 5%, as 2025 Medicare payment rates came in lower than expected, weighing on the profit outlook. Taken together, growth edged out value, while small caps trailed large caps.
Stickier-than-expected inflation weighed on sentiment in April. Core CPI held steady in March at 3.8% year-over-year (YOY) versus expectations for further cooling to 3.7%. Recent inflation has been driven by the so-called supercore category, which strips out housing in addition to food and energy. Although Q1 GDP of 1.6% annualized fell short of expectations—raising concerns of stagflation—growth slowed due to volatile factors, including trade, government spending, and inventories. Growth in business and residential investment increased, while consumer spending expanded at a healthy clip, suggesting that underlying demand remained solid. Other economic data were mixed. Employment, wages, and retail sales outperformed expectations, but April PMI data indicated that economic activity expanded at the slowest rate in four months, driven by declining new orders. Consumer confidence unexpectedly fell to the lowest since mid-2022.
European equities led broader DM shares for a second straight month. UK stocks outperformed all major DM regions, with the FTSE 100 Index rising to new all-time highs.
The Eurozone economy emerged from a technical recession in Q1 2024, expanding faster than expected at 0.3%. All major economies beat consensus expectations. German GDP growth of 0.2% was supported by higher investment and exports, whereas household spending weakened. Despite ongoing pressure in the manufacturing sector, German sentiment indicators improved. The April flash PMI report suggested that broader Eurozone business activity expanded at the fastest rate in 11 months, driven by services. With the bloc’s core inflation cooling to 2.7% YOY in April, markets widely expect the ECB will cut rates in June. Indeed, ECB President Christine Lagarde flagged they are prepared to decouple from the Fed’s higher-for-longer policy stance.
UK equities were supported by several factors. Markets now expect the Bank of England (BOE) will cut rates before the Fed, as core inflation continued cooling (4.2% YOY in March). UK sterling weakness vis-à-vis the US dollar supports the earnings outlook as nearly 30% of UK index sales are generated from the United States. Rising commodity prices bolstered returns, given that roughly one-quarter of the index’s market cap is concentrated in resource-intensive sectors. Moreover, UK GDP expanded for a second straight month in February, suggesting the economy has exited the technical recession. Flash PMI data for April pointed to continued expansion at the start of Q2, with the gauge of economic activity at an 11-month high.
Japanese equities outperformed broader DMs for a fourth straight month in local currency terms. However, continued currency weakness meant that Japanese stocks underperformed in major currency terms. Indeed, the yen depreciated almost 4% versus the US dollar, reaching fresh 34-year lows, as bearish positioning against the currency reached a new record. Speculation built that authorities had finally intervened to support the yen after briefly depreciating to 160/USD. Markets expect some degree of further BOJ policy tightening this year—although the timing remains uncertain—as officials have flagged inflationary risks from the yen’s depreciation. April’s flash PMI data suggested business activity reached an eight-month high, driven by robust new order activity. Other data were largely mixed, although core inflation rates continued cooling.
Pacific ex Japan equities bested broader DMs, with both Singapore and Hong Kong outperforming. These markets rallied in part due to rebounding sentiment toward China, given their close economic linkages. However, Australian markets declined, as higher-than-expected inflation clouded the outlook for central bank policy. Quarterly inflation accelerated to 1.0% in Q1 2024, topping expectations and tracking ahead of the Reserve Bank of Australia’s (RBA) projections. Sticky services inflation was the main culprit, with strong activity in the sector pushing April’s composite PMI to a 24-month high. Analysts have delayed their timing for expected RBA rate cuts, as uncertainty remains around potential for rising wages and tax cuts. Quarterly inflation in New Zealand came in softer than expected at 0.6% in Q1, and the unemployment rate increased. Still, the Reserve Bank of New Zealand has flagged that any easing is unlikely until 2025.
Sources: MSCI Inc. and Thomson Reuters Datastream. MSCI data provided “as is” without any express or implied warranties.
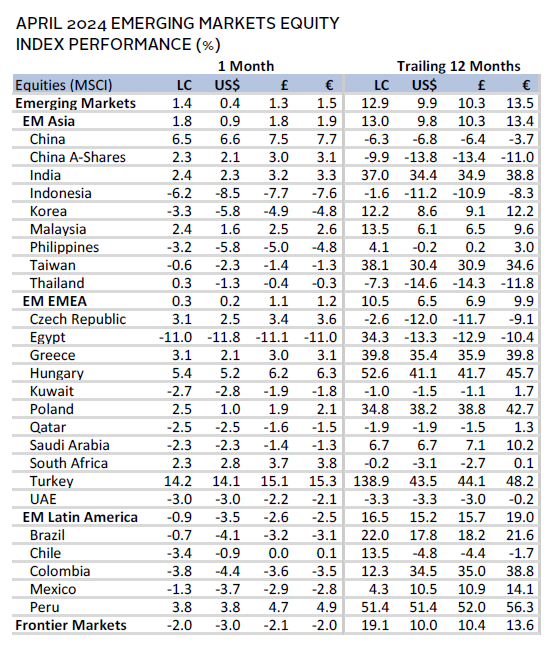
Emerging markets equities gained, with performance largely attributed to a rebound in Chinese equities. Ex China, the index slightly declined but still outperformed DMs. Asia delivered top returns among major EM regions, although both Korea and Taiwan declined. Q1 GDP growth for both countries topped expectations on strong export demand; however, semiconductor stalwarts, such as Taiwan Semiconductor Manufacturing Company (TSMC), generally forecasted chip demand that underwhelmed market expectations. China aside, India was the top contributor to performance, as economic momentum strengthened. Indeed, flash PMI data for April suggested that aggregate activity expanded at the fastest rate since mid-2010. Performance among the Europe, Middle East & Africa and Latin America regions was more mixed, as delayed Fed easing and the risk of capital outflows raised the prospect of rate hikes among several economies.
Chinese equities gained for a third straight month, supported by foreign investor inflows. Economic green shoots, rhetoric around increased policy support, and depressed valuations have contributed to this rally. The Chinese economy expanded 5.3% YOY in Q1 2024, driven by exports and investment. Manufacturing activity also expanded for a second straight month in April, according to official measures. Still, data were not uniformly positive, as economic momentum softened in March. While the above-target Q1 GDP print appeared to question the need for additional stimulus, authorities pledged more support for the economy, property sector, and stock market, with further updates telegraphed for July. The recent bounce in performance comes on the heels of all-time low equity valuations in China, suggesting a low hurdle for positive news to support returns.
Sources: MSCI Inc. and Thomson Reuters Datastream. MSCI data provided “as is” without any express or implied warranties.
Fixed Income
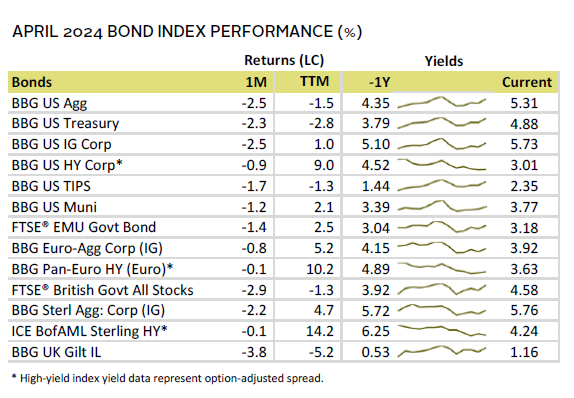
US fixed income assets declined across the board as the ten-year US Treasury yield rose 49 bps to 4.69%. Robust economic data, an uptick in shorter-term inflation trends, and relatively hawkish Fed commentary led investors to price in fewer rate cuts. These macro data coincided with a sharp increase in Treasury supply, with record auction sizes at certain maturities during the month. Investment-grade bonds lagged, whereas high-yield corporates outperformed amid economic strength. The US Treasury index has now declined 3.3% year-to-date (YTD), unwinding the gains from the Fed’s dovish pivot late last year. Ten-year breakeven inflation expectations pushed higher on the month to 2.41%, but real yields were the key driver, with ten-year TIPS yields increasing 40 bps to 2.28%.
Euro- and sterling-denominated fixed income performance largely reflected that of their US peers despite more favorable inflation dynamics and little-changed expectations for policy rate cuts this year. Ten-year UK gilt yields climbed 42 bps to 4.32%, while ten-year German bund yields were up a milder 29 bps to 2.58%. High-yield corporates for both segments were relatively flat, maintaining their YTD double-digit gains. ECB rate cut expectations contributed to the tightening of peripheral (i.e., Italy, Spain) debt spreads over bunds, with spreads reaching their lowest month-end point in more than two years.
Sources: Bank of England, Bloomberg Index Services Limited, Federal Reserve, FTSE Fixed Income LLC, FTSE International Limited, Intercontinental Exchange, Inc., and Thomson Reuters Datastream.
Real Assets
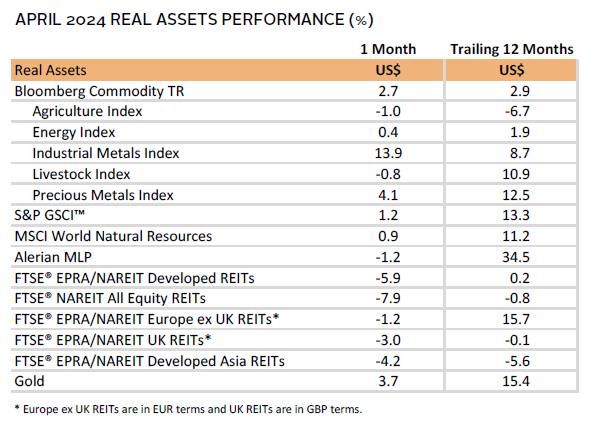
Real assets performance was mixed in April. Optimism on improving global demand drove commodities higher, with notable gains for copper. While copper prices serve as a barometer for global economic health, the recent rally in part reflects expectations of higher demand from the electrification needs of AI computing and electric vehicle infrastructure.
Oil price ($87.86 for Brent and $81.93 for WTI) momentum stalled after strong returns last month. Prices peaked in early April, with Brent surpassing $91/barrel as geopolitical tensions in the Middle East rose, but upward pressures have since cooled.
Global natural resources equities edged higher following March’s gains of more than 9%, supported by underlying commodity prices and positive earnings surprises. Iron ore prices rose to their highest level since June 2022 on enthusiasm around government support for China’s property sector. BHP’s $39B bid for Anglo-American has also put a spotlight on the mining sector.
Interest rate–sensitive REITs fell, extending YTD declines. Bond yields pushed higher as investors pared down expectations of a policy rate cut in the United States.
Gold prices ($2,296.49) shrugged off concerns from higher bond yields and a stronger US dollar. Performance was driven by its safe-haven status amid escalating geopolitical tensions, along with its role as a store of value, given the recent uptick in US inflation. Growing fiscal deficits and perceived risks to financial stability may also be supporting gold in today’s environment.
Sources: Alerian, Bloomberg L.P., EPRA, FTSE International Limited, Intercontinental Exchange, Inc., MSCI Inc., National Association of Real Estate Investment Trusts, Standard & Poor’s, and Thomson Reuters Datastream. MSCI data provided “as is” without any express or implied warranties.
Note: Gold performance based on spot price return.
USD-Based Investors
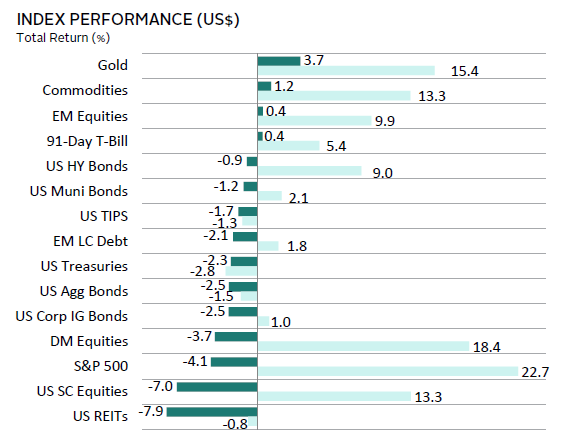
Most asset classes declined in April as stubbornly high US inflation further delayed expectations of a Fed rate cut. This dynamic pressured the tech-heavy US market, which trailed broader DMs and EMs. The latter outperformed due to a strong rally in Chinese equities. All bond categories finished in the red as government bond yields moved sharply higher. Some real assets were among the beneficiaries in April, particularly gold and industrial metals, notwithstanding declines in US REITs.
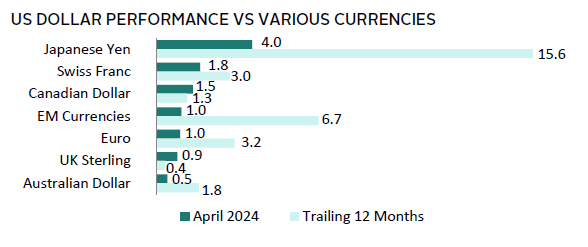
The US dollar broadly gained in April, as interest-rate differentials continued widening in favor of the greenback. The US dollar was up the most versus the Japanese yen, Swiss franc, and Canadian dollar. Its value also increased across the board over the prior 12-month period.
Core CPI held steady in March at 3.8% YOY, versus expectations for further cooling to 3.7%. Recent inflation has been driven by the so-called supercore category, which strips out housing in addition to food and energy. Although Q1 GDP of 1.6% annualized fell short of expectations—raising concerns of stagflation—growth slowed due to volatile factors, including trade, government spending, and inventories. Growth in business and residential investment increased, while consumer spending expanded at a healthy clip, suggesting that underlying demand remained solid. Other economic data were mixed. Employment, wages, retail sales, and industrial production outperformed expectations, but April PMI data indicated that economic activity expanded at the slowest rate in four months, driven by declining new orders. Consumer confidence also unexpectedly fell to the lowest since mid-2022.
Sources: Bloomberg Index Services Limited, FTSE International Limited, Frank Russell Company, Intercontinental Exchange, Inc., J.P. Morgan Securities, Inc., MSCI Inc., National Association of Real Estate Investment Trusts, Standard & Poor’s, and Thomson Reuters Datastream. MSCI data provided “as is” without any express or implied warranties.
EUR-Based Investors
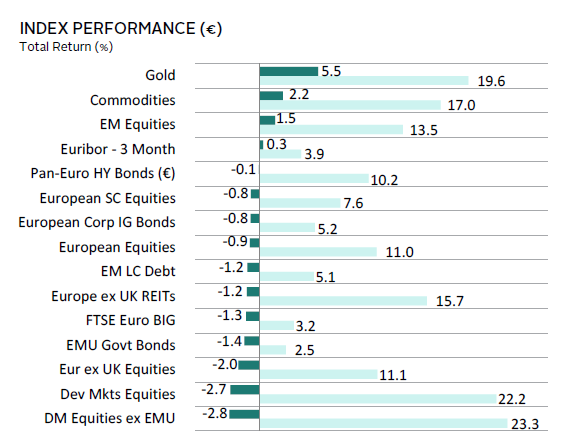
Most asset classes declined in April as stubbornly high US inflation further delayed expectations of a Fed rate cut. This dynamic pressured asset values across the globe. Equity markets declined, with Europe ex UK and European small caps outperforming broader DM shares. EM stocks outperformed due to a strong rally in Chinese equities. All bond categories finished in the red as government bond yields moved sharply higher. Some real assets were among the beneficiaries in April, particularly gold and industrial metals, notwithstanding declines in Europe ex UK REITs.
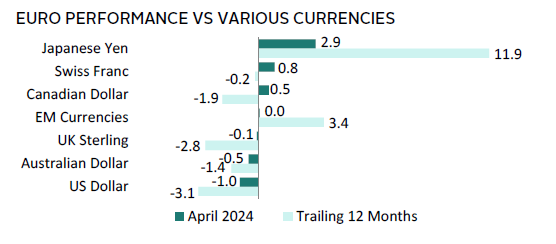
Euro performance was mixed in April, gaining in value versus the typically safe-haven Japanese yen and Swiss franc. However, it depreciated vis-à-vis the US and Australian dollars, where inflation came in hotter than expected. The euro was similarly mixed over the past 12-month period, with notable depreciation versus the US dollar and UK sterling.
The Eurozone economy emerged from a technical recession in Q1 2024, expanding faster than expected at 0.3%. All major economies beat consensus expectations. German GDP growth of 0.2% was supported by higher investment and exports, whereas consumer spending weakened. Despite ongoing pressure in its manufacturing sector, German sentiment indicators improved. The April flash PMI report suggested that broader Eurozone business activity expanded at the fastest rate in 11 months, driven by services. With the bloc’s core inflation cooling to 2.7% YOY in April, markets widely expect the ECB will cut rates in June. Indeed, ECB President Lagarde flagged they are prepared to decouple from the Fed’s higher-for-longer policy stance.
Sources: Bloomberg Index Services Limited, EPRA, European Banking Federation, FTSE Fixed Income LLC, FTSE International Limited, Intercontinental Exchange, Inc., J.P. Morgan Securities, Inc., MSCI Inc., National Association of Real Estate Investment Trusts, Standard & Poor’s, and Thomson Reuters Datastream. MSCI data provided “as is” without any express or implied warranties.
GBP-Based Investors
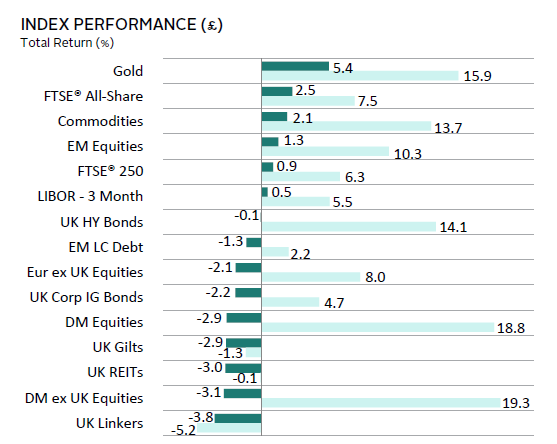
Most asset classes declined in April as stubbornly high US inflation further delayed expectations of a Fed rate cut. UK equities were among the exception, with the FTSE 100 Index rising to all-time highs. EM equities also outperformed, due to strong a strong rally in Chinese stocks. All bond categories finished in the red as government bond yields moved sharply higher. Some real assets were among the beneficiaries in April, particularly gold and industrial metals, notwithstanding declines in UK REITs.
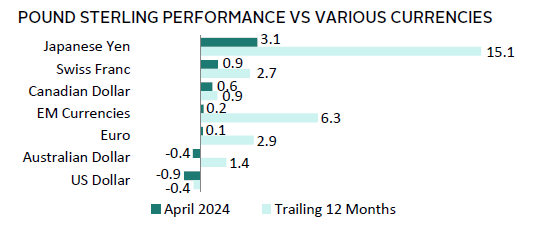
UK sterling mostly strengthened in April, save for against the US and Australian dollars, where inflation came in hotter than expected. The pound has broadly appreciated over the past 12 months, declining in value against only the US dollar, among the major currencies we track.
UK equities were supported by several factors. Markets now expect the BOE will cut rates before the Fed, as core inflation continued cooling (4.2% YOY in March). UK sterling weakness vis-à-vis the US dollar supports the earnings outlook as nearly 30% of UK index sales are generated from the United States. Rising commodity prices bolstered returns, as roughly one-quarter of the index’s market cap is concentrated in resource-intensive sectors. Moreover, UK GDP expanded for a second straight month in February, suggesting the economy has exited the technical recession. Flash PMI data for April pointed to continued expansion at the start of Q2, with the gauge of economic activity at an 11-month high.
Sources: Bloomberg Index Services Limited, EPRA, FTSE International Limited, Intercontinental Exchange, Inc., J.P. Morgan Securities, Inc., MSCI Inc., National Association of Real Estate Investment Trusts, Standard & Poor’s, and Thomson Reuters Datastream. MSCI data provided “as is” without any express or implied warranties.
Performance Exhibits
All data are total returns unless otherwise noted. Total return data for all MSCI indexes are net of dividend taxes.
USD-Based Investors index performance chart includes performance for the Bloomberg US Aggregate Bond, Bloomberg US Corporate Investment Grade, Bloomberg US High Yield Bond, Bloomberg Municipal Bond, Bloomberg US TIPS, Bloomberg US Treasuries, ICE BofAML 91-Day Treasury Bills, FTSE® NAREIT All Equity REITs, J.P. Morgan GBI-EM Global Diversified, LBMA Gold Price, MSCI Emerging Markets, MSCI World, Russell 2000®, S&P 500, and S&P GSCI™ indexes.
EUR-Based Investors index performance chart includes performance for the Bloomberg Euro-Aggregate: Corporate, Bloomberg Pan-Euro High Yield (Euro), EURIBOR 3M, FTSE EMU Govt Bonds, FTSE Euro Broad Investment-Grade Bonds, FTSE® EPRA/NAREIT Europe ex UK RE, J.P. Morgan GBI-EM Global Diversified, LBMA Gold Price AM, MSCI Emerging Markets, MSCI Europe, MSCI Europe ex UK, MSCI Europe Small-Cap, MSCI World ex EMU, MSCI World, and S&P GSCI™ indexes.
GBP-Based Investors index performance chart includes performance for the Bloomberg Sterling Aggregate: Corporate Bond, Bloomberg Sterling Index-Linked Gilts, ICE BofAML Sterling High Yield, FTSE® 250, FTSE® All-Share, FTSE® British Government All Stocks, FTSE® EPRA/NAREIT UK RE, J.P. Morgan GBI-EM Global Diversified, LBMA Gold Price AM, LIBOR 3M GBP, MSCI Emerging Markets, MSCI Europe ex UK, MSCI World, MSCI World ex UK, and S&P GSCI™ indexes.
EM currencies is an equal-weighted basket of 20 emerging markets currencies.
Fixed Income Performance Table
Performance data for US TIPS reflect the Bloomberg US TIPS Index, with yields represented by the Bloomberg Global Inflation Linked Bond Index: US.