Risk assets generally advanced in April. Equities outperformed bonds and developed markets (DM) equities bested emerging markets (EM) counterparts, which declined. European equities led developed markets, driven by strong performance in the United Kingdom. Value equities outperformed growth counterparts in April but have lagged materially for the year. Small-cap equities continued to lag large-cap equities. Bonds posted positive returns as yields were relatively flat, with investment-grade corporate and high-yield bonds outperforming government peers. Real assets also performed well, save for declines from broader commodity futures, particularly industrial metals. Among major currencies, the euro and the UK sterling mostly strengthened, while the US dollar was mixed, and the Japanese yen depreciated.

Sources: Bloomberg Index Services Limited, Bloomberg L.P., EPRA, FTSE International Limited, MSCI Inc., National Association of Real Estate Investment Trusts, and Thomson Reuters Datastream. MSCI data provided “as is” without any express or implied warranties.
Note: Local currency returns for the Bloomberg fixed income indexes, the Bloomberg Commodity Index, and the FTSE® Developed REITs are in USD terms.
The Macro Picture
Markets rebounded in April as investors perceived that the threat of contagion from the banking turmoil in March was contained. Investors walked back expectations for imminent rate cuts, while still stubbornly high inflation data provoked investors to reprice the near-term rate outlook. For instance, the UK inflation rate of 10.1% year-over-year (YOY) exceeded expectations, resulting in the highest rate among G7 countries. Additionally, the European Central Bank (ECB), Bank of England (BOE), and Federal Reserve reiterated their commitment to curbing inflation, with markets pricing in a more than 90% chance of a 25-basis point (bp) rate hike at the May Fed meeting. In the United States, First Republic Bank (FRC) captivated markets as the stock tumbled 75% in April after losing $100 billion in deposits in the first quarter. It was seized by regulators and mostly sold to JPMorgan shortly after month end.
The International Monetary Fund (IMF) added credence to the theme of slowing economies, lowering global GDP growth expectations on stickier-than-expected inflation, citing that financial stress could add further downside risk. Although earnings in the United States are pointing to another quarter of declines, investor anxiety was tempered as technology giants posted better-than-expected results. Oil prices also reflected the deteriorating economic sentiment. Prices rose nearly 10% by mid-month after OPEC said it would cut production by 1.7 million barrels per day (mmb/d), but ultimately ended lower, given the waning demand outlook. Still, as the rest of the world grappled with slowing activity, China stood out with GDP growth ahead of expectations at 4.5% YOY. The robust rebound was largely driven by the comeback of the Chinese consumer, after spending had been constrained due to its zero-COVID policy last year.
Equities
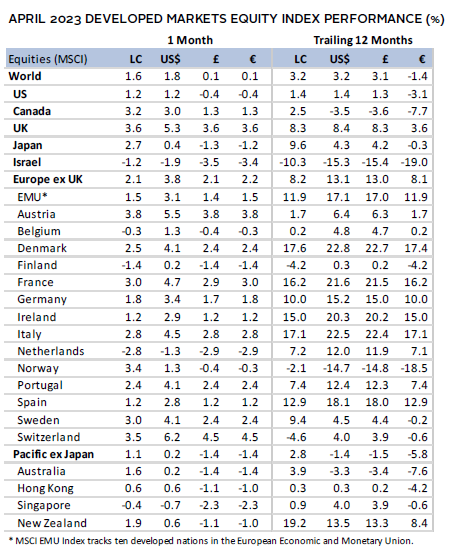
US equities lagged DM markets in April. Fears of slowing growth and an impasse on lifting the debt ceiling weighed on market sentiment, but positive earnings from tech heavy hitters led to a strong finish for April. US first quarter GDP growth disappointed, slowing to 1.1% annualized versus 2.6% in the prior quarter. While consumer spending remained robust, business inventories and residential housing investment declined. Investor anxiety grew as lower-than-expected tax revenues for 2022 spurred speculation that the government would reach its debt ceiling sooner than expected. Blended earnings are pointing to an approximately 4% decline in first quarter 2023, following negative growth in fourth quarter 2022. However, nearly 80% of companies surprised to the upside, with the consumer discretionary sector leading growth.
Inflation concerns remain, as wages increased ahead of expectations at 1.2% quarter-over-quarter (QOQ), and the Fed’s preferred gauge held steady at 4.6% YOY in March. There was increased consensus that there was a low risk of contagion stemming from recent bank failures, which led investors to walk back calls for a rate-hike pause in May. Still, the market is predicting a pause, and possible cuts, sometime this year. Indeed, Fed meeting notes suggested the central bank now expects a mild recession later this year because of recent banking sector stress. FRC was seized by regulators and mostly sold to JPMorgan at the beginning of May, marking the second largest bank failure in US history, having lost $100 billion in deposits in the first quarter and a 97% drop in stock price in 2023. Nonetheless, the failure is not expected to trigger broader contagion, as deposit outflows from other regional banks have largely stabilized.
European equities gained, topping broader DM peers as market sentiment improved. The UK outpaced Europe ex UK, while France and Switzerland posted relatively strong returns among larger countries within continental Europe.
Euro area preliminary first quarter GDP estimates showed modest growth of 0.1% QOQ, slightly below expectations. Stagnation in Germany was offset with growth from Italy and Spain (0.5% for both). The French and German economies suffered in part due to labor strikes. Markets now expect the ECB will hike by 25 bps in May (compared to 50 bps at their previous meeting in March), as preliminary CPI estimates have come in softer than expected. Most countries—including Spain and Germany—are showing slight cooling in inflation, except for France, where inflation has remained stubbornly elevated.
UK equity performance was among the strongest in DMs, although most data during April was disappointing. Business morale struck an optimistic chord, likely on expectations of hitting peak inflation. Investors broadly expect the economy contracted in the first quarter, with February’s monthly GDP report already signaling that the economy is stalling. Survey data indicated that the manufacturing sector contracted, while construction was nearly flat. Dissatisfaction with higher prices has led to strikes by some public sector employees, adding further pressure. Indeed, the United Kingdom is one of only two advanced economies that the IMF forecasts will contract in 2023. The market priced in a 25-bp rate hike at the next BOE meeting on higher-than-expected inflation, versus previous estimates of a pause. Core inflation, however, was unchanged at 6.2% YOY, while headline inflation remained above 10%, largely driven by higher energy and food prices.
Japanese equities bested DM markets, as the yen continued to weaken. Bank of Japan Governor Kazuo Ueda took office in April and shared that monetary policy would remain dovish. He remains committed to ultra-low interest rates, although will conduct a policy review, emphasizing that any changes would be gradually implemented. Several data points released during April highlighted economic challenges. Demographic data showed that the population shrank for the 12th year in a row. Headline inflation in March declined slightly from the prior month, but core CPI—which excludes fresh food and energy—accelerated. Additionally, export growth in March slowed from the prior month, rising by approximately 4% YOY versus 6.5% in February; declines in demand growth were seen from Asia, Europe, and the United States, while Chinese demand rebounded. Global economic uncertainty and higher input costs from a weakening yen continued weighing on manufacturing sentiment.
Pacific ex Japan equities gained, with performance led by New Zealand and Australia. After ten consecutive rate hikes (3.5 percentage points in increases), the Reserve Bank of Australia (RBA) paused to assess the effectiveness of their policy. However, strong job numbers and a hawkish tone in the RBA’s April minutes led some investors to question whether a rate hike is back on the table in May. While first quarter CPI data showed cooling YOY inflation at 7.0%, inflation remains well above target. The Reserve Bank of New Zealand (RBNZ) hiked rates by a larger- than-expected 50 bps. The RBNZ aims to rein in inflation and demand with the Official Cash Rate now at 5.25%. The aggressive policy stance is one factor weighing on the economic outlook, as the RBNZ now forecasts three consecutive quarters of GDP contraction beginning in second quarter 2023.
Sources: MSCI Inc. and Thomson Reuters Datastream. MSCI data provided “as is” without any express or implied warranties.
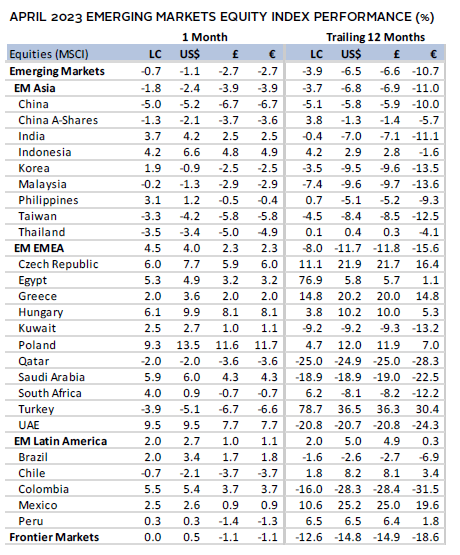
Emerging markets equities lagged their DM peers in April. Returns varied widely—the emerging Europe, Middle East & Africa (EMEA) region led, while Asia lagged. Brazil and India advanced, although performance for both remains negative year-to-date. The largest contributors to returns were the financials and energy sectors, whereas information technology and communication services lagged.
China beat expectations with GDP growing at 4.5% YOY in first quarter 2023, compared to 2.9% in fourth quarter 2022. Growth was boosted by an impressive 10% YOY increase in retail spending in March, the fastest growth in almost two years, aided by the end of their zero-COVID policy. State-owned enterprises equities out-performed private enterprises, reflecting outsized wins from policy tailwinds impacting technology and construction. Still, property investment slowed by approximately 6% YOY in the first quarter and new construction was down almost 20% YOY in March. While exports were strong in March, new orders are slowing, as is manufacturing of popular exports, such as smartphones and computers.
As rate hikes in some EM countries are beginning to impact inflation, some countries are considering, or have already, paused further increases. The Reserve Bank of India (RBI) paused its rate hikes this month, leaving its benchmark repo rate at 6.50%. Despite markets expecting rate cuts later this year, the RBI governor said it was unlikely, as the fight against inflation was “far from over.” Similarly, markets expect easing in rate hikes in Brazil, Colombia, and Mexico by year end, while expectations remain for South Africa to continue increasing rates this year. Elsewhere, South Korea saw industrial production increase at the fastest rate in nearly three years, Taiwan entered a recession in the first quarter, and industrial production in Thailand continued to slow.
Sources: MSCI Inc. and Thomson Reuters Datastream. MSCI data provided “as is” without any express or implied warranties.
Fixed Income
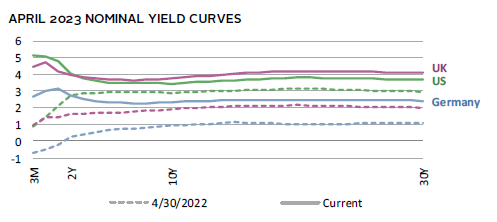
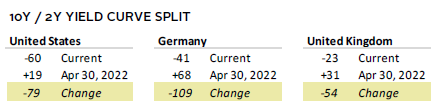
US fixed income assets mostly advanced, as economic growth softened, and yields on Treasuries with maturities greater than one year mostly declined. Concerns of reaching the debt ceiling sooner than expected led to a flight to safety, increasing demand for one-month Treasuries, pushing their yields down nearly 40 bps and blowing out the spread between one- and three-month Treasuries. Commensurately, one-year US T-bill CDS spreads surged to new all-time highs. The two major yield curve spreads (the ten-year/two-year and ten-year/three-month) became marginally more inverted. High-yield corporates outperformed investment-grade equivalents, and inflation-protected Treasuries lagged nominal peers. Five- and ten-year Treasury yields shrank 9 bps and 4 bps to 3.51% and 3.44%, respectively.
Euro- and sterling-denominated high-yield and investment-grade corporate bonds advanced, while EMU government and UK gilts declined. UK linkers lagged nominal gilts. Five- and ten-year gilt yields increased 26 bps each to 3.67% and 3.74 %, respectively, and the ten-year/two-year yield spread held steady, with the curve remaining inverted. German bund ten-year yields were nearly flat, finishing the month at 2.32%, but the two-year yields expanded 3 bps to 2.73%.

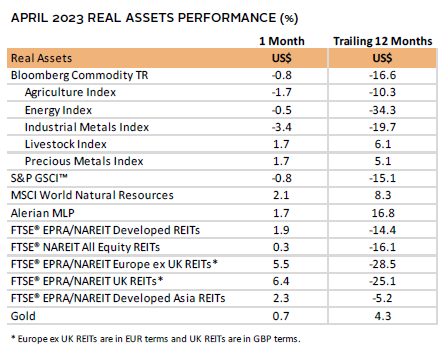
Real Assets
The real asset space was mostly positive this month. Intra-month performance was stronger in the first half, as markets rebounded from the pressures in March, but concerns over weakening demand took hold again. Commodity futures declined for the month, as industrial metals recorded the worst returns. Agriculture and energy also declined, whereas precious metals gained.
Oil prices rose nearly 10% during the first half of the month, before closing roughly flat ($79.54 Brent, $76.78 WTI). The initial increase was attributed to OPEC’s and Russia’s joint surprise announcement that they plan to cut output by 1.7 mmb/d citing weaker demand outlook. The one bright spot on the demand side is China’s economic rebound, especially when considering the return of Chinese tourism.
Global natural resources equities bested underlying commodities, rising more than 2%. Despite the recent retracement of underlying commodity prices, profit growth in the space remains robust.
Global REITs were mixed—Europe ex UK and the United Kingdom were the strongest performers, while US REITs lagged. In the United States, headlines continued to highlight the mounting pressure on office REITs as lending conditions tighten and occupancy remains challenged.
Gold prices rose almost 1% to $1,990.40/troy ounce, similar to levels seen in the summer of 2020 and following Russia’s invasion of Ukraine. The price was supported by a depreciating US dollar and increased demand from central banks in the face of heightened uncertainty.
Sources: Alerian, Bloomberg L.P., EPRA, FTSE International Limited, Intercontinental Exchange, Inc., MSCI Inc., National Association of Real Estate Investment Trusts, Standard & Poor’s, and Thomson Reuters Datastream. MSCI data provided “as is” without any express or implied warranties.
Note: Gold performance based on spot price return.
USD-Based Investors
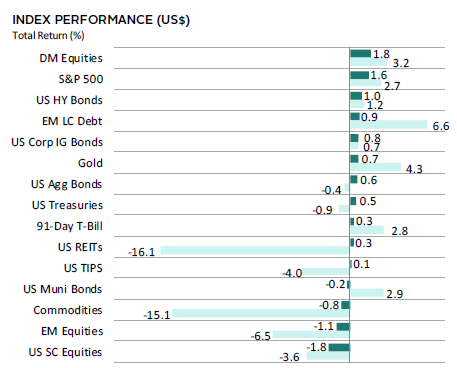
Risk assets generally gained in April, with equities mostly outperforming other broad asset classes, led by DM and US markets. EM equities and US small caps lagged other major asset classes. Recent declines for REITs abated after struggling in prior months, while safe-haven gold modestly advanced over fears of slowing growth. Cash trailed Treasuries, and the yield curve became marginally more inverted during the month, with concerns of reaching the debt ceiling sooner than expected increasing short-term yields. Over the last 12 months, US REITs and commodities were the worst performers, based on concerns of tighter lending conditions and slowing demand.
The US dollar was mixed, falling the most versus the Swiss Franc. It gained notably against the Japanese yen and Australian dollar. Over the last 12 months, the directional movement in the US dollar mimicked the trends in April.
US first quarter GDP growth disappointed, slowing to 1.1% annualized versus 2.6% in fourth quarter 2022. Consumer spending remained robust, but business inventories and residential housing investment declined. Inflation concerns remain, as wages increased ahead of expectations at 1.2% QOQ, and the Fed’s preferred gauge held steady at 4.6% YOY in March. There was increased consensus that there was a low risk of contagion stemming from recent bank failures, which led investors to walk back calls for a rate-hike pause in May. Still, the market is predicting a pause, and possible cuts, sometime this year. Indeed, Fed meeting notes suggested the central bank now expects a mild recession later this year because of recent banking sector stress. FRC was seized by regulators and mostly sold to JPMorgan at the beginning of May, marking the second largest bank failure in US history, having lost $100 billion in deposits in the first quarter and a 97% drop in stock price in 2023.

Sources: Bloomberg Index Services Limited, FTSE International Limited, Frank Russell Company, Intercontinental Exchange, Inc., J.P. Morgan Securities, Inc., MSCI Inc., National Association of Real Estate Investment Trusts, Standard & Poor’s, and Thomson Reuters Datastream. MSCI data provided “as is” without any express or implied warranties.
EUR-Based Investors
Risk assets were mixed in April, with equities mostly outperforming other broad asset classes, led by broader European stocks. EM equities lagged DM counterparts and fixed income assets. REITs rebounded strongly after struggling in prior months, while safe-haven gold was nearly flat. Cash bested EMU government bonds but lagged high-yield and investment-grade corporate bonds. Over the last 12 months, REITs and commodities were the worst performers, based on concerns of tighter lending conditions and slowing demand.
The euro was mostly stronger in April, gaining the most versus the Japanese yen and Australian dollar, and declining only versus the Swiss Franc. Over the trailing 12 months, the common currency similarly advanced most versus the Australian dollar, Canadian dollar, and Japanese yen, but declined versus the safe-haven Swiss franc.
Euro area preliminary first quarter GDP estimates showed modest growth of 0.1% QOQ, slightly below expectations. Stagnation in Germany was offset with growth from Italy and Spain (0.5% for both). The French and German economies suffered in part due to labor strikes. Markets now expect the ECB will hike by 25 bps in May (compared to 50 bps at their previous meeting in March), as preliminary CPI estimates have come in softer than expected. Most countries—including Spain and Germany—are showing slight cooling in inflation, except for France, where inflation has remained stubbornly elevated.


Sources: Bloomberg Index Services Limited, EPRA, European Banking Federation, FTSE Fixed Income LLC, FTSE International Limited, Intercontinental Exchange, Inc., J.P. Morgan Securities, Inc., MSCI Inc., National Association of Real Estate Investment Trusts, Standard & Poor’s, and Thomson Reuters Datastream. MSCI data provided “as is” without any express or implied warranties.
GBP-Based Investors
Risk assets were mixed in April, with equities mostly outperforming other broad asset classes, led by strong performance in domestic and Europe ex UK equities. EM equities lagged DM counterparts and most fixed income assets. REITs rebounded strongly after struggling in prior months, while gold was nearly flat. Cash bested all fixed income assets, except for high-yield bonds. Over the last 12 months, REITs, UK linkers, nominal gilts, and commodities have been the worst performers, based on concerns of high inflation, tighter lending conditions, and slowing demand.
UK sterling mostly advanced in April, gaining the most versus the Japanese yen and Australian dollar, and declining only versus the Swiss Franc. Over the trailing 12 months, the currency similarly advanced the most versus the Australian dollar, Canadian dollar, and Japanese yen, but declined versus the safe-haven Swiss franc and the euro.
UK equity performance was amongst the strongest in DMs, although most data during April was disappointing. Business morale struck an optimistic chord, likely on expectations of hitting peak inflation. Investors broadly expect the economy contracted in the first quarter, with February’s monthly GDP report already signaling that the economy is stalling. Survey data indicated that the manufacturing sector contracted, while construction was nearly flat. Dissatisfaction with higher prices has led to strikes by some public sector employees, adding further pressure. Indeed, the United Kingdom is one of only two advanced economies that the IMF forecasts will contract in 2023. The market priced in a 25-bp rate hike at the next BOE meeting on higher-than-expected inflation, versus previous estimates of a pause. Core inflation, however, was unchanged at 6.2% YOY, while headline inflation remained above 10%, largely driven by higher energy and food prices.


Sources: Bloomberg Index Services Limited, EPRA, FTSE International Limited, Intercontinental Exchange, Inc., J.P. Morgan Securities, Inc., MSCI Inc., National Association of Real Estate Investment Trusts, Standard & Poor’s, and Thomson Reuters Datastream. MSCI data provided “as is” without any express or implied warranties.
Performance Exhibits
All data are total returns unless otherwise noted. Total return data for all MSCI indexes are net of dividend taxes.
USD-Based Investors index performance chart includes performance for the Bloomberg US Aggregate Bond, Bloomberg US Corporate Investment Grade, Bloomberg US High Yield Bond, Bloomberg Municipal Bond, Bloomberg US TIPS, Bloomberg US Treasuries, ICE BofAML 91-Day Treasury Bills, FTSE® NAREIT All Equity REITs, J.P. Morgan GBI-EM Global Diversified, LBMA Gold Price, MSCI Emerging Markets, MSCI World, Russell 2000®, S&P 500, and S&P GSCI™ indexes.
EUR-Based Investors index performance chart includes performance for the Bloomberg Euro-Aggregate: Corporate, Bloomberg Pan-Euro High Yield (Euro), EURIBOR 3M, FTSE EMU Govt Bonds, FTSE Euro Broad Investment-Grade Bonds, FTSE® EPRA/NAREIT Europe ex UK RE, J.P. Morgan GBI-EM Global Diversified, LBMA Gold Price AM, MSCI Emerging Markets, MSCI Europe, MSCI Europe ex UK, MSCI Europe Small-Cap, MSCI World ex EMU, MSCI World, and S&P GSCI™ indexes.
GBP-Based Investors index performance chart includes performance for the Bloomberg Sterling Aggregate: Corporate Bond, Bloomberg Sterling Index-Linked Gilts, ICE BofAML Sterling High Yield, FTSE® 250, FTSE® All-Share, FTSE® British Government All Stocks, FTSE® EPRA/NAREIT UK RE, J.P. Morgan GBI-EM Global Diversified, LBMA Gold Price AM, LIBOR 3M GBP, MSCI Emerging Markets, MSCI Europe ex UK, MSCI World, MSCI World ex UK, and S&P GSCI™ indexes.
EM currencies is an equal-weighted basket of 20 emerging markets currencies.
Fixed Income Performance Table
Performance data for US TIPS reflect the Bloomberg US TIPS Index, with yields represented by the Bloomberg Global Inflation Linked Bond Index: US.