Investors found little respite in April, with most asset classes suffering steep losses. Global equities faltered, dragged down by the United States. Emerging markets stocks lagged developed ex US peers and ended the month in a bear market, having declined 22% from their February 2021 peaks. Value handily outperformed growth and small caps edged large caps, though all four categories declined. Global bond indexes extended declines as yields climbed at the fastest monthly rate since 2003. Commodity futures were among the only asset classes in the black for the month, whereas other real assets declined. The US dollar appreciated to its strongest level in nearly 20 years, the euro mostly weakened, and UK sterling performance was mixed.

Sources: Bloomberg Index Services Limited, Bloomberg L.P., EPRA, FTSE International Limited, MSCI Inc., National Association of Real Estate Investment Trusts, and Thomson Reuters Datastream. MSCI data provided “as is” without any express or implied warranties.
Note: Local currency returns for the Bloomberg fixed income indexes, the Bloomberg Commodity Index, and the FTSE® Developed REITs are in USD terms.
The Macro Picture
April’s market turbulence was largely influenced by surging bond yields as inflation reached new multi-decade highs and expectations of forthcoming monetary tightening escalated. Federal Reserve officials set the stage for a 50-basis point (bp) rate hike in May and hinted at plans to begin reducing the size of the central bank’s balance sheet at the same time. Markets are pricing a 90% probability of an additional, even larger 75-bp hike in June. Rising yields have reduced the amount of debt trading at negative yields, which has fallen more than $13 trillion since year-end 2020 to its lowest level in almost seven years. So-called real yields on inflation-linked bonds have also spiked, with US ten-year TIPS yields ending the month in positive territory for the first time since before the onset of the pandemic. Higher bond yields have pressured equities, weighing most acutely on highly valued growth-oriented sectors. US technology stocks in April saw their worst monthly performance since 2008.
Global economic growth concerns also sapped risk appetite. COVID-19 lockdowns in China clouded the economic outlook amid signs of renewed supply chain disruptions. The ongoing war and catastrophic humanitarian crisis in Ukraine showed few signs of moderating as Russia intensified its offensive on the eastern separatist Donbas region. In its updated economic outlook, the International Monetary Fund (IMF) projected that global economic growth would slow to 3.6% in 2022, representing an 80-bp reduction from estimates before Russia’s invasion of Ukraine. The fund also revised its inflation expectations 180 bps higher to 5.7% for advanced economies in 2022, due in large part to war-induced increases in commodity prices.
Equities
US equities plunged in April, posting their eleventh lowest monthly return since 1970. US shares lagged global ex US peers by the widest margin since 1993, but less so in major currency terms. Fed policy developments and rising bond yields weighed heavily on the tech-dominated US market. Communication services, consumer discretionary, and information technology—which make up nearly half of the S&P 500 Index by market cap—declined by double digits. Commodity-linked materials and energy declined the least among sectors, while consumer staples posted the only gain. These dynamics meant value outperformed growth by the widest margin in more than 20 years, and value now leads by 15 percentage points (ppts) year-to-date. Small caps lagged large caps for the tenth time in the past 12 months.
US economic data released in April were broadly constructive, bolstering the Fed’s front-loaded policy stance. Real consumer spending expanded for a third consecutive month, preliminary durable goods orders ex transportation—a proxy for business investment—topped expectations, and purchasing manager indexes (PMI) remained strongly expansionary. The labor market remained tight, with the unemployment rate falling to 3.6% and job openings exceeding unemployed people by five million. Headline and core inflation reached their highest levels in 40 years, accelerating to 8.5% and 6.5% year-over-year, respectively, although core goods prices declined month-on-month. Of S&P 500 companies, 80% that have reported first quarter earnings results beat expectations. Earnings are now estimated to have grown 7.1% year-over-year in first quarter versus 4.7% expected at the end of March. However, there have been some notable earnings release misses by Alphabet (Google’s parent company), Amazon, and Netflix, among others.
European equities outperformed global ex US peers. UK stocks advanced for a fifth straight month and outperformed developed markets over the past 12 months by the widest margin in nearly 30 years. UK shares have benefited from relatively undemanding valuations and large exposures to defensive and commodity-linked sectors. Europe ex UK stocks declined but held up better than developed ex US peers.
The eurozone economy faced mounting challenges in April. PMI data remained firmly in expansionary territory, but Europe bore the brunt of the IMF’s growth downgrades. Germany saw its 2022 GDP forecast slashed nearly 2 ppts, the largest cut among developed countries. German input prices rose 30.9% year-over-year in March—the highest rate on record back to 1949—largely due to surging energy costs from the war in Ukraine. Euro area core consumer prices also rose a record 3.5% year-over-year in April. In response to these inflationary pressures, European Central Bank (ECB) officials suggested they could hike rates as early as July, with markets pricing an 80% probability on such an outcome. In the closely watched French presidential election, incumbent Emmanuel Macron defeated far-right and Euroskeptic candidate Marine Le Pen.
High inflation appears to be taking a toll on UK consumers. Headline and core measures accelerated to new 30-year highs in March, reaching 7.0% and 5.7% year-over-year, respectively. Consumer confidence in April dropped to its weakest level since 2008, and March retail sales declined month-on-month more than expected. The IMF projected UK GDP growth of just 1.2% in 2023, the weakest among G7 peers. The deteriorating growth outlook and high inflation has complicated the Bank of England’s (BOE’s) policy calculus.
Japanese equities declined, underperforming developed ex US counterparts. Japanese stocks trailed to a greater degree in major currency terms as the yen’s value foundered. The yen depreciated more than 6% versus the dollar and closed the month near JPY/USD 130, its weakest level in 20 years. The Bank of Japan’s (BOJ’s) policy stance has been extremely accommodative as inflation remains contained, and this divergence from Fed policy has driven widening interest rate spreads versus the United States. In April, the BOJ strengthened its commitment to buy unlimited quantities of ten-year Japanese Government Bonds, if required, to cap yields at 0.25% as part of its yield control policy. Headline inflation only reached 1.2% year-over-year in March, while core prices excluding food and energy declined 0.7%. However, the weak yen may be adding pressure on importers. Producer prices rose 9.5% year-over-year in March, and, in a recent survey, 40% of Japanese firms noted yen weakness had a negative impact on their business.
Pacific ex Japan equities also trailed developed ex US peers. All four countries in the index declined, but Australia held up better than Singapore, Hong Kong, and New Zealand. In a potential foreshadowing of moves by other major developed central banks, the Reserve Bank of New Zealand (RBNZ) raised the benchmark cash rate by 50 bps in April to 1.50%, its largest rate hike in 22 years. The RBNZ reaffirmed its expectation to lift rates to more than 3% by the end of next year as inflation surged 6.9% in first quarter. Home price growth in New Zealand has started cooling, while recent business and consumer confidence measures remained weak. The Reserve Bank of Australia left rates unchanged in April, but with inflation rising 5.1% year-over-year in first quarter, economists now anticipate a hike in early May.

Sources: MSCI Inc. and Thomson Reuters Datastream. MSCI data provided “as is” without any express or implied warranties.
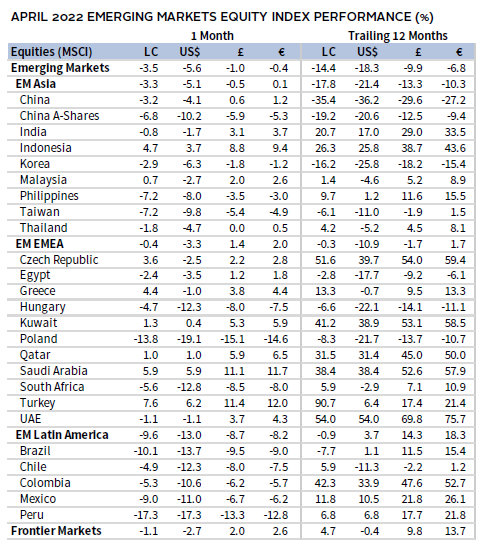
Emerging markets equities declined but outperformed developed peers due to the sharp drawdown in US equities. Emerging stocks lagged the developed ex US benchmark for the tenth time in the last 12 months. Emerging Europe, the Middle East & Africa advanced, outperforming among major emerging regions. Emerging Asia edged broader emerging stocks, while Latin America declined by nearly 10 ppts. Still, Latin America has outperformed the other regions by more than 10 ppts year-to-date. Brazil, Taiwan, and South Africa declined the most among major emerging countries, China, Korea, and India bested the broader index but declined, while Saudi Arabia—which benefitted from higher oil prices and interest rates—advanced.
China’s COVID-19 lockdown measures intensified during the month and dampened the economic outlook. PMI readings across both manufacturing and services fell deeply into contractionary territory, while retail sales fell 3.5% year-over-year in March, missing expectations. Other data were more upbeat but reflected conditions prior to the Shanghai lockdown in late March. First quarter GDP expanded 4.8% year-over-year, topping expectations and accelerating from 4.0% in fourth quarter. The People’s Bank of China (PBOC) cut bank reserve requirement ratios by 25 bps, resulting in a liquidity injection of roughly $80 billion into the economy. However, the PBOC refrained from cutting lending rates as the Chinese renminbi had one of its steepest monthly declines versus the US dollar in decades. Chinese policymakers lowered banks’ foreign exchange deposit reserve requirements in an effort to support the currency. Chinese President Xi Jinping called for an “all out” effort to boost infrastructure construction to support economic growth amid the ailing outlook.
Sources: MSCI Inc. and Thomson Reuters Datastream. MSCI data provided “as is” without any express or implied warranties.
Fixed Income
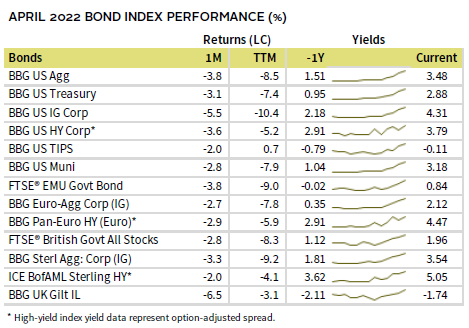
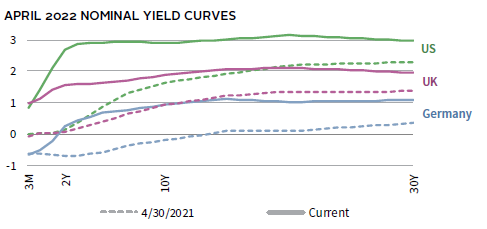
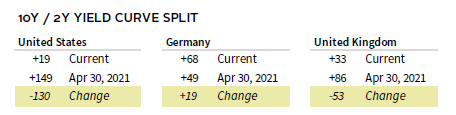
US fixed income assets broadly declined in April as yields surged. Year-to-date investment-grade bond performance was roughly on par with drawdowns in US equities and trailing 12-month performance was the weakest since 1980. Five- and ten-year Treasury yields climbed 50 bps and 57 bps to 2.92% and 2.89%, respectively, while 30-year yields briefly topped 3.00% for the first time since early 2019. The rise in the ten-year tenor was the sharpest since 2009, with rising real yields accounting for nearly all the increase. Ten-year TIPS yields surged 53 bps—the largest monthly climb since the 2013 Taper Tantrum—whereas breakeven inflation rose just 4 bps to 2.88%. The Treasury yield curve steepened but remains relatively flat on a ten-year versus two-year spread basis (19 bps). However, the curve shows a more positive slope when compared to three-month yields (204 bps), which is the Fed’s preferred measure.
April’s sterling- and euro-denominated bond returns were also squarely in the red. Five- and ten-year gilt yields rose 21 bps and 25 bps to 1.63% and 1.88%, respectively. Inflation-linked gilts declined the most among UK bond categories, but index yields remained well below zero. German ten-year bund yields rose 38 bps to 0.94%, reaching their highest level in nearly seven years.
Sources: Bank of England, Bloomberg Index Services Limited, Federal Reserve, FTSE Fixed Income LLC, FTSE International Limited, Intercontinental Exchange, Inc., and Thomson Reuters Datastream.
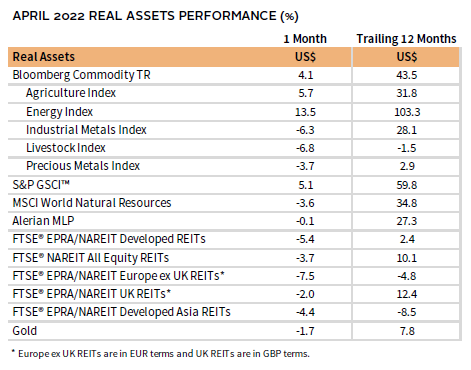
Real Assets
Commodity futures were essentially the only major asset class to post gains in April. Performance was varied as energy and agriculture subindexes advanced, while industrial and precious metals declined. Energy and agriculture prices have contributed to surging inflation. Aggregated agriculture spot prices hit their highest level on record in nominal terms, driven by supply issues stemming from war in Ukraine and drought in South America.
Oil prices ($109.34 for Brent and $104.69 for WTI) advanced for the fifth straight month and are up roughly 40% year-to-date. Oil prices rallied late in the month on reports that Germany dropped its opposition to a Russian oil embargo. Prior to its invasion of Ukraine, Russian oil accounted for about one-third of total German supply. Other factors pushing energy prices higher included a US embargo on Russian coal imports and Russia cutting off its gas supply to Poland and Bulgaria over refusal to meet new demands to make payments in rubles.
Despite rising energy prices, global natural resource equities and energy MLPs declined in April.
REITs suffered heavy losses as bond yields continued climbing. Performance was broadly weak across major regions, with Europe ex UK REITs declining the most.
Gold prices fell to $1,908.49/troy ounce as rising real yields and a surging US dollar weighed on the yellow metal. Still, gold prices are up nearly 5% this year, despite US real yields spiking more than 100 bps and the US dollar reaching multi-decade highs.
Sources: Alerian, Bloomberg L.P., EPRA, FTSE International Limited, Intercontinental Exchange, Inc., MSCI Inc., National Association of Real Estate Investment Trusts, Standard & Poor’s, and Thomson Reuters Datastream. MSCI data provided “as is” without any express or implied warranties.
Note: Gold performance based on spot price return.
USD-Based Investors
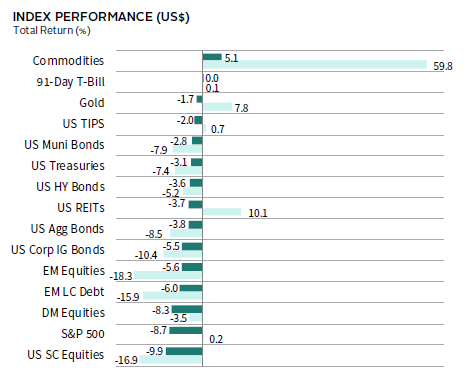
Asset markets left investors with few places to hide in April. Bond yields surged, driven by expectations for imminent monetary tightening, while global economic growth concerns sapped risk appetite. Equities declined the most as US shares underperformed, dragging down broader developed markets. Emerging markets stocks declined the most over the past year among major asset classes. Inflation hedges including commodities, gold, and TIPS fared the best, with the former among the only asset classes that gained. Investment-grade corporate bonds trailed high-yield corporates and Treasuries and lagged the most among fixed income categories over the past year.
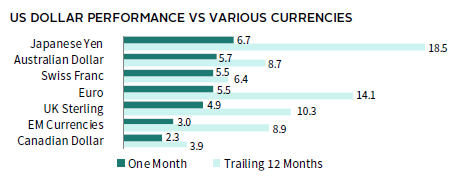
The US dollar broadly appreciated in April, climbing to its strongest level in nearly 20 years. The greenback gained the most vis-à-vis the Japanese yen and Australian dollar, with milder gains relative to the Canadian dollar and EM currencies. The dollar has also broadly strengthened over the past year.
US economic data released in April bolstered the Fed’s front-loaded policy stance. Real consumer spending expanded for a third consecutive month, preliminary durable goods orders ex transportation topped expectations, and PMI remained squarely in expansionary territory. The labor market remained tight, with the unemployment rate falling to 3.6% and job openings exceeding unemployed people by five million. Headline and core inflation reached their highest levels in 40 years, accelerating to 8.5% and 6.5% year-over-year, respectively. US first quarter earnings are now expected to have grown 7.1% year-over-year versus expectations for 4.7% growth as of one month ago.
Sources: Bloomberg Index Services Limited, FTSE International Limited, Frank Russell Company, Intercontinental Exchange, Inc., J.P. Morgan Securities, Inc., MSCI Inc., National Association of Real Estate Investment Trusts, Standard & Poor’s, and Thomson Reuters Datastream. MSCI data provided “as is” without any express or implied warranties.
EUR-Based Investors
Asset markets left investors with few places to hide in April. Bond yields surged, driven by expectations for imminent monetary tightening, while global economic growth concerns sapped risk appetite. European stocks topped broader developed markets, while European small caps lagged mid- and large-cap peers. Emerging markets shares outperformed among major equity categories but have declined the most over the past year. Inflation hedges including commodities and gold gained for the month and have outperformed by a wide margin over the past 12 months. Euro area government bonds trailed investment-grade and high-yield corporate counterparts as ten-year German bund yields climbed to their highest level in nearly seven years.
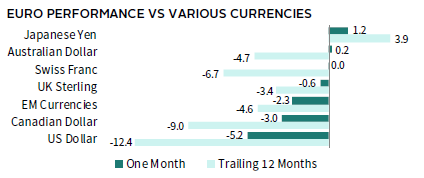
The euro mostly depreciated for the month, reaching its weakest level versus the US dollar in five years. The common currency also declined relative to the Canadian dollar, EM currencies, and UK sterling. Euro weakness has been the prevailing trend over the past year as well, appreciating only versus the downtrodden Japanese yen.
The eurozone economy faced mounting challenges in April. PMI data remained firmly in expansionary territory, but Europe bore the brunt of the IMF’s growth downgrades. Germany saw its 2022 GDP forecast slashed nearly 2 ppts, the largest cut among developed economies. German input prices rose 30.9% year-over-year in March, the highest rate on record back to 1949, largely due to surging energy costs from the war in Ukraine. Euro area core consumer prices rose a record 3.5% year-over-year in April. In response to intensifying inflationary pressures, ECB officials suggested they could hike rates as early as July. Markets are pricing an 80% probability on such an outcome.

Bloomberg Index Services Limited, EPRA, European Banking Federation, FTSE Fixed Income LLC, FTSE International Limited, Intercontinental Exchange, Inc., J.P. Morgan Securities, Inc., MSCI Inc., National Association of Real Estate Investment Trusts, Standard & Poor’s, and Thomson Reuters Datastream. MSCI data provided “as is” without any express or implied warranties.
GBP-Based Investors
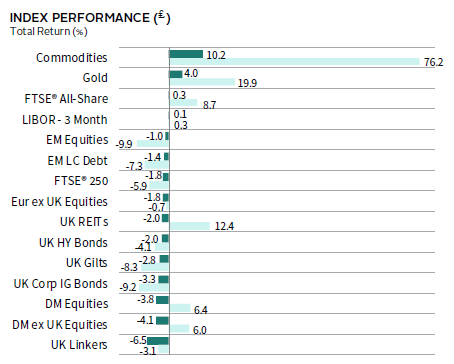
Asset markets left investors with few places to hide in April. Bond yields surged, driven by expectations for imminent monetary tightening, while global economic growth concerns sapped risk appetite. UK equities were the exception, delivering among the only gains across equity markets. Emerging markets outperformed their developed peers but have lagged the most over the past year. Inflation hedges including commodities and gold gained for the month, outperforming other asset classes by a wide margin over the past 12 months as well. UK linkers fell the most in April, while investment-grade corporates and gilts trailed high-yield corporate counterparts.
UK sterling performance was mixed. The pound appreciated the most vis-à-vis the Japanese yen and Australian dollar but weakened versus the US and Canadian dollars and EM currencies. Sterling’s monthly decline versus the US dollar was the largest since the aftermath of the Brexit referendum vote in 2016. UK sterling mostly declined over the past year but has strengthened versus the Japanese yen and euro.
High inflation appears to be taking a toll on UK consumers. Headline and core measures accelerated new 30-year highs in March, reaching 7.0% and 5.7% year-over-year, respectively. Consumer confidence in April dropped to its weakest level since 2008, and March retail sales declined month-on-month more than expected. The IMF projected UK GDP growth of just 1.2% in 2023, the weakest among G7 peers. The deteriorating growth outlook and high inflation has complicated the BOE’s policy calculus.

Sources: Bloomberg Index Services Limited, EPRA, FTSE International Limited, Intercontinental Exchange, Inc., J.P. Morgan Securities, Inc., MSCI Inc., National Association of Real Estate Investment Trusts, Standard & Poor’s, and Thomson Reuters Datastream. MSCI data provided “as is” without any express or implied warranties.
Performance Exhibits
All data are total returns unless otherwise noted. Total return data for all MSCI indexes are net of dividend taxes.
USD-Based Investors index performance chart includes performance for the Bloomberg US Aggregate Bond, Bloomberg US Corporate Investment Grade, Bloomberg US High Yield Bond, Bloomberg Municipal Bond, Bloomberg US TIPS, Bloomberg US Treasuries, ICE BofAML 91-Day Treasury Bills, FTSE® NAREIT All Equity REITs, J.P. Morgan GBI-EM Global Diversified, LBMA Gold Price, MSCI Emerging Markets, MSCI World, Russell 2000®, S&P 500, and S&P GSCI™ indexes.
EUR-Based Investors index performance chart includes performance for the Bloomberg Euro-Aggregate: Corporate, Bloomberg Pan-Euro High Yield (Euro), EURIBOR 3M, FTSE EMU Govt Bonds, FTSE Euro Broad Investment-Grade Bonds, FTSE® EPRA/NAREIT Europe ex UK RE, J.P. Morgan GBI-EM Global Diversified, LBMA Gold Price AM, MSCI Emerging Markets, MSCI Europe, MSCI Europe ex UK, MSCI Europe Small-Cap, MSCI World ex EMU, MSCI World, and S&P GSCI™ indexes.
GBP-Based Investors index performance chart includes performance for the Bloomberg Sterling Aggregate: Corporate Bond, Bloomberg Sterling Index-Linked Gilts, ICE BofAML Sterling High Yield, FTSE® 250, FTSE® All-Share, FTSE® British Government All Stocks, FTSE® EPRA/NAREIT UK RE, J.P. Morgan GBI-EM Global Diversified, LBMA Gold Price AM, LIBOR 3M GBP, MSCI Emerging Markets, MSCI Europe ex UK, MSCI World, MSCI World ex UK, and S&P GSCI™ indexes.
EM currencies is an equal-weighted basket of 20 emerging markets currencies.
Fixed Income Performance Table
Performance data for US TIPS reflect the Bloomberg US TIPS Index, with yields represented by the Bloomberg Global Inflation Linked Bond Index: US.