The risk rally continued in April with broad-based gains across most asset classes. Developed stocks outperformed emerging counterparts, with parts of the latter dealing with a devastating surge in COVID-19 cases and vaccine shortages. Growth topped value, while large caps outgained small caps—both reversals from first quarter. Rising bond yields paused in April as sovereigns advanced, but were bested by corporates. Commodity futures posted top performance among major asset classes; REITs and gold also gained. The US dollar and UK sterling weakened, while the euro generally appreciated.
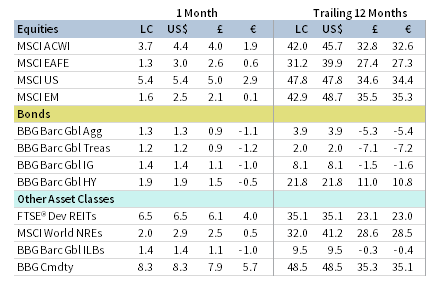
APRIL 2021 MAJOR ASSET CLASS PERFORMANCE (%)
Sources: Bloomberg Index Services Limited, Bloomberg L.P., FTSE International Limited, MSCI Inc., and Thomson Reuters Datastream. MSCI data provided “as is” without any express or implied warranties.
Note: Local currency returns for the Bloomberg Barclays indexes, the Bloomberg Commodity Index, and the FTSE® Developed REITs are in USD terms.
The Macro Picture
Global stocks—driven largely by US equities—hit new all-time highs during the month, closing just below record levels. The rally benefited from strong earnings growth and improving economic momentum. Indeed, the IMF raised its global growth forecasts for 2021 and 2022, citing fiscal support and vaccine-enabled recovery. However, the global pandemic continues to worsen, as a surge of COVID-19 cases in India and Brazil sent global case counts to all-time highs. While vaccine rollouts among developed countries have rapidly progressed, emerging markets countries are facing uneven vaccine rollouts, overwhelmed healthcare systems, and the growing prevalence of new mutations.
Still, investors continue to be highly enthusiastic about risk assets. Primary capital market activity this year has been robust, fueled in part by abundant monetary policy support and healthy economic growth prospects. Globally, 2021 has seen the fastest rate of IPO volumes on record, driven by a surge in SPACs (special purpose acquisition companies ). Even excluding SPACs, IPOs this year are running at their fastest rate since 2000. IPO volumes have also exceeded record high-yield bond issuance, a dynamic that also has not occurred since 2000. Global M&A activity year-to-date has also hit records by total value, driven by increasing deal sizes.
Major central banks remained mostly accommodative, favoring a patient approach toward tightening policy until more economic progress is made. But some central bankers have indicated that they are aware of elevated asset prices, with Federal Reserve Chairman Jerome Powell admitting that areas of the market look “frothy,” while the People’s Bank of China asked banks to curtail credit growth for the rest of 2021 as it grapples with what it sees as extended asset prices across markets.
Equities
US equities advanced in April, climbing to new all-time highs during the month and outperforming developed ex US and emerging markets counterparts. All 11 S&P 500 Index sectors gained, led by real estate, communication services, and consumer discretionary, while energy, consumer staples, and industrials gained the least. Energy remains the top-performing sector year-to-date despite underperforming on the month. Growth bested value after trailing in first quarter, while large caps topped small caps, but they have lagged by more than 25 percentage points (ppts) over the past year. More than halfway through the reporting season, S&P 500 Index companies are expected to deliver 46% year-over-year earnings growth in first quarter, the highest rate since early 2010 and well above the 24% growth expected at first quarter-end. The rate and magnitude of positive surprises are some of the highest on record, forward guidance has also been strong, with analysts now expecting earnings-per-share growth of more than 30% in calendar year 2021.
Data released in April pointed to accelerating economic momentum. Retail sales and consumer spending both exceeded expectations in March, registering their second- and third-highest month-over-month growth figures on record, assisted by added liquidity from COVID-19 relief payments. The economy also added a better-than-expected 900,000+ jobs in March, with the largest adds in the leisure & hospitality and construction sectors. Still, employment and labor force participation remain below their pre-pandemic levels, suggesting room for further gains. Business activity indicators were also strong, with preliminary April readings at all-time high levels across both manufacturing and services. The US economy expanded 6.4% annualized in first quarter 2021, according to first preliminary official data.
European equities gained but trailed broader developed markets. UK stocks outperformed their Europe ex UK peers, but lagged in major currency terms as the euro strengthened and sterling weakened. UK shares still trail other major developed markets on a trailing 12-month basis.
The eurozone economy fell into a double-dip recession in first quarter 2021, with GDP declining 0.6% quarter-over-quarter as much of the bloc enforced containment measures to combat a third wave of infections. Output from Germany, Spain, and Italy contracted on the quarter, whereas France exceeded expectations and delivered economic growth. Weak consumer spending was the primary detractor from economic activity even as manufacturing remained strong. But economic data turned more positive in April as the vaccine rollout gained momentum. Preliminary business activity indicators in manufacturing rose to their highest level on record, while the services sector returned growth for the first time in eight months. Consumer price growth accelerated—but remained below the European Central Bank (ECB)’s target—while the unemployment rate ticked lower and various confidence measures exceeded expectations. Member states began submitting proposals for spending of the EU’s €750B joint recovery fund, with expectations for disbursement later in the year. The EU parliament also ratified the EU-UK Brexit trade deal.
In the United Kingdom, services activity indicator data reached its highest level in more than seven years, pointing to a strong recovery from containment measures imposed during first quarter. The UK economy expanded month-over-month in February, and strong retail sales data for March point to a continued recovery from January’s GDP decline.
Japanese equities were the only major developed region to decline for the month, buffeted by adverse COVID-19 developments. Rising cases, including many instances of new variants, pushed the country to declare a third state of emergency for four major prefectures covering roughly one-quarter of the population. The new restrictions dampen the economic outlook, particularly as they fall over the Golden Week holiday period, which is typically associated with strong economic activity. The Bank of Japan revised its inflation expectations lower for the current fiscal year, well below its 2% target, and signaled that it may need to continue its ultra-accommodative policy stance for an extended period. Japan’s services sector remained in contractionary territory for the 15th straight month in April, as consumer spending declined for a third consecutive month. Manufacturing has fared better, however, as activity increased at the fastest rate in three years, highlighted by better-than-expected industrial output and export growth.
Pacific ex Japan equities trailed broader developed markets due to strong US outperformance, but bested developed ex US counterparts. All countries in the Pacific ex Japan Index advanced, but Australia was the only country to outperform the index. The Reserve Bank of Australia kept policy unchanged at its early-April meeting, signaling it does not expect to raise the current 0.10% cash rate until 2024. Australian housing price growth in March was the fastest in more than 30 years, while recent economic data on employment, business and consumer confidence, and retail sales have exceeded expectations. Highlighting the country’s success containing the virus, the Australian economy has now recovered all jobs lost due to the pandemic. Commodity price indexes for both Australia and New Zealand increased in March, reflecting stronger global economic activity.
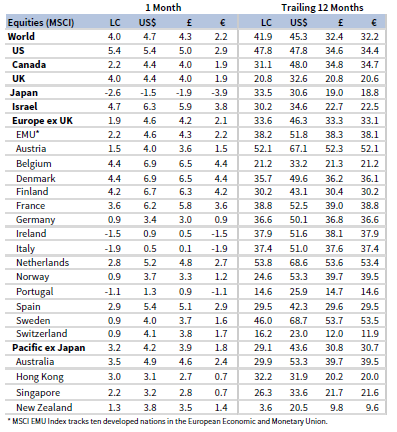
APRIL 2021 DEVELOPED MARKETS EQUITY INDEX PERFORMANCE (%)
Sources: MSCI Inc. and Thomson Reuters Datastream. MSCI data provided “as is” without any express or implied warranties.
Emerging markets equities advanced in April but trailed developed markets for the third consecutive month, bringing year-to-date underperformance to nearly 5 ppts. Among regions, heavily weighted emerging Asia edged the broader emerging index, while emerging Europe, the Middle East & Africa and Latin America also gained but underperformed. Among major emerging countries, Taiwan and Brazil outperformed, China, Korea, and India gained but trailed the broader index, and South Africa declined. Indian equities proved relatively resilient even as COVID-19 cases surged, putting the healthcare system on the brink of collapse and sending many states across the country into lockdown. Russia declined in April, as the United States imposed new sanctions on the country related to several issues from cyberattacks to election interference.
Chinese GDP expanded 18.3% year-over-year in first quarter, the fastest rate of growth since quarterly records began in the early 1990s. However, strong growth is partly due to a depressed year-ago comparison; GDP expanded just 0.6% quarter-over-quarter. Expansion has been driven by strong manufacturing and exports, with the latter growing more than 30% year-over-year in March. Retail sales also expanded at a 30%+ clip in March, signaling strong household consumption. Chinese regulators continued cracking down on large technology companies in April, imposing a record fine on Alibaba and opening an antitrust probe against food delivery service Meituan. Taiwan was the top-performing major emerging market in April and over the past year and is largely perceived to benefit from the global semiconductor shortage as a major supplier.
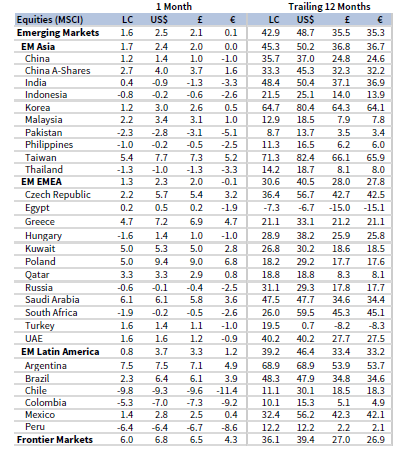
APRIL 2021 EMERGING MARKETS EQUITY INDEX PERFORMANCE (%)
Sources: MSCI Inc. and Thomson Reuters Datastream. MSCI data provided “as is” without any express or implied warranties.
Fixed Income
US fixed income categories posted moderate gains in April, as the sharp Treasury yield increases seen during first quarter 2021 took a pause. US high-yield and investment-grade corporate bonds outperformed Treasuries, sending investment-grade credit spreads to their lowest on record. Further, high-yield bond index yields ended the month at all-time lows, just below 4%. Five- and ten-year Treasury yields declined 6 and 9 basis points (bps) to 0.86% and 1.65%, respectively. The ten-year/two-year Treasury yield spread fell 9 bps, driven entirely by ten-year yields as shorter-maturities remained well anchored on expectations that the Fed will maintain its accommodative policy stance. TIPS outgained nominal Treasuries as ten-year TIPS yields declined 13 bps, pushing ten-year breakeven inflation to 2.41%, the highest level since early 2013. Tax-exempt municipal bonds edged Treasuries.
Relative performance among sterling- and euro-denominated fixed income asset classes mirrored that of their US counterparts. Five- and ten-year gilt yields were relatively unchanged, rising just 1 bp each to 0.40% and 0.93%, respectively. As in the United States, linkers topped nominal gilts. Euro-denominated sovereign bonds declined as ten-year German bund yields climbed 10 bps, reaching their highest levels in more than a year during the month as the vaccine rollout gained momentum and strengthened the economic outlook.
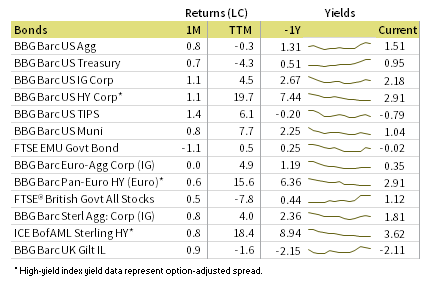
APRIL 2021 BOND INDEX PERFORMANCE (%)
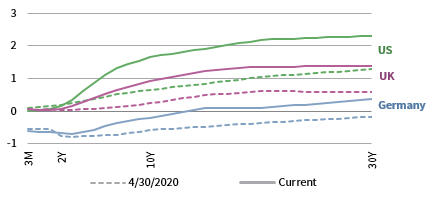
APRIL 2021 NOMINAL YIELD CURVES
10Y/2Y YIELD CURVE SPLIT
Sources: Bank of England, Bloomberg Index Services Limited, BofA Merrill Lynch, Federal Reserve, FTSE Fixed Income LLC, FTSE International Limited, Intercontinental Exchange, Inc., and Thomson Reuters Datastream.
Real Assets
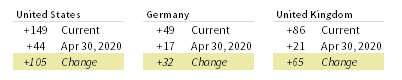
Commodity futures gained the most among major asset classes, led by strong agriculture and industrial metals performance. Copper prices, widely viewed as a barometer of global economic health, hit their highest month-end levels on record. While not included in broader commodity futures indexes, lumber prices rose to record highs in April.
Brent crude and WTI oil prices advanced to $67.25 and $63.58, respectively, reaching their highest month-end levels in two years. OPEC+ members agreed in early April to gradually lift production by 1.1 million barrels per day by July, and Saudi Arabia will also reverse its voluntary 1 million barrel per day cuts. Prices also rose despite the potential for lower demand from India, one of the world’s top fuel importers, due to the worsening COVID-19 situation.
Global natural resources equities and MLPs also gained for the month, though performance for the former lagged broader developed markets equities and underlying commodity prices.
Global developed REITs rose broadly, led by US REITs, while UK REITs, Europe ex UK REITs, and Developed Asia REITs also gained but trailed the broader REITs index.
Gold prices bounced to $1,770.46 per troy ounce, posting their first monthly gain this year. The yellow metal advanced as monetary policy remained accommodative, real yields declined, and inflation expectations rose.
APRIL 2021 REAL ASSETS PERFORMANCE (%)
Sources: Alerian, Bloomberg L.P., EPRA, FTSE International Limited, Intercontinental Exchange, Inc., MSCI Inc., National Association of Real Estate Investment Trusts, Standard & Poor’s, and Thomson Reuters Datastream. MSCI data provided “as is” without any express or implied warranties.
Notes: Total return data for all MSCI indexes are net of dividend taxes. Gold performance based on spot price return.
USD-Based Investors
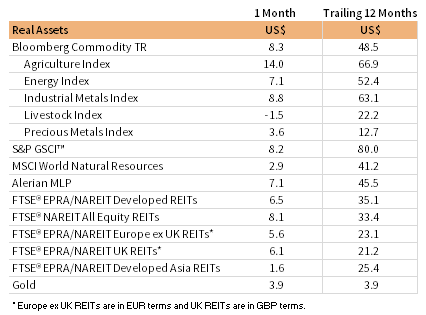
Risk assets outperformed in April as all major categories gained. US stocks outperformed developed peers, while emerging markets lagged among major equity segments for the month, but led over the past year. Within US markets, small caps trailed large caps, but remain well ahead over the trailing 12 months.
Commodity futures were the top-performing asset class for the month and also over the past year as global activity improved and accelerating vaccine rollout lifted the economic outlook. Treasuries underperformed among fixed income asset classes, trailing TIPS, corporates, and tax-exempt municipal bonds. High yield delivered top fixed income results over the past year, whereas Treasuries declined amid rising yields.
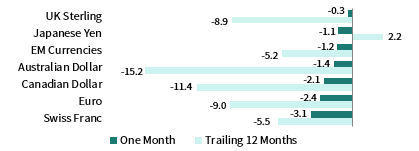
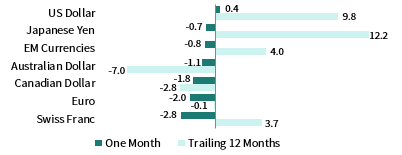
The US dollar broadly weakened—reversing general strengthening during first quarter 2021—declining the most versus the Swiss franc, euro, and Canadian and Australian dollars. The greenback also depreciated over the past year, particularly versus the Australian and Canadian dollars, euro, and sterling, but gained versus the Japanese yen.
S&P 500 Index companies are now expected to have grown earnings by 46% year-over-year in first quarter, the highest growth since early 2010 and well above the 24% growth expected at first quarter-end. Data released in April pointed to an acceleration in economic momentum, as retail sales and consumer spending both exceeded expectations, a better-than-expected 900,000+ jobs were added in March, and preliminary business activity readings reached all-time high levels across both manufacturing and services.
INDEX PERFORMANCE (US$)
US DOLLAR PERFORMANCE VS VARIOUS CURRENCIES
Sources: Bloomberg Index Services Limited, FTSE International Limited, Frank Russell Company, Intercontinental Exchange, Inc., J.P. Morgan Securities, Inc., MSCI Inc., National Association of Real Estate Investment Trusts, Standard & Poor’s, and Thomson Reuters Datastream. MSCI data provided “as is” without any express or implied warranties.
EUR-Based Investors
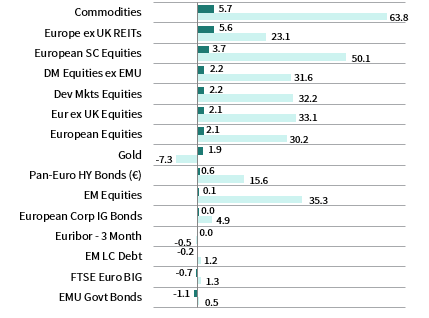
Risk assets outperformed in April as most major categories gained. European stocks trailed their broader developed markets counterparts; however, European small caps posted the strongest equity returns for the month and over the past year. Emerging markets were roughly flat, underperforming developed peers but still maintaining a lead over the past year.
Commodity futures were the top-performing asset class for the month and also over the past year, as global activity improved and accelerating vaccine rollout lifted the economic outlook. Eurozone government bonds declined for the month as sovereign yields rose, bested by high-yield and investment-grade corporates. Euro-denominated high-yield bonds delivered top returns among fixed income assets over the past year.
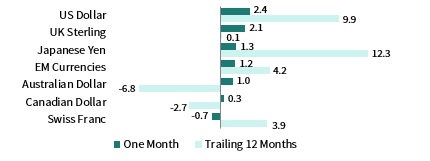
The euro generally advanced in April, gaining the most versus the US dollar, UK sterling, and Japanese yen, depreciating versus only the Swiss franc. Performance was more mixed over the past year, gaining the most vis-à-vis the Japanese yen and US dollar, but weakening versus the commodity-exposed Australian and Canadian dollars.
The eurozone economy fell into a double-dip recession in first quarter 2021, with GDP declining 0.6% quarter-over-quarter as much of the bloc enforced containment measures to combat a third wave of infections. Economic data turned more positive in April, however. Preliminary business activity indicators in manufacturing rose to their highest level on record, while the services sector returned growth for the first time in eight months. Further, consumer price growth accelerated but remained below the ECB’s target, the unemployment rate ticked lower, and various confidence measures exceeded expectations.
INDEX PERFORMANCE (€)
EURO PERFROMANCE VS VARIOUS CURRENCIES
Sources: Bloomberg Index Services Limited, EPRA, European Banking Federation, FTSE Fixed Income LLC, FTSE International Limited, ICE Benchmark Administration Ltd., J.P. Morgan Securities, Inc., MSCI Inc., National Association of Real Estate Investment Trusts, Standard & Poor’s, and Thomson Reuters Datastream.
GBP-Based Investors
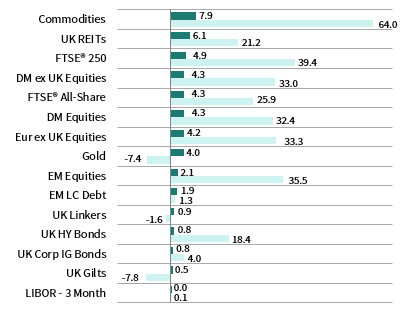
Risk assets outperformed in April as all major categories gained. UK stocks performed in line with their broader developed counterparts as both outperformed emerging markets. Still, emerging shares have outperformed over the past year. Within the United Kingdom, more domestically oriented mid caps bested the broader market, while also outperforming over the past year.
Commodity futures were the top-performing asset class for the month and also over the past year, as global activity improved and accelerating vaccine rollout lifted the economic outlook. Gilt yields were relatively unchanged for the month, with performance trailing linkers and high-yield and investment-grade corporates. High-yield bonds led fixed income gains over the past year, in contrast to declines for gilts and linkers.
UK sterling generally weakened in April, depreciating the most versus the Swiss franc, euro, and Australian and Canadian dollars. Sterling advanced versus only the US dollar, which was broadly weaker on the month. Performance was more mixed over the past year, with sterling appreciating the most vis-à-vis the Japanese yen and US dollar, but weakening versus the commodity-exposed Canadian and Australian dollars.
Services activity indicators data reached its highest level in seven years, pointing to a strong recovery from containment measures imposed during first quarter. The UK economy expanded month-over-month in February, and strong retail sales data for March point to a continued recovery from January’s GDP decline. The EU parliament officially ratified the EU-UK Brexit trade deal, bringing to an end the Brexit uncertainty overhang of the past four+ years.
INDEX PERFORMANCE (£)
POUND STERLING PERFORMANCE VS VARIOUS CURRENCIES
Sources: Bloomberg Index Services Limited, EPRA, FTSE International Limited, Intercontinental Exchange, Inc., ICE Benchmark Administration Ltd., J.P. Morgan Securities, Inc., MSCI Inc., National Association of Real Estate Investment Trusts, Standard & Poor’s, and Thomson Reuters Datastream.
Performance Exhibits
All data are total returns unless otherwise noted. Total return data for all MSCI indexes are net of dividend taxes.
USD-Based Investors index performance chart includes performance for the Bloomberg Barclays US Aggregate Bond, Bloomberg Barclays US Corporate Investment Grade, Bloomberg Barclays US High Yield Bond, Bloomberg Barclays Municipal Bond, Bloomberg Barclays US TIPS, Bloomberg Barclays US Treasuries, ICE BofAML 91-Day Treasury Bills, FTSE® NAREIT All Equity REITs, J.P. Morgan GBI-EM Global Diversified, LBMA Gold Price, MSCI Emerging Markets, MSCI World, Russell 2000®, S&P 500, and S&P GSCI™ indexes.
EUR-Based Investors index performance chart includes performance for the Bloomberg Barclays Euro-Aggregate: Corporate, Bloomberg Barclays Pan-Euro High Yield (Euro), EURIBOR 3M, FTSE EMU Govt Bonds, FTSE Euro Broad Investment-Grade Bonds, FTSE® EPRA/NAREIT Europe ex UK RE, J.P. Morgan GBI-EM Global Diversified, LBMA Gold Price AM, MSCI Emerging Markets, MSCI Europe, MSCI Europe ex UK, MSCI Europe Small-Cap, MSCI World ex EMU, MSCI World, and S&P GSCI™ indexes.
GBP-Based Investors index performance chart includes performance for the Bloomberg Barclays Sterling Aggregate: Corporate Bond, Bloomberg Barclays Sterling Index-Linked Gilts, ICE BofAML Sterling High Yield, FTSE® 250, FTSE® All-Share, FTSE® British Government All Stocks, FTSE® EPRA/NAREIT UK RE, J.P. Morgan GBI-EM Global Diversified, LBMA Gold Price AM, LIBOR 3M GBP, MSCI Emerging Markets, MSCI Europe ex UK, MSCI World, MSCI World ex UK, and S&P GSCI™ indexes.
EM currencies is an equal-weighted basket of 20 emerging markets currencies.
Fixed Income Performance Table
Performance data for US TIPS reflect the Bloomberg Barclays US TIPS Index, with yields represented by the Bloomberg Barclays Global Inflation Linked Bond Index: US.