Most risk assets surged in April, partially recovering from steep losses during first quarter’s volatile market environment. Global equities bounced back with double-digit gains, driven largely by US shares. Growth stocks outperformed value counterparts, while small caps bested large caps. Investment-grade and high yield corporate bonds outgained sovereigns, narrowing credit spreads from recent highs amid abundant support from monetary policy. Most real assets gained, led by MLPs and natural resources equities, but commodities declined amid volatile price movements in oil futures. The US dollar and euro broadly weakened, while UK sterling generally appreciated.
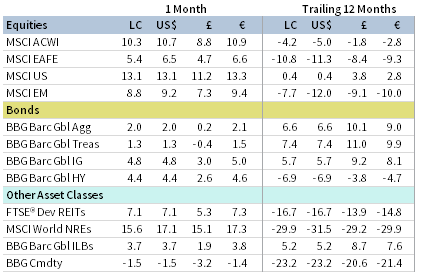
APRIL 2020 MAJOR ASSET CLASS PERFORMANCE (%)
Sources: Bloomberg Index Services Limited, Bloomberg L.P., FTSE International Limited, MSCI Inc., and Thomson Reuters Datastream. MSCI data provided “as is” without any express or implied warranties.
Note: Local currency returns for the Bloomberg Barclays indexes, the Bloomberg Commodity Index, and the FTSE® Developed REITs are in US dollar terms.
The Macro Picture
April’s rebound reflected a shift in risk appetite as investors began pricing in the prospects of an economic recovery, coupled with the support of unprecedented monetary and fiscal stimulus measures. Yet the rally was sharply disconnected from bleak economic and earnings data releases, which gave early indications of the devastating economic impact of the COVID-19 pandemic. First quarter GDP steeply contracted in the United States, Europe, and China, with a deeper contraction expected in the second quarter. The International Monetary Fund expects world GDP to contract 3% in 2020, which would signify the worst recession since the great depression. Business activity indicators fell to their lowest levels on record, and US unemployment claims topped 30 million cumulatively in just six weeks—erasing all post-GFC job gains. Corporate earnings in first quarter are expected to have contracted at a double-digit clip across regions, with many companies cutting dividends and suspending buybacks.
The ongoing COVID-19 crisis has resulted in global human tragedy and presents substantial uncertainty as countries start the process of reopening their economies. With an unclear timeline for vaccine development, limited testing capacity, and the absence of (and largely unknown efficacy of) scalable treatment options, governments face the tremendous challenge of simultaneously reopening economies and protecting against the risk of disease resurgence.
Equities
US equities rebounded in April—posting their highest monthly gains since January 1987—and outperformed global ex US peers. The trailing one-year outperformance gap versus non-US equities widened to 12 percentage points in major currency terms. The S&P 500 Index climbed 30.4% from the March 23 low and ended the month just 14.0% below the all-time high reached February 19. All 11 S&P 500 sectors advanced, led by cyclicals such as energy, consumer discretionary, and materials, while defensives, including utilities and consumer staples, gained the least. Growth outperformed value and small caps outperformed large caps.
April’s performance disconnected from deteriorating fundamentals. More than halfway through reporting season, first quarter earnings per share (EPS) are expected to decline 14% year-over-year, the largest EPS contraction since 2009. Analysts now expect second quarter earnings to fall 37% year-over-year, with full year 2020 EPS down 18%. A surging market and depressed earnings expectations have pushed the 12-month forward P/E ratio to the highest level since mid-2002, highlighting investor optimism. First quarter GDP declined at a 4.8% annualized rate as containment measures stifled discretionary consumer spending. US Congress passed a $484 billion stimulus package to replenish the small business loan fund, provide relief to hospitals, and increase COVID-19 testing capabilities. The Federal Reserve left its benchmark policy rate unchanged in April, but Chairman Jerome Powell affirmed that the central bank will use its “full range of tools” to support the US economy.
European equities underperformed broader developed markets stocks. UK shares trailed Europe ex UK counterparts as several EU economies took steps to ease lockdown measures and the United Kingdom extended its shutdown. Euro Area first quarter GDP declined 3.8% quarter-over-quarter, which translates to a contraction of more than 14% on an annualized basis. First quarter’s GDP decline was the most severe since records begin in 1995. France, Italy, and Spain contracted by 5.8%, 4.7%, and 5.2%, respectively, as France and Italy both entered technical recessions (defined as two consecutive quarters of GDP declines). Preliminary April business activity survey data for the eurozone fell to all-time lows, by far, suggesting that second quarter could see even more substantial growth declines.
The European Central Bank (ECB) lowered the interest rate on the loans it provides to banks and launched a new program aimed to support liquidity conditions in euro area money markets. The bank also indicated a willingness to increase the size of its previously established €750 billion pandemic purchase program. EU leaders agreed to take steps toward developing a coronavirus recovery fund, though lack of detail on the package highlighted divisions among member states’ views on debt mutualization. Standard & Poor’s maintained its rating on Italy’s sovereign debt, offering temporary relief to bondholders, but Fitch cut the rating to one notch above high yield. In the United Kingdom, the Bank of England (BOE) agreed to directly finance government spending, allowing the Treasury to circumvent traditional bond markets.
Japanese equities advanced but trailed broader developed markets counterparts. Prime Minister Shinzo Abe declared a nationwide state of emergency through May 6, 2020, which is now expected to be extended for an additional month. The Japanese government increased the size of its record stimulus package to roughly $1.1 trillion, including direct cash payouts to all citizens. The Bank of Japan kept policy rates unchanged but expanded its monetary stimulus, pledging to purchase an unlimited amount of government bonds and quadrupling limits on corporate bond purchases. Economists expect that the world’s third-largest economy contracted in calendar first quarter, entering a technical recession following calendar fourth quarter’s GDP decline.

APRIL 2020 EQUITY INDEX PERFORMANCE (%)
Sources: MSCI Inc. and Thomson Reuters Datastream. MSCI data provided “as is” without any express or implied warranties.
Emerging markets equities bounced back in April, but underperformed broader developed markets due to US equity strength; emerging shares outperformed developed ex US counterparts. Emerging Europe, the Middle East & Africa outperformed other emerging regions in major currency terms, emerging Asia matched the broader index, and Latin America lagged. South Africa, India, Taiwan, and Brazil outperformed among major emerging countries, whereas China and Korea trailed. Brazil underperformed in major currency terms as the real broadly depreciated amid political turmoil and hit a record low against the dollar. Brazilian President Jair Bolsonaro remains at odds with local governors over COVID-19 lockdown measures and much of the country remains open. The resignation of an administration cabinet member further raised speculation regarding political stability.
Chinese first quarter GDP declined 6.8% year-over-year, the first such economic contraction since 1976. Chinese business activity indicators for April were relatively stable, appearing to confirm anecdotal evidence that work in China has largely resumed following the lifting of lockdown protocols early in the month. Trade data exceeded expectations but may not yet reflect the lockdown environment in Europe and the United States. The People’s Bank of China took steps to support its weakened economy, making several cuts to borrowing costs, including a 20 basis point (bp) reduction in its key benchmark lending rate.
Fixed Income
Investment-grade and high-yield corporate bonds outperformed sovereigns, as recent central bank actions have shored up credit markets, leading to a fresh wave of new supply. US Treasuries were relatively unchanged as five- and ten-year yields declined 1 and 6 bps to 0.36% and 0.64%, respectively. The Fed did not announce any new policy measures at its April meeting, but expanded its balance sheet by $1.4 trillion during the month to a record $6.7 trillion. The ten-year/two-year yield spread held steady during the month, dropping to 44 bps from 47 bps at the end of March. TIPS outgained nominal Treasuries as ten-year breakeven inflation rose 20 bps to 1.07% . Tax-exempt municipal bonds continued to struggle and underperformed other US bond categories.
Relative performance among sterling-denominated fixed income assets largely mirrored their US counterparts. Five- and ten-year gilt yields declined 10 and 12 bps to record-low levels of 0.06% and 0.24%, respectively. UK linkers outperformed nominal gilts. Eurozone high-yield bonds outperformed investment-grade corporates and sovereigns as German ten-year bund yields declined 13 bps to -0.59%.

APRIL 2020 BOND INDEX PERFORMANCE (%)

APRIL 2020 NOMINAL YIELD CURVES
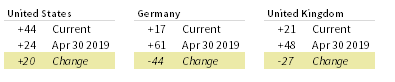
10Y/2Y YIELD CURVE SPLIT
* High-yield index yield data represent option-adjusted spread.
Sources: Bank of England, Bloomberg Index Services Limited, BofA Merrill Lynch, Federal Reserve, FTSE Fixed Income LLC, FTSE International Limited, Intercontinental Exchange, Inc., and Thomson Reuters Datastream.
Real Assets
Commodity futures declined, driven lower by energy and agriculture, while precious and industrial metals gained.
Oil prices ($25.27 for Brent and $18.84 for WTI) swung wildly during the month as the May WTI futures contract expired with virtually nowhere to store physical oil. The disappearance of storage capacity resulted from the global supply glut and weak demand stemming from the COVID-19 lockdown. These dynamics pushed WTI prices briefly into negative territory for the first time in history, despite OPEC+ members agreeing earlier in the month to massive production cuts to begin by May 1. The world’s largest oil ETF, USO, announced plans to exit all near-dated June contracts by month-end, fearing a repeat of April’s negative price dip.
Global natural resources equities and energy MLPs surged along with broader equities, despite the oil price turbulence. Both categories remain significantly in the red over the past year. MLPs delivered their strongest monthly return on record, a sharp reversal from their March decline, which was the worst on record.
Global developed REITs advanced. US REITs outperformed the broader index, Asia REITs performed in line with the index, while UK and Europe ex UK REITs lagged.
Gold price momentum continued, rising to $1,704.81 per troy ounce, the highest nominal month-end closing price since late 2012. The yellow metal rose more than 30% over the past year.
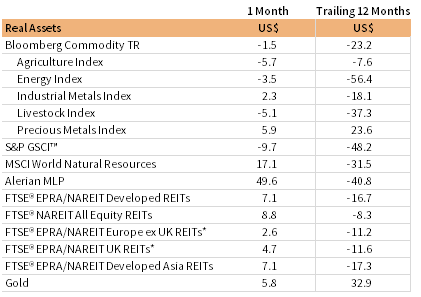
APRIL 2020 REAL ASSETS PERFORMANCE (%)
* Europe ex UK REITs are in EUR terms and UK REITs in GBP terms.
Sources: Alerian, Bloomberg L.P., EPRA, FTSE International Limited, Intercontinental Exchange, Inc., MSCI Inc., National Association of Real Estate Investment Trusts, Standard & Poor’s, and Thomson Reuters Datastream. MSCI data provided “as is” without any express or implied warranties.
Notes: Total return data for all MSCI indexes are net of dividend taxes. Gold performance based on spot price return.
USD-Based Investors
Equities rebounded in April and led performance. Investors largely overlooked deteriorating economic and earnings data, pinning hopes on stimulus and the return to economic growth as COVID-19 containment measures are beginning to unwind.
Some relative performance trends showed signs of renewed risk appetite; US small-cap equities outperformed large caps, while investment-grade and high-yield corporate bonds outperformed Treasuries. US stocks outperformed developed and emerging markets counterparts, further extending their historically wide relative valuation gap. REITS and gold outperformed among real assets, whereas oil market volatility dragged commodities lower.
The US dollar depreciated versus most currencies, save the euro, giving back strong gains from first quarter. The greenback fell the most vis-à-vis the Australian and Canadian dollars and UK sterling. The US dollar gained against most currencies over the past year, but weakened against the safe-haven Swiss franc and Japanese yen.
US stocks have advanced more than 30% from the March 23 low and ended the month 14% below the February 19 peak. First quarter US GDP declined at a 4.8% annualized rate as consumer spending—the main driver of the US economy—fell the most on record in March, as lockdowns and business shutdowns stifled discretionary spending. Initial unemployment claims topped 30 million cumulatively over the past six weeks, erasing all post-GFC job market gains at a blistering pace.
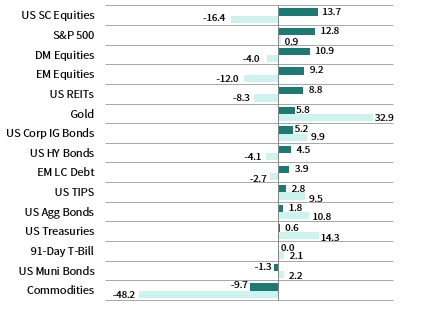
INDEX PERFORMANCE (US$)

US DOLLAR PERFORMANCE VS VARIOUS CURRENCIES
Sources: Bloomberg Index Services Limited, FTSE International Limited, Frank Russell Company, Intercontinental Exchange, Inc., J.P. Morgan Securities, Inc., MSCI Inc., National Association of Real Estate Investment Trusts, Standard & Poor’s, and Thomson Reuters Datastream. MSCI data provided “as is” without any express or implied warranties.
EUR-Based Investors
Broad equities rebounded in April and led performance. Investors largely overlooked deteriorating economic and earnings data, pinning hopes on stimulus and the return to economic growth as COVID-19 containment measures are beginning to unwind.
Some relative performance trends showed signs of renewed risk appetite; European small-cap equities outperformed large- and mid-caps, while high-yield and investment-grade corporate bonds outperformed sovereigns. European stocks trailed developed and emerging markets counterparts. Gold outperformed among real assets, REITs returns were more muted, and oil market volatility dragged down commodities.
The euro broadly fell, depreciating the most versus the Australian and Canadian dollars and UK sterling. The common currency was more mixed over the past year, gaining against commodity-related currencies and the UK sterling, but declining versus safe havens including the Swiss franc, US dollar, and Japanese yen.
Euro Area first quarter GDP declined 3.8% quarter-over-quarter, which translates to a contraction of more than 14% on an annualized basis. The GDP decline in first quarter was the most severe since records begin in 1995. Preliminary April business activity survey data for the eurozone fell to the lowest level on record by far, suggesting that second quarter could see substantial growth declines.
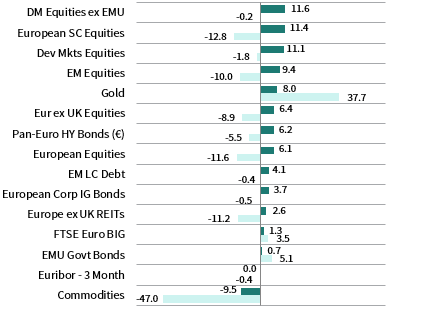
INDEX PERFORMANCE (€)
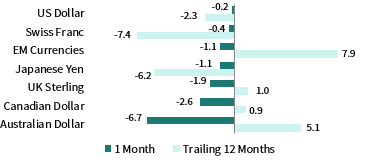
EURO PERFROMANCE VS VARIOUS CURRENCIES
Sources: Bloomberg Index Services Limited, EPRA, European Banking Federation, FTSE Fixed Income LLC, FTSE International Limited, ICE Benchmark Administration Ltd., J.P. Morgan Securities, Inc., MSCI Inc., National Association of Real Estate Investment Trusts, Standard & Poor’s, and Thomson Reuters Datastream.
GBP-Based Investors
Broad equities rebounded in April and led performance. Investors largely overlooked deteriorating economic and earnings data, pinning hopes on stimulus and the return to economic growth as COVID-19 containment measures are beginning to unwind.
Aggregate UK stocks trailed broader developed markets, while UK mid caps were among the top-performing asset classes. Sterling investment-grade and high-yield corporate bonds bested nominal gilts amid ample monetary support. Gold and UK REITs advanced, while oil market volatility dragged down commodities.
UK sterling mostly appreciated in April, gaining the most vis a vis the euro, US dollar, and Swiss franc, but declining against the Australian and Canadian dollars. UK sterling is mostly weaker over the past year, but held up better versus commodity-related currencies.
Data appeared to confirm that UK economic activity has ground to a halt. Manufacturing capacity usage, business activity survey data, and retail sales growth all fell to their lowest levels on record, portending a steep GDP contraction. The BOE agreed to directly finance government spending, allowing the Treasury to circumvent traditional bond markets.
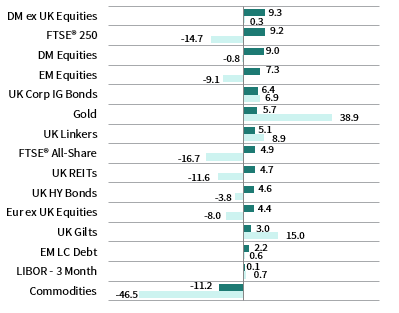
INDEX PERFORMANCE (£)

POUND STERLING PERFORMANCE VS VARIOUS CURRENCIES
Sources: Bloomberg Index Services Limited, EPRA, FTSE International Limited, Intercontinental Exchange, Inc., ICE Benchmark Administration Ltd., J.P. Morgan Securities, Inc., MSCI Inc., National Association of Real Estate Investment Trusts, Standard & Poor’s, and Thomson Reuters Datastream.
Performance Exhibits
All data are total returns unless otherwise noted. Total return data for all MSCI indexes are net of dividend taxes.
USD-Based Investors index performance chart includes performance for the Bloomberg Barclays US Aggregate Bond, Bloomberg Barclays US Corporate Investment Grade, Bloomberg Barclays US High Yield Bond, Bloomberg Barclays Municipal Bond, Bloomberg Barclays US TIPS, Bloomberg Barclays US Treasuries, ICE BofAML 91-Day Treasury Bills, FTSE® NAREIT All Equity REITs, J.P. Morgan GBI-EM Global Diversified, LBMA Gold Price, MSCI Emerging Markets, MSCI World, Russell 2000®, S&P 500, and S&P GSCI™ indexes.
EUR-Based Investors index performance chart includes performance for the Bloomberg Barclays Euro-Aggregate: Corporate, Bloomberg Barclays Pan-Euro High Yield (Euro), EURIBOR 3M, FTSE EMU Govt Bonds, FTSE Euro Broad Investment-Grade Bonds, FTSE® EPRA/NAREIT Europe ex UK RE, J.P. Morgan GBI-EM Global Diversified, LBMA Gold Price AM, MSCI Emerging Markets, MSCI Europe, MSCI Europe ex UK, MSCI Europe Small-Cap, MSCI World ex EMU, MSCI World, and S&P GSCI™ indexes.
GBP-Based Investors index performance chart includes performance for the Bloomberg Barclays Sterling Aggregate: Corporate Bond, Bloomberg Barclays Sterling Index-Linked Gilts, ICE BofAML Sterling High Yield, FTSE® 250, FTSE® All-Share, FTSE® British Government All Stocks, FTSE® EPRA/NAREIT UK RE, J.P. Morgan GBI-EM Global Diversified, LBMA Gold Price AM, LIBOR 3M GBP, MSCI Emerging Markets, MSCI Europe ex UK, MSCI World, MSCI World ex UK, and S&P GSCI™ indexes.
EM currencies is an equal-weighted basket of 20 emerging markets currencies.
Fixed Income Performance Table
Performance data for US TIPS reflect the Bloomberg Barclays US TIPS Index, with yields represented by the Bloomberg Barclays Global Inflation Linked Bond Index: US.