Global risk assets continued their 2019 ascent in April as major US stock market indexes reached new all-time highs. Developed markets stocks, led by strong performance from US and European equities, outperformed emerging markets equivalents. Global growth stocks continued to outperform value and large caps bested small caps after underperforming in first quarter. High yield and investment-grade corporates outperformed global government bonds as credit spreads tightened. Among real assets, commodity futures were mixed and natural resources equities fell; REITs generally declined amid higher global yields. For the major currencies, the US dollar and UK sterling appreciated, while the euro was mixed.
Despite a still-subdued global economic outlook, signs that the cyclical slowdown may be bottoming, combined with dovish central banks, helped sustain the year-to-date global equity rally through April. The International Monetary Fund (IMF) indicated that global economic risks are skewed to the downside and further lowered its global growth forecasts for 2019. Among risks, the IMF listed trade tension escalation, a no-deal Brexit, and Italian fiscal uncertainty as key areas of vulnerability to global growth. Despite these concerns, the United States, China, and Eurozone all posted surprisingly upbeat first quarter GDP figures, though underlying growth trends remain soft. The US growth rate topped expectations but was boosted primarily by higher inventories and net trade, both relatively volatile components of growth, while growth in business investment and consumer spending slowed. In Europe, hard data have improved, but numerous survey data pointed to further deterioration of economic sentiment. Trade negotiations between the United States and China appeared to progress, but US-Europe tensions were exacerbated after the Trump administration threatened tariffs on more than $11 billion of European goods in response to allegations of illegal subsidies granted to Airbus by the EU. Robust oil price gains in 2019 have pushed up headline US inflation, but the Fed’s preferred measure of core inflation remained tepid and continued to soften, muddying the waters for monetary policy just as the Fed is set to review its rate-setting framework in the coming months. While ongoing geopolitical uncertainties cloud the economic outlook, accommodative central banks and better-than-expected earnings results have supported the rally in risk assets.
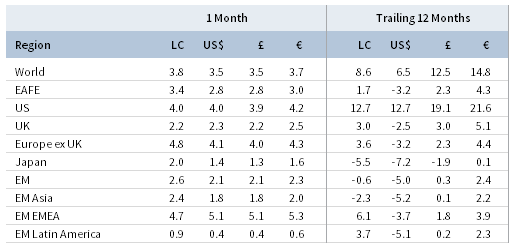
TOTAL RETURN FOR MSCI INDEXES (%)
US equities (4.0% for the S&P 500 Index) outperformed broader developed markets in April, bringing year-to-date gains to more than 18% and marking the best four-month start to a year since 1987. Notably, US equities have rallied 26% from December lows. Nine of 11 sectors posted gains in April, led by cyclicals; financials, communication services, and information technology outperformed, while healthcare and real estate declined. Growth stocks outperformed their value counterparts for the fifth consecutive month, and large caps outgained small caps. The first quarter 2019 earnings season progressed better than expected in April as analysts now forecast S&P 500 earnings per share (EPS) to contract 1% year-over-year, an improvement versus earlier estimates of -4% at the end of first quarter. The number and magnitude of companies beating estimates are running above average levels, suggesting an overly depressed outlook coming into reporting season. However, first quarter results, if realized, would mark the first decline in EPS and net profit margins since 2016. Economic data in April indicated the US economy picked up in March as labor market, retail sales, and consumer spending data all rebounded and exceeded expectations. US GDP growth accelerated to a 3.2% annualized rate in first quarter, well above expectations, but underlying consumer and business demand slowed from fourth quarter. Housing detracted from growth for the fifth consecutive quarter.
European equities (3.6% in USD, 3.8% in EUR, 3.5% in GBP) advanced in April and edged broader developed stocks. Europe ex UK and Eurozone stocks outperformed UK equivalents as data suggested improvement in the Continent’s economy. Contrary to weak survey data from first quarter, Eurozone economic growth accelerated to 0.4% quarter-over-quarter, exceeding expectations and representing a reversal from the slowdown in the second half of 2018. In a further sign of momentum, Eurozone unemployment dropped to the lowest level in more than a decade. Italy, the Eurozone’s third largest economy, climbed out of its third recession in a decade and grew GDP by 0.2% from the previous quarter. The Italian economy still faces challenges; in early April, the Italian Treasury lowered its 2019 GDP growth expectations and increased already contentious debt and deficit targets. Though still early in the reporting season, European EPS growth is proving resilient as results thus far have largely exceeded earlier expectations. On the political front, UK and European leaders agreed to extend the Brexit deadline from April 12 to October 31, diminishing the likelihood of a hard Brexit and requiring the United Kingdom to take part in upcoming European Parliament elections.
Japanese equities (1.4% in USD, 1.6% in EUR, 1.3% in GBP) lagged developed counterparts last month and have trailed the broader index by 7 percentage points (ppt) year-to-date. Japan’s manufacturing sector remained under pressure as industrial production fell at the fastest pace in nearly four years and manufacturing PMI remained in contractionary territory for the third consecutive month—buffeted by falling export orders. However, retail sales accelerated above expectations and the services sector continued to expand. The Bank of Japan (BOJ) left monetary policy unchanged in April but revised its forward guidance, saying it will keep interest rates low until at least the spring of 2020 and monitor risks from overseas economies. Previously, the BOJ stated it would maintain low rates for an “extended period,” but was reluctant to specify a date. Inflation ticked up in March, but remains more than 1 ppt below the 2% target. Japanese capital markets closed—for the longest period since the end of World War II—in recognition of the emperor’s abdication and are set to reopen May 7.
Emerging markets equities (2.1% in USD, 2.3% in EUR, 2.1% in GBP) gained for the month but underperformed developed markets stocks and have lagged by about 12 ppts in major currency terms over the past year. Among regions, emerging Europe, the Middle East & Africa (EMEA) was the sole outperformer, whereas heavily weighted emerging Asia and Latin America trailed the broader index. South Africa delivered top performance among major emerging markets countries, bolstering the EMEA region, as index heavyweight Naspers posted double-digit gains in major currency terms. The company plans to separately list its international internet businesses in Amsterdam, including its sizable stake in Chinese internet giant Tencent, to reduce a valuation gap related to position limits imposed on South African institutions. Broad Chinese equities’ year-to-date momentum continued, while the rally in domestically listed A-Shares cooled. Economic data from the world’s second largest economy largely exceeded expectations, highlighted by first quarter GDP growth of 6.4%. Manufacturing activity weakened but remained in expansionary territory for the second consecutive month. Along with progress on the US trade front, an early-month EU-China summit apparently bore fruit as the two sides agreed to language in a joint statement related to forced technology transfers and industrial subsidies, among other EU concerns. The agreement, however, was widely viewed as an attempt by Brussels to push China into concessions amid ongoing US trade talks. Other large markets, including Brazil, India, Korea, and Taiwan, all gained last month in major currency terms. Frontier markets equities (0.2% in USD, 0.4% in EUR, 0.1% in GBP) lagged both developed and emerging markets peers despite strong performance from Kuwait as heavily weighted Argentina and Vietnam declined.
Commodity futures were mixed (-0.4% for the Bloomberg Commodity TR Index and 2.8% for the energy-heavy S&P GSCI™ Index), supported by energy as other major subcategories detracted. Iron ore prices, a primary input for steel production, hit a nearly five-year high during the month. Oil prices ($72.80 for Brent and $63.91 for WTI) climbed 6.4% and 6.3%, respectively, hitting yearly highs and bringing year-to-date price gains to roughly 40% and 35%. The Trump administration unexpectedly announced it would let waivers previously granted to eight importers of Iranian oil expire on May 2, which has the potential to remove up to one million barrels per day of Iranian exports from the oil market. Saudi Arabia and other OPEC members do not have plans to fill the supply void. The announcement—along with other supply dynamics such as OPEC output cuts and escalating violence in Libya and Venezuela—helped propel oil prices so far this year. Global natural resources equities (-0.2% for the MSCI World Natural Resources Index in USD terms) and energy MLPs (-1.3%) declined following strong performance in first quarter, despite the rise in oil prices. REITs mostly declined amid higher sovereign bond yields; US REITs (-0.2%), Europe ex UK REITs (-1.6%), and Asia REITs (-3.1% in USD terms) fell, while UK REITs (0.9%) gained after lagging in first quarter. Gold prices (-1.0%) dipped to $1,283.06 per troy ounce amid dollar strength and positive economic data.
Sovereign bonds generally fell in April, whereas their corporate investment-grade and high-yield counterparts continued to climb and credit spreads tightened. US Treasuries (-0.3%) declined as economic activity appeared to rebound. Five- and ten-year Treasury yields rose 5 basis points (bps) and 10 bps, respectively, to end the month at 2.28% and 2.51%. Shorter-term rates were relatively stable, allowing the yield curve to steepen; both the 10-year/3-month and 10-year/2-year yield spreads climbed roughly 10 bps, the former reversing the temporary inversion in March. UK gilts (-1.5%) fell as the Brexit deadline was extended to late October, with five- and ten-year yields climbing 16 bps and 18 bps to 0.87% and 1.22%, respectively. German 10-year bund yields ended the month barely in positive territory as broader EMU government bonds (-0.1%) followed global trends. US high yield (1.4%) delivered top performance among US bond sectors. Investment-grade corporates (0.5%), tax-exempt municipal (0.4%), and inflation-linked (0.3%) bonds all outpaced nominal Treasuries. UK linkers (-1.4%) narrowly outpaced nominal gilts.
Among major currencies, the US dollar and UK sterling broadly appreciated, while the euro was mixed. The US dollar appreciated against all major currencies—save for the UK sterling—and our equal-weighted EM currency basket. The greenback is broadly stronger over the trailing 12 months. UK sterling gained against all major currencies as the Brexit deadline was extended, appreciating the most relative to the Swiss franc, Australian dollar, and Canadian dollar. The euro rose against most currencies but depreciated relative to UK sterling and the US dollar. The common currency is broadly weaker over the trailing 12 months.
Currency Performance as of April 30, 2019
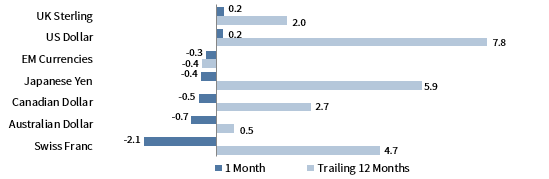
The US dollar gained against all but the UK sterling, appreciating the most versus the Swiss franc and Australian and Canadian dollars. The greenback was broadly stronger over the past year and gained the most against our equal-weighted basket of EM currencies and the euro.
VERSUS THE US DOLLAR
Total Return (%)
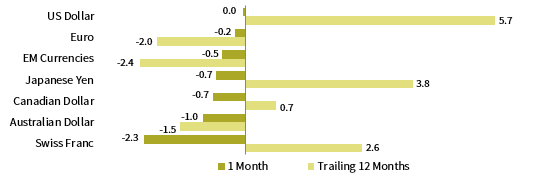
The euro was mixed in April, gaining against most currencies but depreciating versus the broadly stronger UK sterling and US dollar. The euro was generally weaker over the trailing 12 months, strengthening only relative to EM currencies.
VERSUS THE EURO
Total Return (%)
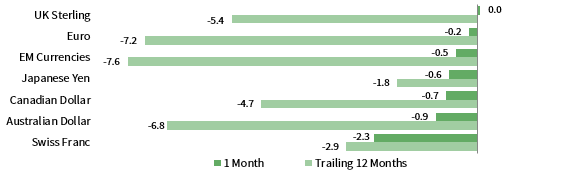
UK sterling appreciated broadly in April as the Brexit deadline was extended to late October, gaining the least relative to the US dollar and euro. Sterling performance was more mixed over the past year, declining the most relative to the safe-haven US dollar, Japanese yen, and Swiss franc.
VERSUS THE POUND STERLING
Total Return (%)
Note: EM currencies is an equal-weighted basket of 20 currencies.
USD Market Performance as of April 30, 2019
Equities delivered top performance in April. US stocks outperformed global ex US peers and large caps outpaced small caps. Among bonds, high yield and IG corporates performed the best, while US Treasuries and EM LC debt declined. US REITs lagged, but have outperformed over the past year.
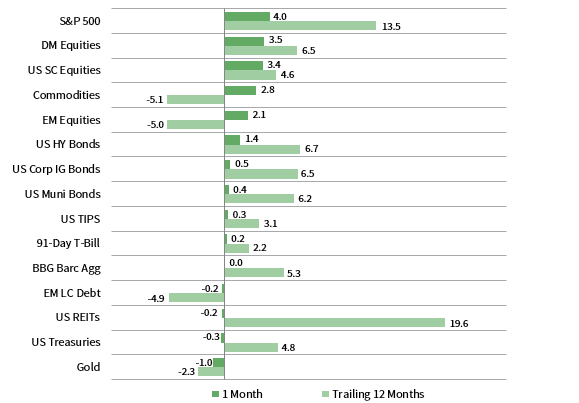
INDEX PERFORMANCE (US$)
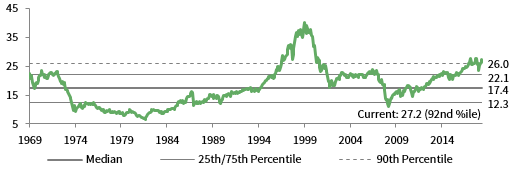
COMPOSITE NORMALIZED P/E: MSCI US
December 31, 1969 – April 30, 2019
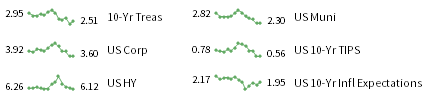
FIXED INCOME YIELDS
April 2018 – April 2019
Sources: Bloomberg Index Services Limited, Bloomberg L.P., BofA Merill Lynch, FTSE International Limited, Frank Russell Company, J.P. Morgan Securities, Inc., MSCI Inc., National Association of Real Estate Investment Trusts, Standard & Poor’s, and Thomson Reuters Datastream. MSCI data provided “as is” without any express or implied warranties.
Euro Market Performance as of April 30, 2019
European equities outperformed developed and emerging markets as small caps (the laggard over the past year) posted top returns in April. High-yield and IG corporate bonds outperformed EMU sovereign bonds, which fell slightly. Europe ex UK REITs declined the most, whereas commodities gained on higher oil prices.
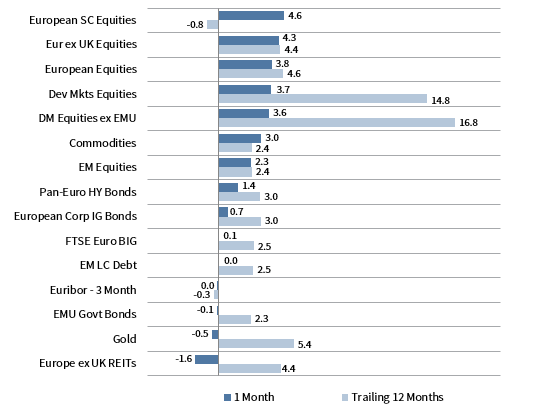
INDEX PERFORMANCE (€)
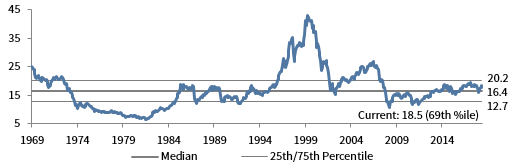
COMPOSITE NORMALIZED P/E: MSCI EUROPE EX UK
December 31, 1969 – April 30, 2019
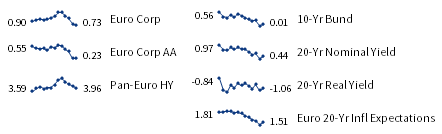
FIXED INCOME YIELDS
April 2018 – April 2019
Sources: Bloomberg Index Services Limited, Bloomberg L.P., Citigroup Global Markets, EPRA, FTSE International Limited, J.P. Morgan Securities, Inc., MSCI Inc., National Association of Real Estate Investment Trusts, Standard & Poor’s, and Thomson Reuters Datastream. MSCI data provided “as is” without any express or implied warranties.
GBP Market Performance as of April 30, 2019
UK mid-cap stocks outperformed broader UK equities, which lagged developed markets counterparts. UK gilts and linkers declined the most in April as hard Brexit fears diminished; high yield and IG corporates outperformed among UK bond sectors. UK REITs advanced but have lagged over the past year.
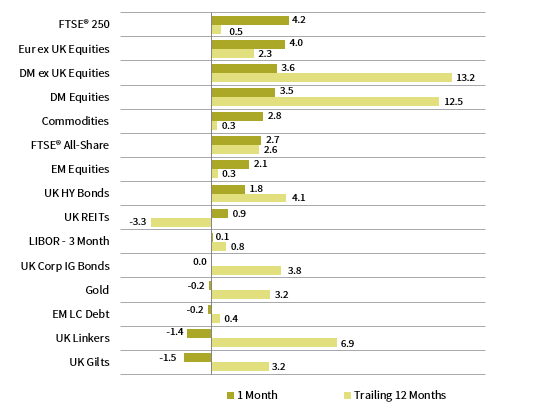
INDEX PERFORMANCE (₤)
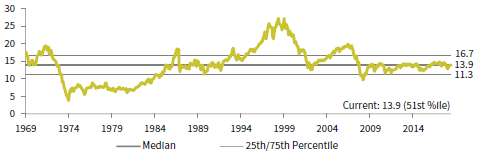
COMPOSITE NORMALIZED P/E: MSCI UK
December 31, 1969 – April 30, 2019
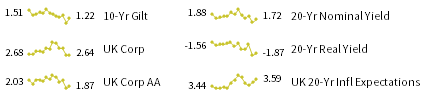
FIXED INCOME YIELDS
April 2018 – April 2019
Sources: Bloomberg Index Services Limited, Bloomberg L.P., BofA Merill Lynch, EPRA, FTSE International Limited, J.P. Morgan Securities, Inc., MSCI Inc., National Association of Real Estate Investment Trusts, Standard & Poor’s, and Thomson Reuters Datastream. MSCI data provided “as is” without any express or implied warranties.
Exhibit Notes
Performance Exhibits
Total return data for all MSCI indexes are net of dividend taxes.
US dollar index performance chart includes performance for the Bloomberg Barclays Aggregate Bond, Bloomberg Barclays Corporate Investment Grade, Bloomberg Barclays High-Yield Bond, Bloomberg Barclays Municipal Bond, Bloomberg Barclays US TIPS, Bloomberg Barclays US Treasuries, BofA Merrill Lynch 91-Day Treasury Bills, FTSE® NAREIT All Equity REITs, J.P. Morgan ELMI+, J.P. Morgan GBI-EM Global Diversified, MSCI Emerging Markets, MSCI World, Russell 2000®, S&P 500, and S&P GSCI™ indexes.
Euro index performance chart includes performance for the Bloomberg Barclays Euro-Aggregate: Corporate, Bloomberg Barclays Pan-Euro High Yield, Citigroup EMU Govt Bonds, Citigroup Euro Broad Investment-Grade Bonds, Euribor 3-month, FTSE® EPRA/NAREIT Europe ex UK, J.P. Morgan ELMI+, J.P. Morgan GBI-EM Global Diversified, MSCI Emerging Markets, MSCI Europe, MSCI Europe ex UK, MSCI Europe Small-Cap, MSCI World ex EMU, MSCI World, and S&P GSCI™ indexes.
UK sterling index performance chart includes performance for the Bloomberg Barclays Sterling Aggregate: Corporate Bond, BofA Merrill Lynch Sterling High Yield, FTSE® 250, FTSE® All-Share, FTSE® British Government All Stocks, FTSE® British Government Index-Linked All Stocks, FTSE® EPRA/NAREIT UK RE, J.P. Morgan ELMI+, J.P. Morgan GBI-EM Global Diversified, LIBOR 3M GBP, MSCI Emerging Markets, MSCI Europe ex UK, MSCI World, MSCI World ex UK, and S&P GSCI™ indexes.
Valuation Exhibits
The composite normalized P/E ratio is calculated by dividing the inflation-adjusted index price by the simple average of three normalized earnings metrics: ten-year average real earnings (i.e., Shiller earnings), trend-line earnings, and return on equity–adjusted earnings. We have removed the bubble years 1998–2000 from our mean and standard deviation calculations. All data are monthly.
Fixed Income Yields
US fixed income yields reflect Bloomberg Barclays Municipal Bond Index, Bloomberg Barclays US Corporate High Yield Bond Index, Bloomberg Barclays US Corporate Investment-Grade Bond Index, and the ten-year Treasury.
European fixed income yields reflect the BofA Merrill Lynch Euro Corporate AA Bond Index, BofA Merrill Lynch Euro Corporate Bond Index, Bloomberg Barclays Pan-European Aggregate High Yield Bond Index, Bloomberg Twenty-Year European Government Bond Index (nominal), ten-year German bund, 20-year European Inflation Swaps (inflation expectations), and the real yield calculated as the difference between the inflation expectation and nominal yield.
UK sterling fixed income yields reflect the Bank of England 20-year nominal yields, Bloomberg Generic UK 20-year inflation-linked (real) yields, ICE BofAML Sterling Corporate AA Bond Index, ICE BofAML Sterling Corporate Bond Index, and UK ten-year gilts.