Capital markets were mixed in April as global risk assets generally advanced, while bonds mostly declined. Global equities gained, though several countries and regions remain down year-to-date. Developed markets stocks outpaced emerging markets counterparts, developed ex US equities outperformed US equivalents, and value bested growth on a global basis—all fairly new trends. Global government bonds retreated as US Treasury yields touched multi-year highs, though high-yield corporate bonds still generated slight gains. Real assets performance was strong, led by global natural resources equities and commodities, and returns for developed markets REITs also improved. Among currencies, the US dollar enjoyed broad strength, while the euro and UK sterling experienced mixed results versus major peers.
April brought a more positive backdrop for global risk assets despite a further pickup in US Treasury yields and still-heightened capital markets volatility relative to last year. Yet, gains by global equities were relatively muted in light of strong first quarter earnings results, particularly in the United States, as concerns surfaced that last quarter could mark the peak for corporate fundamentals amid growing geopolitical and economic policy risks. Relative asset class performance last month appeared to reflect shifting sentiment regarding global growth and inflation prospects, with the United States now exhibiting stronger trends versus the rest of the world, which is more vulnerable to unilateral trade actions, though some risks appear to have subsided for now. Yield spreads widened between US and global bonds, the US dollar rallied against most major currencies, and emerging markets equity leadership appeared to wane. Yet, last month also saw more domestic-focused global ex US small caps lag their more export-oriented large-cap brethren and a substantial equity sector rotation as global energy stocks rallied nearly 10% and information technology stocks treaded water. By the end of last month, most major equity regions had recovered most, if not all, of their prior year-to-date losses, but for global stocks to experience another leg higher will require bond yields to stabilize, equity market volatility to moderate further, and economic indicators to resume positive surprises versus expectations.
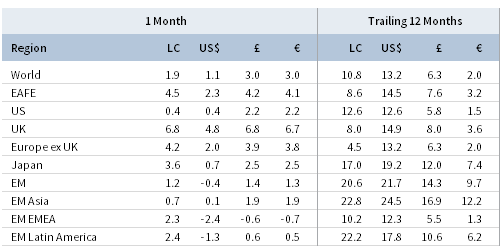
TOTAL RETURN FOR MSCI INDEXES (%)
US equities (0.4% for the S&P 500 Index) advanced, breaking a two-month decline, but remain down year-to-date. Six of 11 sectors were in the black for the month, led by a surge in energy stocks; consumer discretionary and utilities also outperformed, while consumer staples and industrials declined the most. Information technology stocks, facing potential headwinds from regulators and trade spats, were flat in April after outperforming in first quarter and last year. While still early in the reporting season, first quarter earnings per share (EPS) are expected to grow 23% year-over-year, the largest percent increase since third quarter 2010. Based on those companies reporting updates to future earnings estimates, the earnings outlook appears more mixed, which may help explain US equities’ muted response to the latest results. Macro data were generally positive in first quarter as labor markets remained strong, inflation ticked higher, and first quarter GDP growth, estimated at 2.3% annualized, exceeded consensus expectations and suggested economic activity remains above trend. The Federal Reserve Open Market Committee meets in early May and is expected to keep policy largely unchanged.
European equities (2.8% in USD, 4.6% in EUR, and 4.7% in GBP terms) outperformed developed markets counterparts, helped by a sharp rebound in UK stocks and strong early earnings results across the Continent. With one-quarter of companies in the Stoxx Europe 600 Index reporting, first quarter EPS growth is estimated at 15% year-over-year, driven by cyclicals and financials. However, Eurozone economic data were mostly disappointing as the regional manufacturing PMI declined, inflation remained well below the European Central Bank’s target, and retail sales weakened despite a slight improvement in consumer confidence. Germany advanced but underperformed broader Europe as the country reported its weakest trade figures to start a year since 2009; in contrast, Italy led all developed markets despite failed talks to form a coalition government, increasing the likelihood of a new election this summer. In the United Kingdom, Brexit negotiations moved sideways as the UK Parliament debated limitations to Prime Minister Theresa May’s ability to act unilaterally regarding negotiations. Central bank chairmen in the United Kingdom and Eurozone tempered expectations for monetary policy normalization as Bank of England (BOE) Governor Mark Carney suggested further rate hikes are not a foregone conclusion, and European Central Bank (ECB) President Mario Draghi acknowledged a “loss of momentum” in the pace of the Eurozone recovery.
Japanese equities (0.7% in USD, 2.5% in EUR, and 2.5% in GBP terms) advanced for the month but, given yen weakness, underperformed developed markets peers in major currency terms as initial corporate results for the first calendar quarter (and last of Japan’s fiscal year 2017), though still healthy, are more subdued than the double-digit growth of recent quarters. Economic data were mixed as retail sales and industrial production beat expectations, but showed a weakening trend, inflation remained modest, and housing starts declined significantly more than expected. Bank of Japan (BOJ) policy remained unchanged, as BOJ Governor Haruhiko Kuroda announced that the gradual normalization of monetary conditions will be considered once the 2% inflation target is reached “sometime within the next five years.” The BOJ’s more open-ended time frame abandons long-standing language providing a specific estimated timetable—most recently “around fiscal year 2019,” following a half dozen postponements since stimulus began in 2013—for reaching the 2% inflation target, which could potentially undermine the BOJ’s credibility among market participants. Political uncertainty is also heightened as Prime Minister Shinzo Abe remains entrenched in multiple political scandals, which could stymie further progress on the Abenomics economic reform agenda in the near term.
Emerging markets equities (-0.4% in USD, 1.3% in EUR, and 1.4% in GBP terms) underperformed developed markets equivalents as dollar strength, geopolitical and trade tensions, and rising interest rates weighed on returns. In major currency terms, heavily weighted emerging Asia was the top-performing region, followed by Latin America and emerging Europe, the Middle East & Africa as currency weakness for major markets—Russia, South Africa, and Brazil—in the latter two regions was a particular headwind. Russia and Turkey were the bottom performers in major currency terms due to new sanctions (Russia) and sticky inflation (Turkey). Top performers included Greece, which progressed on its post-bailout plans, Euro Area debt relief negotiations, and improved economic momentum; Colombia and Qatar outperformed on surging energy prices. Heavily weighted Taiwan underperformed the broader market, weighed down by festering trade disputes between the United States and China—particularly concerning the global technology sector—and the declining full-year revenue outlook at index stalwart Taiwan Semiconductor Manufacturing Co.
Real assets broadly gained in April, supported by stronger commodity prices. Commodity futures advanced (2.6% for the Bloomberg Commodity TR Index and 5.0% for the energy-heavy S&P GSCI™ Index) as gains in energy and industrial metals buoyed returns. Oil prices (ending at $75.17 for Brent and $68.57 for WTI) finished the month at their highest levels since fourth quarter 2014 on shrinking inventories and increased demand, as well as a number of geopolitical catalysts including a US-led strike on Syria, deteriorating economic crisis in Venezuela, and the Trump administration’s upcoming decision on whether to pull the United States out of the Iran nuclear deal. Global natural resources equities (8.1% for the MSCI World Natural Resources Index in USD terms) and energy MLPs (8.1%) outperformed most asset classes for the month. Developed REITs (2.0% in USD terms) underperformed other real assets categories but beat global equities and bonds; UK REITs (5.0%) and Europe ex UK REITs (4.3%) outperformed US REITs (0.5%) as rising US bond yields weighed on the latter. Gold (-0.8%) declined in USD terms to $1,313.18/troy ounce in response to dollar strength.
Global government bonds declined as yields climbed on mixed economic data and increasing economic policy uncertainty. UK gilts (-1.0%), US Treasuries (-0.8%), and EMU government bonds (-0.4%) all retreated. The US Treasury yield curve shifted higher as intra-month flattening largely reversed toward the end of the month. The benchmark ten-year versus two-year yield spread finished the month down just 1 basis point (bp) but touched its lowest day-end level since September 2007. Five- and ten-year Treasury yields backed up 23 bps and 21 bps to end at 2.79% and 2.95%, respectively, but fell in the final days of the month from more elevated levels when the ten-year yield briefly rose above 3.00% for the first time in more than four years. US tax-exempt bonds (-0.4%) edged Treasuries and remain up over the trailing 12 months despite recent losses. The UK gilt yield curve steepened a bit as five- and ten-year yields increased 2 bps and 9 bps to end the month at 1.05% and 1.51%, respectively. US credit spreads widened, though US high-yield bonds (0.7%) managed slight gains and continued to outpace US investment-grade corporates (-0.9%). US TIPS (-0.1%) outperformed nominal Treasuries as real yields and inflation expectations rose. UK linkers (-2.6%), however, underperformed nominal gilts as inflation fell sharper than expected and BOE Governor Carney clouded the outlook for further rate hikes.
Among major currencies, the US dollar was stronger, the euro and UK sterling were mixed, and the yen was weaker. The US dollar gained against all but the Canadian dollar in April amid rising interest rates, appreciating the most against the Swiss franc, Japanese yen, and our equal-weighted emerging markets currency basket. Despite last month’s rally, the greenback was weaker in the trailing 12-month period versus every major currency we cover, including our EM basket. The euro appreciated against the Swiss franc, Japanese yen, our EM currency basket, and UK sterling but declined against the Canadian, US, and Australian dollars. Over the past year, the euro strengthened broadly. UK sterling gained against the Swiss franc, Japanese yen, and our equal-weighted EM basket, but declined against the Canadian dollar, US dollar, Australian dollar, and euro. The pound sterling gained against all but the euro and Canadian dollar over the trailing 12 months.
Market Exhibits
Currency Performance as of April 30, 2018
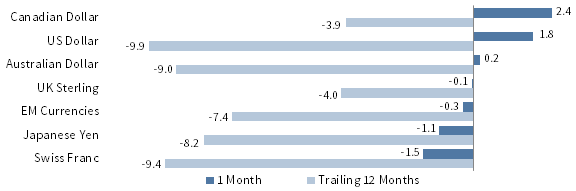
The US dollar gained against all but the Canadian dollar in April amid rising interest rates, appreciating the most against the Swiss franc, Japanese yen, and our EM currency basket. Despite last month’s rally, the greenback remains broadly weaker over the trailing 12 months, particularly against the euro
VERSUS THE US DOLLAR
Total Return (%)
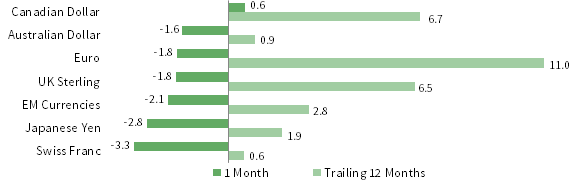
Euro performance was mixed in April, appreciating against the Swiss franc, Japanese yen, our equal-weighted EM currency basket, and UK sterling, but declining against the Canadian, US, and Australian dollars as economic
data disappointed and ECB President Draghi acknowledged a “loss of momentum” in the Euro Area’s recovery
VERSUS THE EURO
Total Return (%)
UK sterling performance was mixed in April, appreciating against the Swiss franc, Japanese yen, and our equal-weighted EM basket, but declining against the Canadian dollar, US dollar, Australian dollar, and euro as BOE Governor Carney suggested further rate hikes are not a foregone conclusion

VERSUS THE POUND STERLING
Total Return (%)
Sources: MSCI Inc. and Thomson Reuters Datastream. MSCI data provided “as is” without any express or implied warranties.
Note: EM currencies is an equal-weighted basket of 20 currencies.
USD Market Performance as of April 30, 2018
Commodities surged in April, outperforming global equities. Developed markets equities outpaced EM stocks, and US small caps bested US large caps, reflecting relatively new trends. US investment-grade bonds declined on rising interest rates, which along with USD strength also hit EM local currency debt

INDEX PERFORMANCE (US$)
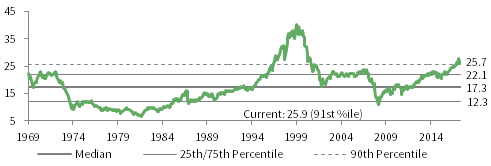
COMPOSITE NORMALIZED P/E: MSCI US
December 31, 1969 – April 30, 2018

FIXED INCOME YIELDS
April 2017 – April 2018
Sources: Barclays, Bloomberg L.P., BofA Merill Lynch, FTSE International Limited, Frank Russell Company, J.P. Morgan Securities, Inc., MSCI Inc., National Association of Real Estate Investment Trusts, Standard & Poor’s, and Thomson Reuters Datastream. MSCI data provided “as is” without any express or implied warranties.
Euro Market Performance as of April 30, 2018
Commodities led gains last month, and developed markets equities advanced more than emerging markets stocks. European equities outperformed global equivalents amid strong corporate earnings results globally, while European broad investment-grade bonds (BIG) and emerging markets local currency debt declined
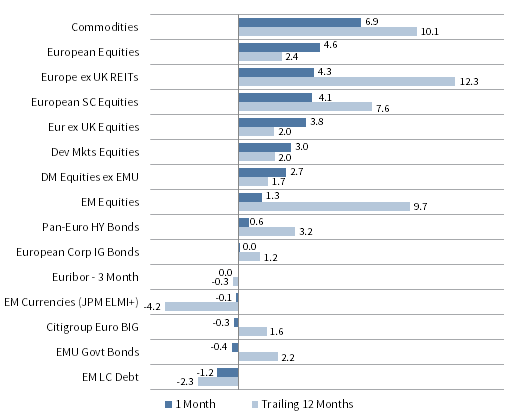
INDEX PERFORMANCE (€)
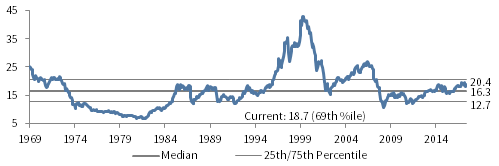
COMPOSITE NORMALIZED P/E: MSCI EUROPE EX UK
December 31, 1969 – April 30, 2018
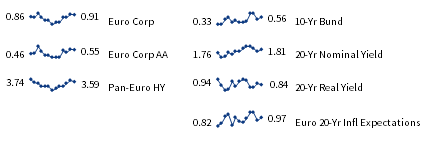
FIXED INCOME YIELDS
April 2017 – April 2018
Sources: Barclays, Bloomberg L.P., Citigroup Global Markets, EPRA, FTSE International Limited, J.P. Morgan Securities, Inc., MSCI Inc., National Association of Real Estate Investment Trusts, Standard & Poor’s, and Thomson Reuters Datastream. MSCI data provided “as is” without any express or implied warranties.
GBP Market Performance as of April 30, 2018
Commodities and UK equities rallied in April, outpacing healthy gains by global stocks. UK high-yield bonds also advanced, outperforming UK investment-grade corporates and gilts, which fell as BOE Governor Carney clouded the outlook for further rate hikes. UK linkers and EM LC debt declined the most
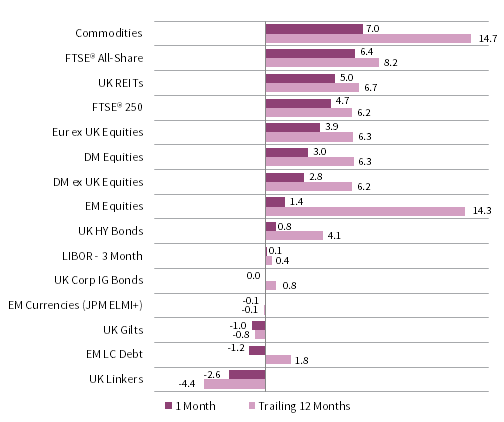
INDEX PERFORMANCE (₤)
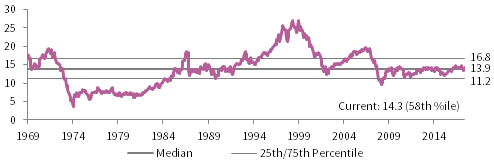
COMPOSITE NORMALIZED P/E: MSCI UK
December 31, 1969 – April 30, 2018
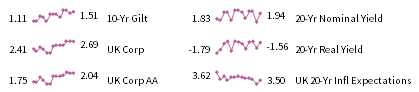
FIXED INCOME YIELDS
April 2017 – April 2018
Sources: Barclays, Bloomberg L.P., BofA Merill Lynch, EPRA, FTSE International Limited, J.P. Morgan Securities, Inc., MSCI Inc., National Association of Real Estate Investment Trusts, Standard & Poor’s, and Thomson Reuters Datastream. MSCI data provided “as is” without any express or implied warranties.
Exhibit Notes
Performance Exhibits
Total return data for all MSCI indexes are net of dividend taxes.
US dollar index performance chart includes performance for the Bloomberg Barclays Aggregate Bond, Bloomberg Barclays Corporate Investment Grade, Bloomberg Barclays High-Yield Bond, Bloomberg Barclays Municipal Bond, Bloomberg Barclays US TIPS, Bloomberg Barclays US Treasuries, BofA Merrill Lynch 91-Day Treasury Bills, FTSE® NAREIT All Equity REITs, J.P. Morgan ELMI+, J.P. Morgan GBI-EM Global Diversified, MSCI Emerging Markets, MSCI World, Russell 2000®, S&P 500, and S&P GSCI™ indexes.
Euro index performance chart includes performance for the Bloomberg Barclays Euro-Aggregate: Corporate, Bloomberg Barclays Pan-Euro High Yield, Citigroup EMU Govt Bonds, Citigroup Euro Broad Investment-Grade Bonds, Euribor 3-month, FTSE® EPRA/NAREIT Europe ex UK, J.P. Morgan ELMI+, J.P. Morgan GBI-EM Global Diversified, MSCI Emerging Markets, MSCI Europe, MSCI Europe ex UK, MSCI Europe Small-Cap, MSCI World ex EMU, MSCI World, and S&P GSCI™ indexes.
UK sterling index performance chart includes performance for the Bloomberg Barclays Sterling Aggregate: Corporate Bond, BofA Merrill Lynch Sterling High Yield, FTSE® 250, FTSE® All-Share, FTSE® British Government All Stocks, FTSE® British Government Index-Linked All Stocks, FTSE® EPRA/NAREIT UK RE, J.P. Morgan ELMI+, J.P. Morgan GBI-EM Global Diversified, LIBOR 3M GBP, MSCI Emerging Markets, MSCI Europe ex UK, MSCI World, MSCI World ex UK, and S&P GSCI™ indexes.
Valuation Exhibits
The composite normalized P/E ratio is calculated by dividing the inflation-adjusted index price by the simple average of three normalized earnings metrics: ten-year average real earnings (i.e., Shiller earnings), trend-line earnings, and return on equity–adjusted earnings. We have removed the bubble years 1998–2000 from our mean and standard deviation calculations. All data are monthly.
Fixed Income Yields
US fixed income yields reflect Bloomberg Barclays Municipal Bond Index, Bloomberg Barclays US Corporate High Yield Bond Index, Bloomberg Barclays US Corporate Investment-Grade Bond Index, and the ten-year Treasury.
European fixed income yields reflect the BofA Merrill Lynch Euro Corporate AA Bond Index, BofA Merrill Lynch Euro Corporate Bond Index, Bloomberg Barclays Pan-European Aggregate High Yield Bond Index, Bloomberg Twenty-Year European Government Bond Index (nominal), ten-year German bund, 20-year European Inflation Swaps (inflation expectations), and the real yield calculated as the difference between the inflation expectation and nominal yield.
UK sterling fixed income yields reflect the BofA Merrill Lynch Sterling Corporate AA Bond Index, BofA Merrill Lynch Sterling Corporate Bond Index, UK ten-year gilts, Bank of England 20-year nominal yields, and Bloomberg Generic UK 20-year inflation-linked (real) yields. Current UK 20-yr nominal yield data are as of April 26, 2018.