Geopolitical developments were important drivers of capital markets performance in April, with the French presidential election and growing tensions with North Korea weighing on market sentiment for most of the month until easing somewhat in the final week. Global equities continued to advance amid heightened volatility, with some first quarter trends continuing and others reversing. Emerging markets stocks maintained their outperformance versus developed markets, and growth equities continued to outpace value stocks, but global small caps bounced back to outperform large caps. Global investment-grade bonds advanced but underperformed equities in most markets. Returns were weakest for natural resources equities and commodities, which suffered declines. The US dollar weakened on a trade-weighted basis, while the euro and UK sterling strengthened.
So far this year, the equity and bond markets have been telling two different stories about the strength and sustainability of the global reflation theme. Global equities have been buoyed by a continued strong rebound in earnings growth, as well as positive trends in underlying economic data, particularly outside the United States, and have mostly shrugged off heightened economic policy uncertainty and geopolitical risks. In contrast, bond markets have appeared more wary of political risks and more skeptical about policymakers’ ability to engineer a sustainable pick-up in growth and inflation beyond the current cyclical recovery, regardless of the outcome of recent and upcoming elections. Part of the disparity could be that the bond market in particular may have moved too far too fast following the US election outcome in ascribing high confidence to President Trump’s and Congress’s ability to pass significant economic reforms. Likewise with politics in Europe, even with far-right populists failing so far to gain power from Eurocentric parties, the bond market appears to reflect the ongoing structural challenges to a higher growth and inflation trend. Hard economic data in the United States have also failed to keep pace with the strong initial positive momentum in confidence surveys, and the equity market seems to have concluded the Federal Reserve has taken a dovish turn given its apparent shift in focus toward balance sheet rationalization coupled with the typically weak first quarter economic data. As a result, global equities continue to discount a cyclical recovery supported by ongoing monetary policy accommodation and the possibility for more fiscal support, while global bond yields reflect a continued regime of lower for longer.
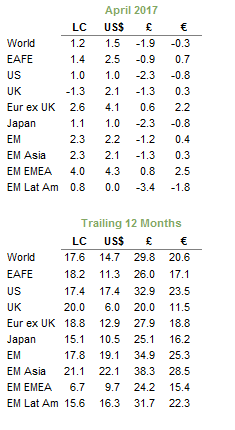
Total Return for MSCI Indexes (%)
US equities (1.0%) advanced for a sixth consecutive month on the back of strong earnings results but failed to outperform global counterparts. With a little over half of S&P 500 companies reporting, earnings growth for first quarter is estimated to be 13%, led by a sharp rebound in energy sector profitability, as well as double-digit earnings growth for financials, materials, and information technology. Yet, strong earnings growth in first quarter did not necessarily translate into sector outperformance in April, as energy and financials declined. However, IT posted the top sector return once again, as renewed appetite for technology stocks pushed the Nasdaq Composite above 6,000 for the first time on April 25, followed closely by consumer discretionary. Among market segments, mega-cap growth stocks led gains, while mega-cap value and large-cap value experienced slight declines.
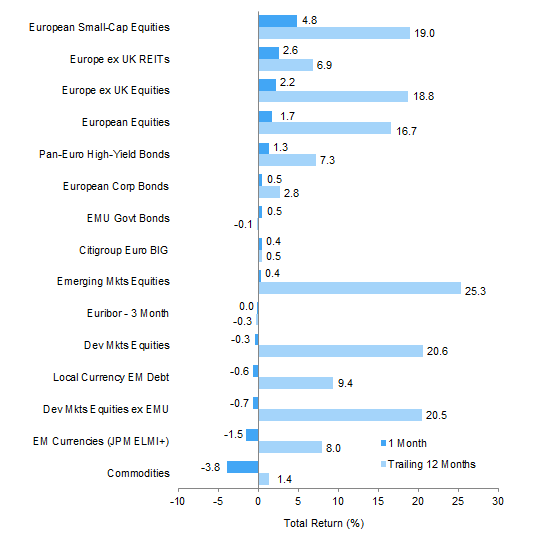
European equities outperformed other developed regions in April, despite declines in the United Kingdom, reflecting strong earnings growth and decreased political risk following the French presidential election’s first round ballot results. Europe ex UK (2.6%) stocks outperformed EMU (2.3%) and UK (-1.3%) equivalents. The euro and Eurozone equities rallied after centrist Emmanuel Macron secured the highest number of votes in the first round of the French presidential election and advanced to a second-round runoff with anti-EU candidate Marine Le Pen, where he is expected by polls to prevail, calming investors’ fears. Eurozone inflation climbed to 1.9% in April, close to the European Central Bank’s 2% target, following a tumble in March. Core inflation was even more optimistic, rising to 1.2%, the highest level since 2013. UK equities swung from gains to losses following Prime Minister Theresa May’s surprise announcement of a snap general election in June. Most of this reversal was due to weaker-than-expected economic data and currency strength, as the pound rallied to its strongest level in seven months. With approximately two-thirds of the MSCI UK’s revenues derived from abroad, the stronger British pound weighed on the profit outlook for UK large caps. UK economic growth for the first quarter slowed to its weakest pace in a year; however the IMF recently upgraded its forecast for full-year 2017 growth from 1.5% to 2.0% as the economy has been more resilient than anticipated following the June 2016 referendum to leave the EU.
Japanese equities (1.1%) bounced back in April, but the stock market maintained its negative correlation with the currency, turning returns for unhedged European investors into losses (-2.3% and -0.8% in GBP and EUR terms, respectively). Earnings growth, estimated at 16% in the first quarter, remains strong, and some economic data have shown signs of improvement. Core inflation increased 0.2% in March, unemployment remained at a two-decade low of 2.8%, and retail sales climbed 2.1%, above the 1.5% forecast. However, the Bank of Japan left its extraordinarily accommodative policy stance in place as policymakers highlighted ongoing weakness in the inflation outlook, despite a more upbeat assessment of the economy.
Emerging markets equities beat developed markets counterparts, returning 2.2% in USD terms (although just 0.4% in euros and -1.2% in GBP). By region, emerging Europe, the Middle East & Africa performed best, heavily weighted emerging Asia was in line with the overall index, and Latin America trailed. Chinese GDP grew 6.9% in the first quarter, above consensus expectations and the strongest quarterly growth in 18 months. Foreign portfolio flows into emerging markets equities were slightly weaker in April compared to March but have been positive for five straight months as the softer US dollar has boosted the appeal of the EM carry trade.
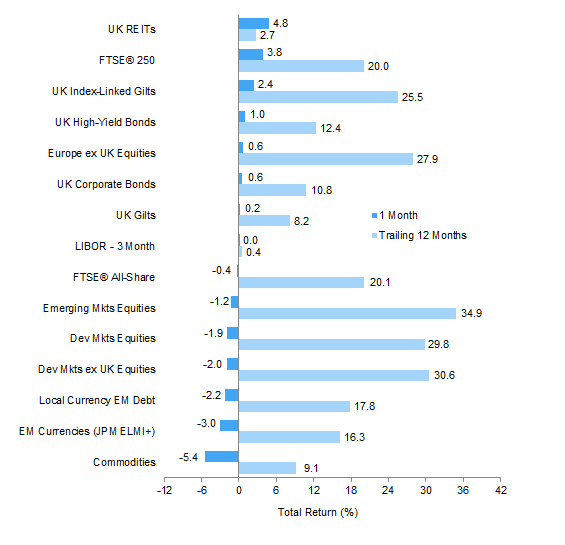
Real assets experienced a range of performance outcomes depending on the category. Commodity futures declined (-1.5% for the Bloomberg Commodity TR Index and -2.1% for the energy-heavy S&P GSCI™) as losses in energy and industrial metals weighted on returns. Headwinds to crude oil prices primarily stem from growing US stockpiles, and the ramp up in storage capacity also squeezed demand for longer-dated US oil futures. WTI and Brent returned -2.5% and -2.1% for the month, ending at $49.33 and $51.73, respectively. Among industrial metals, iron ore touched a six-month low as demand in China fell due to record high inventories, but prices regained some ground in the final trading days. Weak commodity prices also appeared to drive declines in global natural resources equities (-2.2% for the MSCI World Natural Resources Index in USD terms) and energy MLPs (-1.3%). Global developed REITs (1.1% in USD terms) gained in April, led by UK REITs (4.8%) and Europe ex UK REITs (2.6%); US REITs (0.4%) underperformed, hurt by a sell-off in some retail-oriented REITs. Gold advanced 1.7% to $1,267.86/troy ounce, bringing year-to-date returns to 9.5%.
Global developed markets government bonds advanced in April as investors sought safe havens from geopolitical risks and economic momentum slowed. US Treasuries (0.7%) outperformed EMU government bonds (0.5%) and UK gilts (0.2%), although gilts still lead on a year-to-date basis. The US Treasury yield curve continued to flatten—ten-year bond yields fell to the lowest level since November’s election, and the spread between two- and ten-year Treasury yields reached a post-election low on April 18. Yields reversed course late in the month but still ended April lower than the first quarter, with the ten-year bond at 2.29%. Other sovereign bond yields followed a similar trend, touching multi-month lows before switching course following the French first-round presidential ballot. UK ten-year gilt yields ended the month down 5 basis points to 1.02%. Among inflation-linked bonds, UK linkers (2.4%) outperformed nominal gilts; US TIPS (0.6%) slightly trailed nominal Treasuries in contrast. US tax-exempt bonds (0.7%) performed in line with US Treasuries, while US high-yield bonds (1.2%) and US investment-grade bonds (1.1%) continued to outperform.
Some currencies exhibited stronger directional trends than others. The US dollar appreciated relative to the Canadian dollar and the Australian dollar but weakened vis-à-vis UK sterling, the euro, the Swiss franc, and our equal-weighted basket of EM currencies. The British pound strengthened against all currencies in April as snap elections were announced for June, which could strengthen the UK government’s hand in the Article 50 negotiations with the EU. The euro ended the month near a five-month high relative to the US dollar reached on April 25 and appreciated against all major currencies with the exception of the pound.
Market Exhibits
Currency Performance
The dollar remained soft in April, weakening vis-à-vis UK sterling, the euro, the Swiss franc, and our EM currency basket, although the greenback strengthened against the Australian dollar and the Canadian dollar and was flat versus the Japanese yen
The euro strengthened against most currencies we track, with the exception of UK sterling, reversing the trend of the past 12 months. The euro was strongest against the Canadian dollar, the only other major currency to have weakened versus the common currency over the last 12 months
The British pound reversed course in April and strengthened against all major currencies as PM Theresa May announced a snap general election for June, which could strengthen the UK government’s hand in Article 50 negotiations with the EU. Despite April’s rally, the pound has fallen against all developed markets currencies and our EM currency basket over the last 12 months
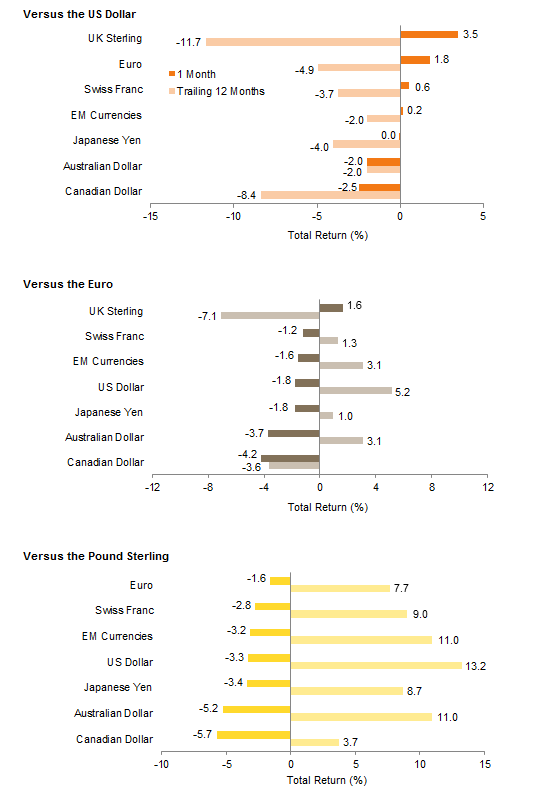
Currency Performance
As of April 30, 2017
Sources: MSCI Inc. and Thomson Reuters Datastream. MSCI data provided “as is” without any express or implied warranties.
Note: EM currencies is an equal-weighted basket of 20 currencies.
Index Performance (US$)
Emerging markets equities and debt continued to outperform, supported by a softer US dollar. High-yield bonds beat out US equities and continued their outperformance over other fixed income categories. US small-cap stocks outperformed large caps and are the top-performing asset class on a trailing 12-month basis. Commodities lagged for the month and year
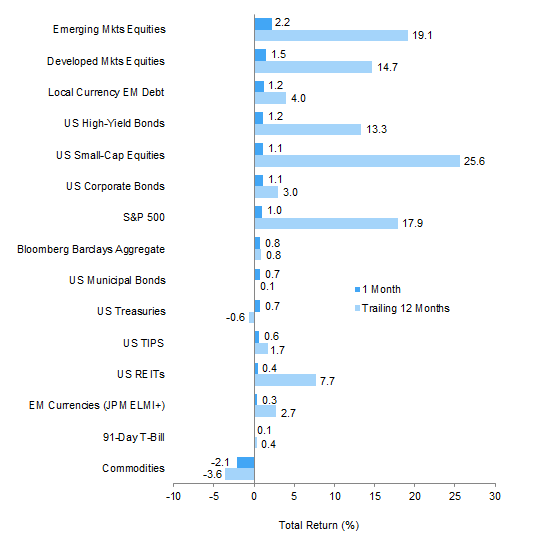
Index Performance (US$)
As of April 30, 2017

MSCI US Composite Normalized P/E
December 31, 1969 – April 30, 2017
Sources: Barclays, Bloomberg L.P., BofA Merill Lynch, FTSE International Limited, Frank Russell Company, J.P. Morgan Securities, Inc., MSCI Inc., National Association of Real Estate Investment Trusts, Standard & Poor’s, and Thomson Reuters Datastream. MSCI data provided “as is” without any express or implied warranties.
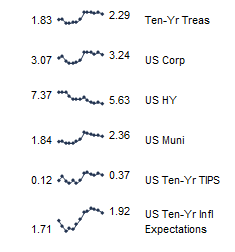
Fixed Income Yields
April 2016 – April 2017
Index Performance (€)
European small caps and Europe ex UK REITs outperformed European large caps in April. European bonds trailed regional equities but also advanced, led by high-yield bonds. Euro strength was a headwind to unhedged returns from outside of the region, with emerging markets equities barely advancing but still outperforming developed markets counterparts, which declined slightly
Index Performance (€)
As of April 30, 2017
MSCI Europe ex UK Composite Normalized P/E
December 31, 1969 – April 30, 2017
Sources: Barclays, Bloomberg L.P., Citigroup Global Markets, EPRA, FTSE International Limited, J.P. Morgan Securities, Inc., MSCI Inc., National Association of Real Estate Investment Trusts, Standard & Poor’s, and Thomson Reuters Datastream. MSCI data provided “as is” without any express or implied warranties.
Fixed Income Yields
April 2016 – April 2017
Index Performance (₤)
Sterling investors experienced a wide range of returns for April, with the currency’s strong rally weighing on returns for UK large caps, as well as unhedged assets outside the United Kingdom. UK REITs and UK mid caps outperformed UK large caps, which declined. UK linkers and UK high-yield bonds outpaced UK gilts, which also advanced. Emerging and developed markets equity gains were turned into losses by pound strength
Index Performance (£)
As of April 30, 2017

MSCI UK Composite Normalized P/E
December 31, 1969 – April 30, 2017
Sources: Barclays, Bloomberg L.P., BofA Merill Lynch, EPRA, FTSE International Limited, J.P. Morgan Securities, Inc., MSCI Inc., National Association of Real Estate Investment Trusts, Standard & Poor’s, and Thomson Reuters Datastream. MSCI data provided “as is” without any express or implied warranties.

Fixed Income Yields
April 2016 – April 2017
Exhibit Notes
Performance Exhibits
Total return data for all MSCI indexes are net of dividend taxes.
US dollar index performance chart includes performance for the Bloomberg Barclays Aggregate Bond, Bloomberg Barclays Corporate Investment Grade, Bloomberg Barclays High-Yield Bond, Bloomberg Barclays Municipal Bond, Bloomberg Barclays US TIPS, Bloomberg Barclays US Treasuries, BofA Merrill Lynch 91-Day Treasury Bills, FTSE® NAREIT All Equity REITs, J.P. Morgan ELMI+, J.P. Morgan GBI-EM Global Diversified, MSCI Emerging Markets, MSCI World, Russell 2000®, S&P 500, and S&P GSCI™ indexes.
Euro index performance chart includes performance for the Bloomberg Barclays Euro-Aggregate: Corporate, Bloomberg Barclays Pan-Euro High Yield, Citigroup EMU Govt Bonds, Citigroup Euro Broad Investment-Grade Bonds, EURIBOR 3M, FTSE® EPRA/NAREIT Europe ex UK, J.P. Morgan ELMI+, J.P. Morgan GBI-EM Global Diversified, MSCI Emerging Markets, MSCI Europe, MSCI Europe ex UK, MSCI Europe Small-Cap, MSCI World ex EMU, MSCI World, and S&P GSCI™ indexes.
UK sterling index performance chart includes performance for the Bloomberg Barclays Sterling Aggregate: Corporate Bond, BofA Merrill Lynch Sterling High Yield, FTSE® 250, FTSE® All-Share, FTSE® British Government All Stocks, FTSE® British Government Index-Linked All Stocks, FTSE® EPRA/NAREIT UK RE, J.P. Morgan ELMI+, J.P. Morgan GBI-EM Global Diversified, LIBOR 3M GBP, MSCI Emerging Markets, MSCI Europe ex UK, MSCI World, MSCI World ex UK, and S&P GSCI™ indexes.
Valuation Exhibits
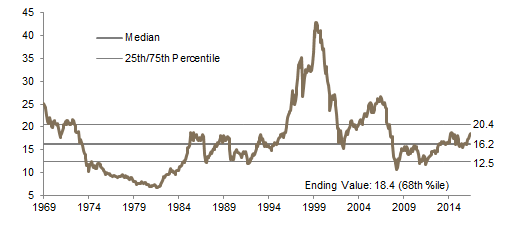
The composite normalized P/E ratio is calculated by dividing the inflation-adjusted index price by the simple average of three normalized earnings metrics: ten-year average real earnings (i.e., Shiller earnings), trend-line earnings, and return on equity–adjusted earnings. We have removed the bubble years 1998–2000 from our mean and standard deviation calculations. All data are monthly.
Fixed Income Yields
US fixed income yields reflect Bloomberg Barclays Municipal Bond Index, Bloomberg Barclays US Corporate High-Yield Bond Index, Bloomberg Barclays US Corporate Investment-Grade Bond Index, and the ten-year Treasury.
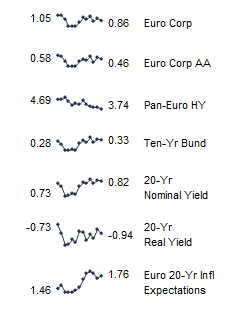
European fixed income yields reflect the BofA Merrill Lynch Euro Corporate AA Bond Index, BofA Merrill Lynch Euro Corporate Bond Index, Barclays Pan-European Aggregate High Yield Bond Index, Bloomberg Twenty-Year European Government Bond Index (nominal), ten-year German bund, 20-year European Inflation Swaps (inflation expectations), and the real yield calculated as the difference between the inflation expectation and nominal yield.
UK sterling fixed income yields reflect the BofA Merrill Lynch Sterling Corporate AA Bond Index, BofA Merrill Lynch Sterling Corporate Bond Index, UK ten-year gilts, and Bank of England twenty-year nominal, real, and zero coupon (inflation expectations) yields. Current UK 20-yr nominal yield, real yield, and inflation expectations data are as of April 26, 2017.