The recovery in risk assets that began in mid-February bifurcated in April. Commodities and commodity-related assets generated especially strong gains as the expected time frame for an oil market rebalancing was shortened and as monetary policy announcements put additional downward pressure on the US dollar. Global equities’ rally fizzled by comparison as catalysts for a further overall re-rating were lacking, although value indexes continued to outperform on a global basis given higher exposure to the better-performing energy, financial, and materials sectors. The outperformance of these value-oriented sectors was particularly beneficial to European equities, which enjoyed modestly positive returns; US equivalents similarly benefitted, though to a lesser extent. Japanese equities suffered small declines due to a late-month plunge after the Bank of Japan defied market expectations for further stimulus. Emerging markets equities finished just below flat in local currency terms but slightly positive in US dollar and euro terms. Investment-grade sovereign bonds retreated as recent developments tilted the balance of risks toward inflation rather than deflation.
US dollar weakness in recent months has no doubt contributed to the turnabout in and evolution of risk asset performance since mid-February in a variety of ways. Commodities have become less expensive for non-dollar consumers, stoking demand, and a weaker dollar has given emerging markets countries and companies much needed breathing room in terms of monetary policy and debt servicing (hard currency debt has become more affordable in local currency terms). The Chinese economy’s recent cyclical improvement has been driven by both fiscal stimulus and monetary easing, the latter facilitated in part by this recent US dollar weakness (and the related reduced pressure from capital outflows). The changing trajectory of US monetary policy since the start of the year has played an important role in stemming the dollar’s rally, as dovish commentary from the US Federal Reserve has scaled back the market’s expectations regarding the pace of rate hikes for the remainder of 2016. Another contributing factor has been faltering investor confidence in the ability of central banks to further stimulate their economies. Add in diverging current account balances and real interest rates, and currency investors have cut their bearish bets against the euro and yen vis-à-vis the dollar. Finally, currency strength is fading as a headwind for US firms with significant overseas revenue, though the flip side is deteriorating sentiment toward exporters in Japan and the Eurozone.
US equities (0.4%) largely treaded water in April and remain slightly positive year-to-date. Strong gains among energy and financial stocks, in particular, were offset by sharp declines in information technology as first quarter earnings began to unfold. The energy sector rally, fueled by the surge in oil prices since late January, has still been insufficient to dramatically raise estimates for 2016 earnings. The sector is expected to see earnings collapse around 69% for the year, and the latest earnings estimates suggesting an aggregate net income loss in the first quarter would mark the first such instance since the global financial crisis (when the financial sector endured successive quarterly aggregate earnings losses). The near-term earnings picture for the overall US market continues to be bleak as a result, with first quarter profits set to decline around 8%, the most on a year-over-year basis since 2009. The extent of analyst pessimism since the start of the year has not been seen since the sizeable downgrades observed during first quarter 2015. As is often the case, actual results could be better than feared, but time will tell whether the first quarter will mark the trough in the current profit recession.
European equities (1.9%) outperformed developed markets peers, with particularly strong results in Switzerland (2.8%); UK equities (1.1%) slightly edged out Eurozone equivalents (1.2%). Positive returns in April seemed to belie the fact that European equity analysts have slashed calendar year 2016 earnings estimates in recent months, as the earlier pessimism seen in the US market appears to have made its way across the Atlantic. UK earnings estimates have been downgraded in particular amid economic uncertainty and currency volatility owing to the lack of clarity regarding the country’s future European Union (EU) status. A stronger euro this year is also partly to blame for downbeat earnings expectations even as the latest economic data showed that the recovery in the common currency area remains intact.
Please see Wade O’Brien et al., “Japanese Equities: Is Abenomics Becoming a Liability?,” Cambridge Associates Research Note, April 2016.
Japanese equities (-0.4%) finished down after plunging on the final trading day when the Bank of Japan (BOJ) surprisingly refrained from announcing further stimulus at its April 27–28 meeting. Unwanted yen strength since the BOJ introduced negative interest rates has weighed on local equities, as foreign investors have appeared deeply skeptical of recent moves by Japanese policymakers. Recent lackluster economic data have likely reinforced the view that Abenomics is failing to deliver, but this seems to miss the big picture as the situation is much improved since the Abe administration came to power over three years ago. The recent sell-off has left valuations for Japanese equities undemanding, while even downgraded earnings expectations remain significantly ahead of those for the United States and Europe.
Emerging markets equities (-0.1%) were effectively flat on the month, having trailed developed equivalents all month. Regional performance was mixed: Latin America (4.3%) and emerging Europe, the Middle East & Africa (1.6%) enjoyed gains, while emerging Asia (-1.3%) continued its recent underperformance as most emerging Asian markets declined, with the exception of India (0.6%) and Thailand (0.0%). Equities of oil and commodity exporters generally fared better, among them Brazil (7.5%), Chile (1.5%), Peru (13.6%), Russia (4.9%), and the United Arab Emirates (5.1%). That said, some commodity importers like Egypt (13.3%) and Turkey (3.7%) also outperformed as their markets were to some extent buoyed by the prospect for better economic policies, similar to Brazil with rising prospects for President Dilma Rousseff’s impeachment.
US energy master limited partnerships (11.0%), commodity futures (10.1% for the energy-heavy S&P GSCI™ and 8.5% for the Bloomberg Commodity Index Total Return), and global natural resources equities (9.4%) were the top performers among inflation-sensitive assets. Within natural resources equities, previously beaten-down global metals and mining stocks (19.2%) rallied the most. Despite the failure of OPEC and Russia to agree a production freeze at a recent industry summit, crude oil prices rallied to their strongest level since November and are up more than 70% since the 13-year lows touched earlier this year—Brent closed the month at $48.13 and WTI at $45.92/barrel. Gold (4.7%) rose to $1,290.34/troy ounce amid signals the Fed may be willing to err toward allowing inflation to run above its 2% target in the future. Inflation-linked government bond performance was mixed—US TIPS (0.3%) outperformed nominal Treasuries, but UK linkers (-2.2%) declined, underperforming nominal gilts. US REITs (-1.8%) also retreated as investors shunned yield-oriented sectors.
Global government bonds (-0.2%) gave back some ground, generally underperforming equities as investors favored risky assets and near-term deflation risks appeared to recede. US Treasuries (-0.1%) outperformed UK gilts (-1.2%) and EMU sovereign bonds (-1.1%); US tax-exempt bonds (0.7%) advanced. The US Treasury yield curve steepened, with ten-year and five-year yields rising 5 bps and 7 bps, respectively. Credit spreads tightened globally across the ratings spectrum; US high yield (3.9%) rallied in particular, led by speculative-grade energy issuers.
The trade-weighted US dollar continued to weaken in response to ongoing dovish commentary from the Fed, with the Federal Open Market Committee’s April 27 press release appearing to take a potential June rate hike off the table. The Japanese yen and British pound were notable outperformers as investors adjusted positioning in response to the most recent developments. The yen rallied hard just prior to month-end after the BOJ disappointed markets on April 28 when it failed to expand its quantitative easing program despite a setback in growth and inflation. The pound recovered some of its prior lost ground vis-à-vis the dollar and euro as fears receded somewhat regarding the United Kingdom’s June referendum on EU membership. Emerging markets currencies generally strengthened in dollar and euro terms, led by commodity currencies, but weakened versus the pound and yen.
US consumer price inflation eased in March, apparently confirming the Fed’s view that some recent inflationary pressures have been transitory and providing the Fed room to hold interest rates steady in April
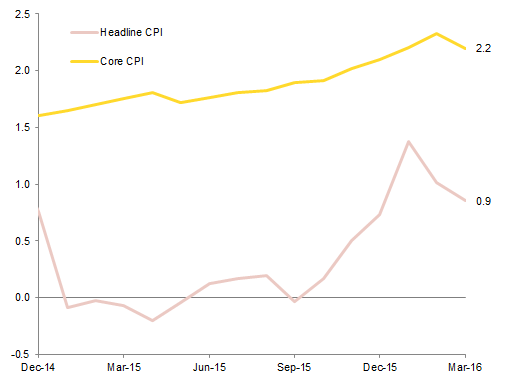
US Consumer Price Inflation
December 31, 2014 – March 31, 2016 • Year-Over-Year Percent Change (%)
Sources: Thomson Reuters Datastream and US Department of Labor – Bureau of Labor Statistics.
The recent pickup in Chinese economic growth indicators suggests that government stimulus is supporting a cyclical rebound in economic activity and that the risks of a near-term hard-landing scenario have subsided for now
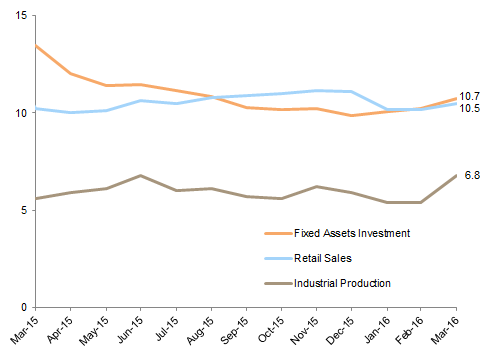
China: Economic Growth Indicators
March 31, 2015 – March 31, 2016 • Year-Over-Year Percent Change (%)
Sources: National Bureau of Statistics of China and Thomson Reuters Datastream.
Notes: Fixed assets investment data are for urban areas. January 31, 2016, fixed assets investment data are interpolated due to a gap in data reported.
First quarter 2016 year-over-year earnings growth estimates for the S&P 500 were slashed by roughly 9 ppts since the start of the quarter, the largest downgrade during the current reporting quarter since first quarter 2015. Early results suggest first quarter earnings will be somewhat better than feared
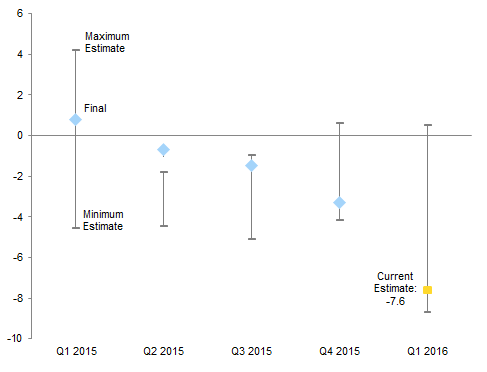
Revisions to S&P 500 Earnings Growth Estimates vs Final Results
Source: FactSet Research Systems.
Note: Data reflect maximum and minimum earnings estimates for each respective quarter end and the preceding three months, with final earnings data in blue.
Net investor positioning (vis-à-vis the US dollar) in the euro and Japanese yen has turned dramatically more bullish since the start of the year, a trend that continued in April, as relative real yields and current account balances have supported a stronger euro and yen
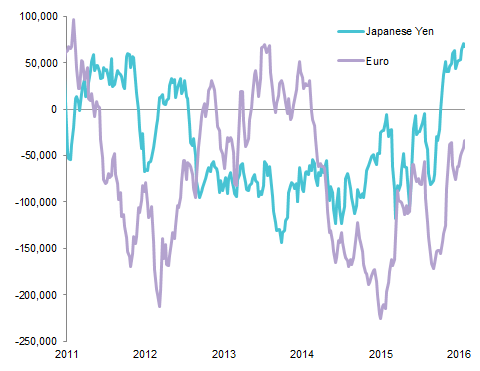
Net Non-Commercial Combined Futures and Options Positions
March 31, 2011 – April 26, 2016 • Number of Contracts
Sources: Bloomberg L.P. and Commodity Futures Trading Commission.
Note: Net non-commercial combined positions data are weekly.
The trade-weighted US dollar weakened in April, with the Japanese yen, Canadian dollar, and UK pound strengthening the most against the greenback. The yen has rallied almost 12% versus the dollar over the past 12 months
The euro gained against the US dollar and Swiss franc but retreated versus the Japanese yen and UK pound. Only the yen has appreciated against the euro on a trailing 12-month basis
The UK pound rebounded against the euro, US dollar, Swiss franc, and Australian dollar but retreated further versus the Japanese yen, with the latter having now appreciated over 17% versus the pound in the last year
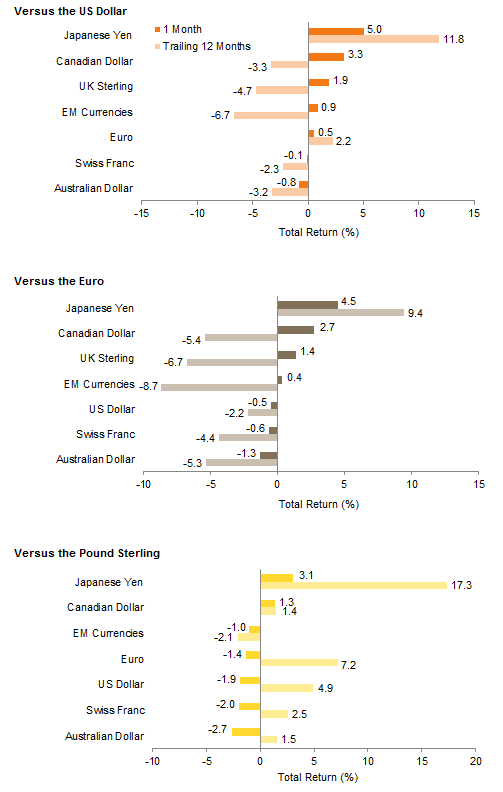
Currency Performance
As of April 30, 2016
Sources: MSCI Inc. and Thomson Reuters Datastream. MSCI data provided “as is” without any express or implied warranties.
Note: EM currencies is an equal-weighted basket of 20 currencies.
Risky assets outperformed in April, led by commodity futures, US high-yield bonds, and local currency emerging markets debt. US small-cap equities and US investment-grade corporate bonds also outperformed the S&P 500 in a sign of investors’ continued risk appetite

Index Performance (US$)
As of April 30, 2016
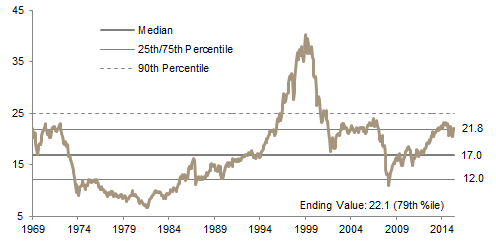
MSCI US Composite Normalized P/E
December 31, 1969 – April 30, 2016
Sources: Barclays, BofA Merill Lynch, FTSE International Limited, Frank Russell Company, J.P. Morgan Securities, Inc., MSCI Inc., National Association of Real Estate Investment Trusts, Standard & Poor’s, and Thomson Reuters Datastream. MSCI data provided “as is” without any express or implied warranties.
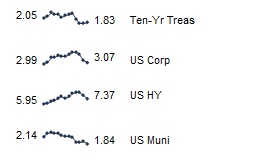
Fixed Income Yields
April 2015 – April 2016
Commodities, high-yield bonds, and local currency emerging markets debt led performance for euro-based investors. Europe ex UK REITs and investment-grade government bonds declined in contrast as investors shunned more steady yield-oriented assets
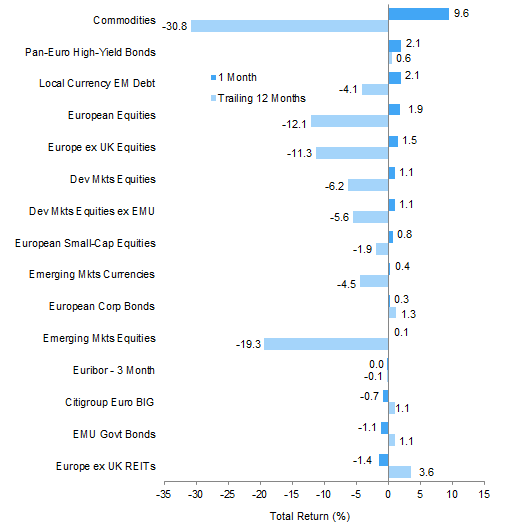
Index Performance (€)
As of April 30, 2016
MSCI Europe ex UK Composite Normalized P/E
December 31, 1969 – April 30, 2016
Sources: Barclays, Citigroup Global Markets, EPRA, FTSE International Limited, J.P. Morgan Securities, Inc., MSCI Inc., National Association of Real Estate Investment Trusts, Standard & Poor’s, and Thomson Reuters Datastream. MSCI data provided “as is” without any express or implied warranties.

Fixed Income Yields
April 2015 – April 2016
UK investors enjoyed positive returns across nearly the full spectrum of domestic risk assets: UK REITs, UK high-yield bonds, UK large-cap equities, and UK investment-grade corporate bonds. The exception were UK mid-cap equities, which declined slightly. The pound’s partial rebound in April meant that developed ex UK equities and emerging markets equities also suffered losses

Index Performance (₤)
As of April 30, 2016

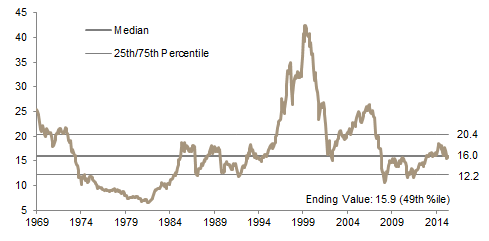
MSCI UK Composite Normalized P/E
December 31, 1969 – April 30, 2016
Sources: Barclays, BofA Merrill Lynch, EPRA, FTSE International Limited, J.P. Morgan Securities, Inc., MSCI Inc., National Association of Real Estate Investment Trusts, Standard & Poor’s, and Thomson Reuters Datastream. MSCI data provided “as is” without any express or implied warranties.
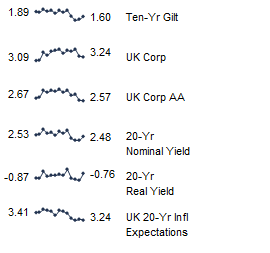
Fixed Income Yields
April 2015 – April 2016
Exhibit Notes
Performance Exhibits
Total returns for MSCI developed markets indexes are net of dividend taxes. Total returns for MSCI emerging markets indexes are gross of dividend taxes.
US dollar index performance chart includes performance for the Barclays Corporate Investment Grade, Barclays High Yield Bond, Barclays Municipal Bond, Barclays US TIPS, Barclays US Treasuries, BofA Merrill Lynch 91-Day Treasury Bills, FTSE® NAREIT All Equity REITs, J.P. Morgan ELMI+, J.P. Morgan GBI-EM Global Diversified, MSCI Emerging Markets, MSCI World, Russell 2000®, and S&P GSCI™ indexes.
Euro index performance chart includes performance for the Barclays Euro-Aggregate: Corporate, Barclays Pan-Euro High Yield, Citigroup EMU Govt Bonds, FTSE® EPRA/NAREIT Europe ex UK, J.P. Morgan ELMI+, J.P. Morgan GBI-EM Global Diversified, MSCI Emerging Markets, MSCI Europe, MSCI Europe ex UK, MSCI Europe Small Cap, MSCI World ex EMU, MSCI World, and S&P GSCI™ indexes.
UK sterling index performance chart includes performance for the Barclays Sterling Agg Corps, BofA Merrill Lynch Sterling High Yield, FTSE® British Government All Stocks, FTSE® British Government Index-Linked All Stocks, FTSE® EPRA/NAREIT UK RE, FTSE® 250, J.P. Morgan ELMI+, J.P. Morgan GBI-EM Global Diversified, MSCI Emerging Markets, MSCI Europe ex UK, MSCI World, MSCI World ex UK, and S&P GSCI™ indexes.
Valuation Exhibits
The composite normalized P/E ratio is calculated by dividing the inflation-adjusted index price by the simple average of three normalized earnings metrics: ten-year average real earnings (i.e., Shiller earnings), trend-line earnings, and return on equity–adjusted earnings. We have removed the bubble years 1998–2000 from our mean and standard deviation calculations. All data are monthly.
Fixed Income Yields
US fixed income yields reflect Barclays Municipal Bond Index, Barclays US Corporate High Yield Bond Index, Barclays US Corporate Investment-Grade Bond Index, and the ten-year Treasury.
European fixed income yields reflect the BofA Merrill Lynch Euro Corporate AA Bond Index, BofA Merrill Lynch Euro Corporate Bond Index, Barclays Pan-European Aggregate High Yield Bond Index, Bloomberg Twenty-Year European Government Bond Index (nominal), ten-year German bund, 20-year European Inflation Swaps (inflation expectations), and the real yield calculated as the difference between the inflation expectation and nominal yield.
UK sterling fixed income yields reflect the BofA Merrill Lynch Sterling Corporate AA Bond Index, BofA Merrill Lynch Sterling Corporate Bond Index, UK ten-year gilts, and Bank of England 20-year nominal, real, and zero coupon (inflation expectations) yields.