Please see our Tactical CA House Views for our latest portfolio advice.
The prospect of higher interest rates has contributed to recent equity market volatility and provided a wake-up call for investors underweight some traditional value sectors. What may surprise some investors is that even managers that style themselves as value-oriented may be underweight bellwether value sectors. That positioning likely benefited many of them in a prolonged period with low interest rates, but the circumstances seem to be changing. Now is a good time to sharpen your pencil on value manager exposures, given our preference for developed markets value equities as a risk-controlled position funded from developed markets equities.
For more on this topic, please see Joe Comras, “Tighter US Monetary Policy May Limit Upside Potential of Risk Assets,” Cambridge Associates LLC, February 2022.
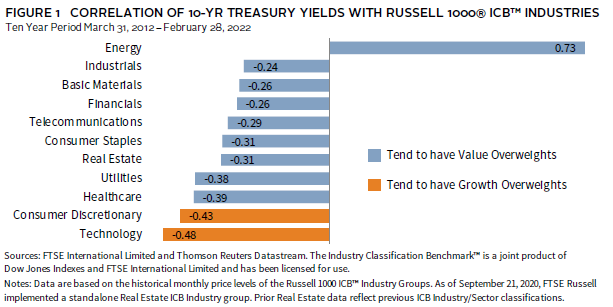
Interest rate changes impact stock prices. Figure 1 illustrates the inverse relationship between the ten-year Treasury yield and stock prices in most sectors. In addition, it highlights that equity market sectors that tend to be overweight in growth indexes (in orange) tend to be the most negatively impacted. For example, the technology and consumer discretionary sectors are the most negatively correlated of the sectors used by Russell indexes, and stocks associated with those sectors made up roughly 70% of the Russell 1000® Growth Index at the end of 2021. Conversely, sectors that featured more prominently in value indexes (in blue) were less negatively, or even positively, correlated.
In early 2022, these sector performance relationships are playing out as illustrated above and stand in contrast to the growth trend of the last decade as investors’ expectations shift to interest rate increases. In the first two months of the year, US ten-year Treasury yields were up by 20% from 1.52% to 1.83%. In US equity markets over that period, the energy sector generated a 28% return. The financials sector—the largest in the Russell 1000® Value Index—was down 2%, while the information technology and consumer discretionary sectors each declined by just over 12%. This is a change in direction from the prior decade, where major growth index sectors in developed markets around the world collectively generated more than twice the return of major value index sectors.
Please see Kevin Ely, “Catch My Drift? Active Managers’ Style Tends to Change Over Time,” Cambridge Associates LLC, September 2021.
A diversified portfolio with exposures to growth and value managers should offer some protection from such swings, but the average value manager has shown a strong correlation to growth indexes for many years. A look at the sector weights of value managers in financials and information technology illustrates one reason why—many value managers are underweight a traditional value sector like financials and overweight a traditional growth sector like information technology (Figure 2). Put together with our correlation observations, many value managers may not own much of what stands to perform better in a rising rate world. As a result, a portfolio diversified across styles may not receive the performance benefits investors expect.

For many years, the risk for a value manager from being underweight sectors like financials in a persistently low rate environment was relatively small in comparison to the prospective gains in sectors like information technology. With rates expected to rise, the risk-reward ratio of being underweight large value sectors appears higher today, and that could create an underappreciated headwind for active value managers relative to developed markets value indexes. This is not a call to go all-in on value stocks, but we advocate for an overweight to developed markets value equity, so now is a suitable time to make sure you get the full benefit of that positioning.
Kevin Ely, Managing Director, Public Equities
Index Disclosures
MSCI EAFE Value Index
The MSCI EAFE Value Index captures large- and mid-cap securities exhibiting overall value style characteristics across developed markets countries* around the world, excluding the United States and Canada. The value investment style characteristics for index construction are defined using three variables: book value to price, 12-month forward earnings to price, and dividend yield.
MSCI World Value Index
The MSCI World Value Index captures large- and mid-cap securities exhibiting overall growth style characteristics across 23 developed markets countries. The value investment style characteristics for index construction are defined using three variables: book value to price, 12-month forward earnings to price, and dividend yield.
Russell 1000® Growth Index
Russell 1000® Growth Index contains those Russell 1000® securities with a greater-than-average growth orientation. Securities in this index tend to exhibit higher price-to-book and price-earnings ratios, lower dividend yields, and higher forecasted growth values than the value universe.
Russell 1000® Value Index
The Russell 1000® Value Index contains those Russell 1000® securities with a less-than-average growth orientation. It represents the universe of stocks from which value managers typically select. Securities in this index tend to exhibit low price-to-book and price-earnings ratios, higher dividend yields, and lower forecasted growth values than the growth universe.