Three years ago, we concluded that benchmark ten-year Treasury yields would top out in a 3.5%–4.0% range in the next monetary tightening cycle. Now that the next rate hike cycle is well underway, we revisit our analysis, finding that our original assessment remains the most probable conclusion. In fact, the low end of that ceiling appears the more likely outcome today, with one important caveat: the potential for an inflationary dynamic that surprises.
Please see Stephen Saint-Leger, “How Far Will US Rates Rise in the Next Cycle?” Cambridge Associates Research Note, September 2014.
Since the secular peak in 1980, US rate hike cycles have ended at ever lower values. In a 2014 research paper, we concluded that benchmark ten-year Treasury yields would top out in a 3.5% to 4.0% range in the next monetary tightening cycle because historically high levels of leverage still in the system made the economy very sensitive to interest rates given evidence of chronically weak demand growth.
Now that the US Federal Reserve has embarked on (gradually) tightening policy, has the picture changed? The short answer is that the likely pace of rate rises and the eventual peak appear to be even more modest than envisaged three years ago, but with one important caveat. In this paper, we compare past expectations with today’s reality, review some of the reasons rates haven’t risen as expected, and discuss what may be ahead.
Comparing Then and Now
It’s no surprise that the market, and especially the Fed, were too optimistic on the direction of rates. Three years ago, the Fed expected its Fed Funds rate to adjust up to 2.5% by the end of 2016, instead of the actual 50 basis point (bp) rise (to 0.75%), with 50 bps of further rate increases in 2017, to 1.25%.
Investors expected three-month deposit rates (Eurodollar futures) to level out around 3.8% by December 2023, considerably below the last cyclical peak over 5% in 2007. Today, the market has tempered its own expectations to around 2.5% at the end of 2023, with few hikes beyond that.
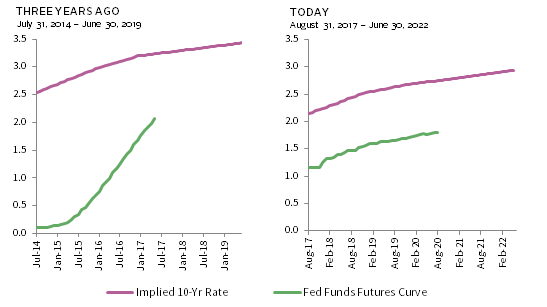
On the bond side, ten-year Treasuries were yielding around 2.3% three years ago and market expectations—as implied by the yield curve—were for yields to rise to 3.2% by the end of 2016, topping out just under 3.5% by June 2019. In fact, yields remain roughly unchanged (at the time of writing), and are not expected to rise beyond 3% in five years’ time (Figure 1), topping out around 3.2% ten years from now, in 2027—nowhere near the trajectory of past cycles.
Source: Bloomberg L.P.
In 2014, the Fed expected unemployment to edge down to between 5.1% and 5.5% by the end of 2016. In fact, surprisingly, it fell even lower, to 4.7%—the lowest level since November 2007 (before the global financial crisis hit the economy). Unemployment at 4.4% as of August 2017 is the lowest unemployment rate since 2001 (Figure 2) as the economy continues to average around 200,000 newly created non-farm jobs each month. And yet, there is no sign of this apparently tight labor market translating into any inflationary wage pressures, with average wage growth over the past ten years under 2.5% (Figure 3).
Sources: Thomson Reuters Datastream and US Department of Labor – Bureau of Labor Statistics.
Notes: The unemployment rate represents those without jobs who have looked for employment in the last four weeks. Data are seasonally adjusted.
Sources: Thomson Reuters Datastream and US Department of Labor – Bureau of Labor Statistics.
Notes: Average weekly wages are represented by private sector non-farm payroll earnings of production and nonsupervisory employees and are expressed in current (nominal) US dollars. Data are seasonally adjusted.
Subpar Recovery
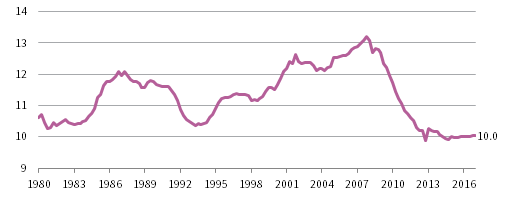
Developments since our September 2014 paper underscore how the US economy remains mired in a sluggish environment that will not tolerate the usual path of normalization of rates seen in past recoveries. The Fed also consistently overestimated the rate of recovery of the economy and so the speed at which interest rates could be brought back toward more normal long-term values. The fact is, growth has continued to underwhelm compared to past recoveries, with productivity rising slowly along with wages, and little headway has been made in reducing the debt mountain (Figure 4). Fortunately, still extraordinarily low rates and yields mean debt service costs remain at rock bottom levels (Figure 5).

FIGURE 4 US AGGREGATE DEBT AS A PERCENT OF NOMINAL GDP
Fourth Quarter 1922 – First Quarter 2017 • Percent (%)
Sources: Federal Reserve and Thomson Reuters Datastream.
Notes: Aggregate debt consists of debt securities, mortgages, bank loans, commercial paper, consumer credit, US government loans, and other loans and advances; it excludes trade debt, loans for the purpose of carrying securities, and funds raised from equity sources.

FIGURE 5 US HOUSEHOLD DEBT SERVICE PAYMENTS AS A PERCENT OF DISPOSABLE PERSONAL INCOME
First Quarter 1980 – First Quarter 2017 • Percent (%)
Source: Federal Reserve.
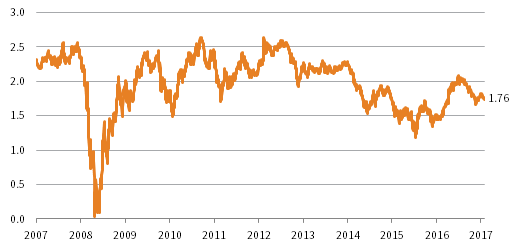
The good news remains that there is probably room to normalize rates further. The bad news is that the abnormally high debt overhang makes it difficult for rates to rise much in real terms, especially to pre-crisis levels. To bring the debt ratio down further, the economy needs to grow faster to increase the denominator.[1]Of course, another option is debt forgiveness, some of which was done following the crisis. This is not much discussed today, and is politically unlikely. However, 2% growth coupled with 1.8% expected inflation (Figure 6) is not sufficient, barring credit growth ceasing altogether, to meaningfully bring down the ratio of aggregate debt to GDP. And that is the optimistic scenario. If nominal growth over the coming decade is roughly in line with 2.2% Treasury yields and the market is right, the discounted real growth rate is about 0.4% annualized.
Source: Federal Reserve.
Note: Data are daily.
Put another way, a flattening yield curve, where long rates hold steady and short rates rise, indicates short rates cannot rise much further, unless the bond market is in for a bad surprise, since historically an inverted yield curve has been a reliable indicator of an imminent recession (remember Alan Greenspan’s “conundrum” in 2005?). Of course, as we next discuss, the character of the bond market has changed, so historical experience may not hold sway.
Demand and Supply
Another factor influencing bond yields is central banks’ quantitative easing, which has reduced the supply of bonds to the private sector, thereby putting downward pressure on yields.
While the Fed has reduced its intervention to the rolling over of maturing Treasuries and re-investing of principal payments from its holdings of Agency debt and mortgage-backed securities since the end of 2014, re-investment will slow as the Fed shrinks its balance sheet starting in October 2017. According to the Fed’s own estimates,[2]Brian Bonis, Jane Ihrig, and Min Wei, “The Effect of the Federal Reserve’s Securities Holdings on Longer-term Interest Rates,” FEDS Notes, Washington: Board of Governors of the … Continue reading the term premium effect on the ten-year Treasury yield was around –100 bps at the end of 2016. Assuming the Fed’s balance sheet reduces to around $2.3 trillion by first quarter 2023, the study estimates a reduction of this downward effect on the term premium to –24 bps. In other words, other things being equal, benchmark yields would climb gently to around 3% in five or six years’ time.
But of course, other things do not usually remain equal, and the tapering of the European Central Bank’s (ECB) bond purchases, likely to begin in 2018, should also be considered. With benchmark ten-year core Eurozone yields pinned below 1% by ECB purchases in the absence of any net issuance by the German government, the ending of this policy will have consequences, albeit uncertain in magnitude given the lack of new issuance. Nevertheless, it is probably safe to say that Treasuries yielding over 2% have looked particularly attractive compared to 0.5% yields on German bunds, and so any normalization in the latter’s yield in 2018 will also reduce this indirect source of support. That said, central bankers will remain cautious with the pace at which they remove their accommodating policies, and vigilant in case this process should impact economic growth.
Nominal or Real Growth?
Pushing growth up—without tackling some of the structural impediments—remains a challenge, as the Japanese experience has demonstrated over several decades since that country’s financial bust. With US population growth falling to its lowest rate since the 1930s and barring a step up in productive investments that create secure, well-paying jobs, large scale infrastructure projects (as in the post–World War II period), or higher productivity growth, restoring the US economy to the 3%+ trend growth it had been accustomed to before the crisis remains a challenge. Instead, structural changes in the economy over the last two decades likely mean there is no going back to business as usual for a while yet.
Another option to shrink the debt load is, of course, to boost nominal growth through inflation while continuing to cap interest rates. Objections here point to the singular failure of the Fed to hit its modest inflation target in spite of aggressive quantitative easing (of course, the Fed is not alone in this). There is also the issue of the perverse encouragement to credit-fueled spending (e.g., in the auto industry) to erase the depressive effects of the last debt bubble. By suppressing yields and keeping rates ultra-low, depression has been averted but inflation has manifested itself in asset prices priced off the risk-free rate, not wages and the real economy. This would support the view that monetary policy can only influence nominal, not real growth.
Of course, central banks do have it in their power to create conventional inflation if they so choose (and their political masters allow), simply through creating “helicopter money”—the direct injection of cash into private individuals’ bank accounts or the financing of public expenditure on infrastructure, rather than indirectly through the banking system and interest rates. But the authorities will not use this last resort unless all else fails. The current policy of quantitative easing and financial repression may be slower acting as it seeps through the system, and it probably distorts the allocation of capital in the meantime, but it could eventually succeed in boosting at least nominal GDP growth, if not real growth (US population growth is slowing, but the country does not suffer from the shrinking demographics of Japan).
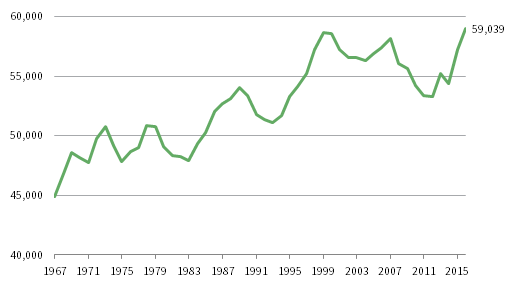
Little prevents a deliberate policy by the Fed of remaining “behind the curve,” with the benefits finally showing up in faster wage gains being passed on in higher prices. Even if average hourly wages have yet to break out on the upside, real household median incomes have recently turned up after hitting a two-decade flat patch (Figure 7). This, combined with continued employment gains, may signal that the economy is at last approaching the tipping point.
Sources: Thomson Reuters Datastream and US Census Bureau.
Note: Real median household income data are based on 2016 prices.
Where Could We Be Wrong?
While real yields should stay low in a world of high debt and low growth, this doesn’t imply anything about nominal yields. As the labor and commodity markets tighten, supported by negative real rates, could investors witness the beginnings of a mild inflationary dynamic with the authorities looking the other way? In which case, how far will this be tolerated? Inflation of 3% or 4%? Wouldn’t the bond market take fright before inflation got there, with yields spiking given the minimal protection afforded by current coupons?
These considerations give rise to an important caveat to our discussion. Unless the factors suppressing stronger growth disappear in short order, central banks’ acute awareness this time around of the fragility of the system, coupled with a fragile political environment, may finally trigger an inflationary dynamic that surprises, with more bullish implications for rates and nominal yields than we have outlined. No doubt the Fed is alert to this danger and will work to avoid it, but the question remains: How long can the Fed maintain the balance of low real yields and low inflation, especially if its chair is replaced by a more obviously political appointment? Of course, worst case, quantitative easing could be reinstated to keep nominal yields under control.
This scenario hardly seems probable today, but investors should remind themselves how frequently the improbable occurs in markets.
The Bottom Line
Betting on the continuation of a low nominal growth, low rate, and low yield environment has been the right choice for years, and it would be rash to bet against it now. While a yield spike cannot be ruled out, it is more likely that investors will witness a gentle upward sloping path for yields and rates for many years to come—even if this means a protracted work out period for the debt. A ceiling of 3.5% to 4.0% yield for the benchmark ten-year US Treasury remains the most probable conclusion, with the low end of that ceiling appearing the more likely outcome today. What that means for real yields is another matter.
Stephen Saint-Leger, Managing Director
Brandon Smith, Senior Investment Associate
Footnotes


