India today offers a plethora of investment opportunities to benefit from the country’s vibrant and dynamic economy. However, for investors to be successful, today’s widespread optimism must not translate into overpaying for assets. India’s strong economic growth and developing consumer base are very appealing, but not all Indian investments will generate cash flows mirroring this growth, valuations remain at a hefty premium compared to other emerging markets, and ongoing currency devaluation will continue to aggressively crop the headline returns that global investors generate from their Indian assets. Finally, whether demonetization will prove beneficial over the long run remains to be seen; for now, it is certainly creating challenges for Indian citizens and companies.
In the minds of many investors, India represents perhaps the quintessential emerging market, pairing strong growth potential with elevated risks. Among emerging markets, India has long been seen as a growth play, with valuations that tend to be a bit higher than the overall MSCI Emerging Markets Index, structurally higher return on equity (ROE) than emerging markets overall, and pronounced tilts toward consumer rather than commodity sectors. India was a “BRIC” constituent, then a member of the “Fragile Five,” and then a “bright spot” for reform with the 2014 election of the Bharatiya Janata Party (BJP) led by now Prime Minister Narendra Modi and his ambitious reform agenda. Yet, as the initial optimism has faded, Modi has confounded onlookers again by forcing through a shock “demonetization program,” highlighting his continued appetite for big reforms regardless of their short-term costs. In this research note, we review the Indian growth story, including near- and long-term challenges, and we evaluate the outlook for key assets.
Growth Prospects Are Appealing …
Investors taking the long view see India as offering a respite from the demographic woes besetting Japan and Europe (and even some EM countries).[1]China’s working-age population is already shrinking, and the pace of decline will accelerate: between now and 2050, that demographic will shrink by about 212 million people, a decline roughly to … Continue reading Some welcome India’s relative lack of dependence on Chinese growth. And they are enthused by the tremendous potential for Indian consumer spending as the country’s levels of poverty abate over time.
For more on this, please see Aaron Costello, “India: Can the Bull Market Continue?” Cambridge Associates Research Brief, April 16, 2015.
The Indian economy grew an estimated 6.7% in fiscal 2017 (which ends in March), higher than most other emerging markets.[2]India watchers will note that in 2015, the Modi government changed the methodology for assessing GDP, boosting growth compared to prior metrics. While some economists believe that the revised … Continue reading Looking ahead for the next five years, Oxford Economics pencils annual growth of 6.8% for India, compared to 5.8% for China, and less than 2.7% for the world as a whole.
Inflation, while much higher than most developed markets, has recently fallen below typical Indian levels. Consumer prices rose 3.4% in 2016, after averaging 6.8% over the past five years. A favorable monsoon season boosted crop yields and kept food prices relatively stable (food is a large component of India’s CPI basket). The fall in inflation has allowed the Reserve Bank of India to cut policy rates by 150 basis points over the past two years, to 6.25%. The bank held rates steady in February, providing scope for further cuts should inflation remain muted. Thus, the macroeconomic stoplights are mostly green today—economic growth remains strong, inflation rates are reasonably low, and monetary policy is supportive (Figure 1).

Figure 1. GDP, Inflation, and Monetary Policy of Top Ten EM Countries by Market Cap
As of December 31, 2016
Sources: Banco Central do Brasil, Banco de Mexico, Bank Indonesia, Bank of Korea, Central Bank of Malaysia, Central Bank of the Republic of China, Central Bank of the Russian Federation, Directorate-General of Budget, Accounting and Statistics, Executive Yuan, R.O.C (Taiwan), IBGE – Brazil, INEGI – Mexico, Malaysia Department of Statistics, MOSPI – India, MSCI Inc., National Bureau of Statistics of China, Oxford Economics, People’s Bank of China, Reserve Bank of India, Russia Federal State Statistics Service, South African Reserve Bank, Statistics Indonesia, Statistics Korea, Statistics South Africa, and Thomson Reuters Datastream. MSCI data provided “as is” without any express or implied warranties.
Note: GDP data for Brazil, China, India, Mexico, Russia, and South Africa are estimates.
Some experts believe India has the potential to grow even more strongly in the decades to come, given its appealing age distribution and potential for structural improvements. India’s working-age demographic is forecast to continue growing steadily in the coming decade (including 14% growth over the ten years ended 2025), while China’s working-age population is starting to shrink. The dependency ratio for India will get better over the coming decades, while most other countries’ ratios will get measurably worse. Working-age Chinese, which today are about 73% of the population, will only be about 62% by 2040 as the retiree-age population balloons (Figure 2). As India continues to urbanize, its per capita GDP should continue to expand, following the path of other countries before it—South Korea, for example (Figure 3).

Figure 2. Demographic Projections: India vs China
Sources: Oxford Economics and Thomson Reuters Datastream.
Note: Working-age population is number of people who are either employed or looking for work.

Figure 3. Urban Population Growth and Per Capita GDP
1960–2015
Sources: Thomson Reuters Datastream and World Bank.
Note: GDP per capita is in constant 2010 US dollar terms.
… But an Upshift Would Require Higher Productivity
India currently has low productivity, and for the country to reach its full potential, it needs to make substantial progress in improving and expanding its infrastructure; reducing corruption, bureaucracy, and the informal economy; educating its entire population; and bringing women into the workforce.
India’s infrastructure is poor today, and current infrastructure deficits are likely to get substantially worse as the urban population continues to grow. As of 2007, the country’s water utilities supplied about 27 billion liters less than the nation requires, and McKinsey estimates that the deficit will more than triple to 94 billion liters by 2030. Similarly, the rail mass transit infrastructure had a deficit of 2,000 kilometers of lines in 2007, estimated to triple to 6,400 kms by 2030.[3]We are not aware of updated figures from McKinsey; however, we do not believe that the future deficits they predict have been somehow alleviated in recent years. Mumbai’s famous lunchbox delivery network is remarkably clever,[4]Please see Stefan Thomke, “Mumbai’s Models of Service Excellence,” Harvard Business Review, November 2012 or Indian film “The Lunchbox,” directed by Ritesh Batra (Sony Pictures Classics, … Continue reading but efficiently moving India’s ever-growing urban workforce in the decades to come will require a huge investment in rail infrastructure.
Corruption and bureaucracy are substantial frictions in India. The World Bank’s “Ease of Doing Business” survey ranks India an abysmal 130th out of 190 countries. And perhaps in part because of these issues, the vast majority of Indian workers are employed off the books (informal employment is above 80%). This weakens the tax base and the power of the government to regulate employment conditions. Some observers believe that the introduction of a goods-and-services tax (GST) (the structure is similar to a value-added tax or VAT) will help. A GST is scheduled to be adopted this year, and while it will mainly benefit large, on-the-books firms at the onset (by allowing them to sell goods and services across Indian state lines without paying intra-state tariffs), its enforcement mechanisms may cause those large firms to require their suppliers to begin operating in the formal economy for the first time. Successful implementation of Modi’s aggressive reform agenda will require continued political support, of course. Modi’s BJP won a landslide victory in India’s massive Uttar Pradesh state in March, radically bolstering Modi’s chances of holding on to the prime minister seat in 2019. The win also boosted Indian markets including the rupee.
Another structural issue is the lack of credit available to firms, a problem that stems in part from the glut of non-performing loans (NPLs) at state banks and the underdeveloped corporate bond market.
NPLs at the country’s state-affiliated banks sum to an estimated $191 billion, 17% of existing loans and 8% of GDP. The loans are concentrated to about 50 borrowers (primarily infrastructure and electrical power–related issuers), but this doesn’t mean the problem is easily solved. Solutions are likely to be politically charged, India doesn’t yet have a functioning bankruptcy system, and asset haircuts by banks tend to attract scrutiny by anti-corruption agencies. In the meantime, lending capacity at these state banks is constrained by their exposure to the glut of NPLs. Some of the loans may be sold to private market participants looking for opportunities in distressed assets, and “bad banks” may be set up to absorb the assets. In January 2017, the newly confirmed deputy governor of the Reserve Bank of India floated a plan under which private investors and turnaround specialists would produce competing resolution proposals for assets, then credit ratings agencies would vet them, and banks would be forced to accept one of the plans or face a steep (perhaps approaching 100%) haircut on the assets. If the banks are forced to properly mark and dispose of non-performing assets, they will then have available lending capacity. Banks provide 80% of India’s financing, so this is key to supporting economic growth.
Another obstruction to corporate borrowers is the anemic corporate bond market. Two important constraints in the market are mentioned above: the lack of an effective bankruptcy protocol, and a high percentage of infrastructure borrowers that struggle to pay back debts. Indian’s corporate bond market sums to just 14% of GDP, below the levels for Brazil, China, South Africa, and Thailand, and well below half Malaysia’s level. Restrictions on foreign bond ownership are one constraint, and the government is relaxing some of those provisions. Another key constraint is the country’s still-volatile currency. Even at relatively high interest rates, rupee bonds may be limited to investors in developed markets, if they expect the currency to move against them at a 5% annual rate. And USD-based bonds are not a panacea, given that the issuers’ outstanding liability will fluctuate substantially in rupee terms (most likely growing over time).
If India can unclog the bankruptcy and NPL backlog and build a more robust corporate bond market, it will have an easier time making necessary infrastructure investments and fostering the growth of businesses that participate in the formal economy and pay taxes.
While India has a large population of highly educated, multilingual workers, hundreds of millions of rural Indians have little formal education. Of the Indian population age 15 and older, the average education level was just three years of schooling in 1985; by 2010 that had doubled to six years, which is great progress, but it compares to nine in Mexico. Girls are more likely than boys to leave school early, leading to a literacy rate of 63% for females versus 81% for males.[5]Education levels will continue to improve for both boys and girls, with 97% of boys and 98% of girls that are of primary-school age enrolled in school. The labor force in India remains male-dominated, with only 29% of working-age women in the labor force, compared to 32% in Turkey, nearly 50% in both Malaysia and Mexico (all three are somewhat conservative countries), and compared to 70% in China.
India’s per-capita GDP has grown at about a 7% annual rate over the past decade, well above the median for other emerging markets, albeit from a somewhat lower base than other emerging markets. For India to catch up with the rest of the emerging world, it must continue to boost productivity, which will require reforms, as well as investment in both human and physical capital.
Demonetization Casts a Pall on Growth in the Short Run …
While India’s long-term growth trajectory remains quite strong, growth over the next few quarters could see a slowdown, as the impact of demonetization flows through both the illicit economy and the official one. Growth for the quarter ended in December was recently announced by the government, and surprised to the upside with a still robust 7% growth pace. However, several investors noted that the GDP growth figures are calculated via the formal economy, where the severe cash shortage was undoubtedly much less impactful. As noted, the informal economy encompasses about half of India’s economic activity and 80% of employment, and about four out of every five transactions are in cash.[6]Please see Udith Sikand, “An Indian Payoff,” Gavekal Research, December 8, 2016.
A Brief Primer on Demonetization in India
For those not familiar with India’s demonetization efforts, a brief summary: In a surprise announcement on November 8, 2016, Prime Minister Modi announced that 500 rupee and 1,000 rupee notes would be phased out to clamp down on “black money” (the untaxed, informal economy, and proceeds of illegal activity including corruption). The two denominations together accounted for 86% of the cash in circulation. The phase-in of demonetization was chaotic, with policy tweaks coming almost daily and long queues at banks and ATMs. The vast majority of the notes, which the government had predicted would be stranded by holders who feared auditing, were in fact deposited before the December deadline (sometimes through dubious methods including laundering by charities, or by having household workers deposit small amounts belonging to their employers in the workers’ jan dhan, savings accounts). Critics claim that Modi’s motivation for employing demonetization was to disadvantage India’s opposition Congress party in the run up to important parliamentary elections in the Indian state of Uttar Pradesh (cash is used by political parties to stage events and pay for other campaign expenses, and is reportedly also handed out liberally to potential voters).
Over time, demonetization should force some activities into the taxed, formal economy, which will boost the tax base and may increase worker protections, but in the near term, the severe cash shortage has caused some economic activity to slow dramatically. Approximately one-third of purchases of two-wheelers (scooters and motorcycles) are in cash, for example, and in December two-wheeler sales plummeted 22% versus the prior year. Real estate, which had been used as a store of illicit wealth via cash transactions, appears to also be taking a hit. Dodgy cash purchases were likely eschewed in December, but legitimate transactions are impacted as well, because some buyers will wait to see if property prices fall as a result of demonetization.
The consensus seems to be that the economic impact of demonetization will be transitory and modest, totaling probably less than one percentage point of GDP over a few quarters. But some investors paint a more bearish picture, postulating that cash constrained farmers likely planted fewer hectares than normal for the winter crop. A smaller harvest could cause shortages of certain crops, boosting inflation and forcing the Reserve Bank of India to tighten policy rates, further crimping economic activity. This scenario is not disastrous, but is likely more negative than what markets are currently pricing in.
… But India Is Still Not a Value Play
While share prices dipped into the end of 2016 as markets digested the demonetization announcement and the potential impact of the new US president, Indian valuations remain robust. India has long been viewed as a growth market, rather than a cyclical value play. This is reflected in its mix of listed firms, in their profitability, and in the prices that investors pay to own them.
The sector mix for the MSCI India Index is parallel to the broader MSCI Emerging Markets Index in some ways, but the Indian market has much higher allocations to consumer sectors (and is correspondingly underweight information technology shares).[7]Further, India’s IT sector differs from the rest of the emerging world’s, with a focus on technology services rather than hardware (Korea and Taiwan) or Internet (China). This is appealing to EM investors that sometimes are disappointed by the small index weights to firms directly tied to growth in the consumer economy within emerging markets (often part of the thesis for global investors allocating to emerging markets). Health care is another overweight sector, populated in part by makers of generic pharmaceuticals (Figure 4).

Figure 4. Equity Sector Breakdown: India vs Emerging Markets
As of February 28, 2017 • Percent (%)
Sources: MSCI Inc. and FactSet Research Systems. MSCI data provided “as is” without any express or implied warranties.
Notes: Percentages may not total due to rounding. MSCI Investable Market Indexes (IMI) capture large-, mid-, and small-capitalization companies, representing approximately 99% of the free float–adjusted market capitalization in each country or region.
India’s listed firms tend to be more solidly profitable than those in other emerging markets. ROE is somewhat cyclical like other markets, of course, but over the last few decades it has consistently been several percentage points (ppts) higher than the broad emerging markets index (Figure 5).
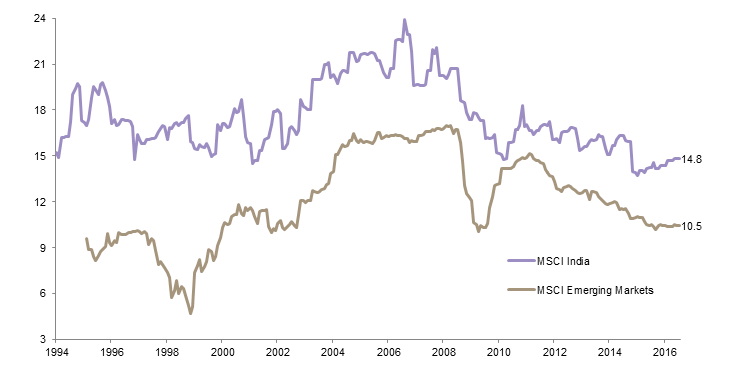
Figure 5. Return on Equity: India vs Emerging Markets
August 31, 1994 – February 28, 2017 • Percent (%)
Sources: MSCI Inc. and Thomson Reuters Datastream. MSCI data provided “as is” without any express or implied warranties.
Notes: Data are monthly. MSCI Emerging Markets return on equity data begin on September 30, 1995.
Interestingly, while investors seem to expect higher growth from India, and while economic growth has far surpassed other markets, earnings growth has failed to keep up. Since 1995, Indian real GDP has grown by 6.6% annualized, 1.5 ppts higher than emerging markets broadly, while earnings have grown at about one-third that clip, lower than broad emerging markets. One key reason for this is dilution; the number of companies listed on Indian exchanges has grown at a 2% annual rate since 2007. The disparity between robust economic growth and anemic earnings growth has been even more apparent during the past ten years (Figure 6).

Figure 6. Cumulative Wealth of Real EPS: India vs Emerging Markets
September 30, 1995 – February 28, 2017 • Rebased to 100 on September 30, 1995
Sources: MSCI Inc., Oxford Economics, and Thomson Reuters Datastream. MSCI data provided “as is” without any express or implied warranties.
Notes: Full period real EPS data are calculated from September 30, 1995. Full period real GDP data are calculated from 1995. Cumulative wealth data are based on month-over-month percent change in real EPS. India real GDP data are quarterly and are through fourth quarter 2016. EM real GDP data are based on aggregate annual non-OECD GDP as of year-end 2016. Inflation data are as of January 31, 2017. The MSCI India Index was reconstituted in June 2015, where real EPS fell 18% year-over-year. Adjusting for reconstitution, real EPS fell 15%, with most of the decline during the period stemming from large losses at three firms.
The upshot of this is that India is seen as a growth market, and in fact the economy’s growth is impressive, but earnings have not fully lived up to the growth-market promise. Investors should be cautious about paying growth-like valuation multiples if the flow through to earnings is not, in fact, all that “growthy.”
At the end of February 2017, the Indian market traded at an ROE-adjusted price-earnings (P/E) multiple of 18.7, and a cyclically adjusted (Shiller) P/E ratio of 21.3 (both are slightly above their historical median). Relative to the MSCI Emerging Markets Index, the Indian market is trading richer than normal, with a current premium of 40% versus a median historical premium of 19% (Figure 7).

Figure 7. India ROE-Adjusted and Cyclically Adjusted P/E Ratios
August 31, 1994 – February 28, 2017
Sources: Global Financial Data, Inc., MSCI Inc., and Thomson Reuters Datastream. MSCI data provided “as is” without any express or implied warranties.
Notes: India relative ROE-adjusted P/E ratios are relative to the MSCI Emerging Markets Index and are calculated as percentage difference above or below EM ROE-adjusted P/E. The CAPE ratio, as provided by Global Financial Data, Inc., is a ten-year cyclically adjusted moving average of the P/E ratio for India. Where net earnings for the country were negative, a P/E ratio of 100 has been used. Ten-year CAPE data begin December 31, 1997.
Sector valuations within India are dispersed. The health care and information technology sectors that have long been market stalwarts are cheap relative to their (relatively lofty) historical valuations (Figure 8), while consumer staples, industrials, and materials are all well above their historical levels. Lofty valuations might still make sense if earnings growth is poised to accelerate—and it may be as ROE appears to be cyclically depressed—but many investors believe that for India’s most famous market sectors, the best days may be behind them. IT services firms engineered strong growth and profitability by pioneering off-shoring and making it mainstream, but the low hanging fruit of off-shoring may have already been picked, and competition is picking up from other countries.[8]Please see Rajiv Jain, “India In Focus: Do Fundamentals Trump Valuations,” Let’s Talk Stocks, GQG Partners, (December 2016): 1–6.. Similarly, the Indian generic pharmaceutical industry has been so successful that it now manufactures 19% of generic drugs prescribed in the United States, but the coming “patent cliff” is shrinking, and pricing pressure is limiting profitability.

Figure 8. Valuation of Indian Equity Market Sectors Compared to History
As of February 28, 2017 • Percent Deviation of Sector’s ROE-Adjusted P/E Ratio from Historical Median (%)
Sources: MSCI Inc. and Thomson Reuters Datastream. MSCI data provided “as is” without any express or implied warranties.
Notes: Bubble sizes represent market value of sector in millions of US dollars. Sector valuation data begin January 31, 1997, and MSCI India Index data begin August 31, 1994. Median calculated based on entire available index history. There are currently no constituents eligible for the real estate sector. Telecommunication services and utilities sectors are excluded from chart as they together compose 4.9% of the index. Telecommunication services current ROE-adjusted P/E ratio of 18.8 is 23.9% above its median of 15.2. Utilities current ROE-adjusted P/E ratio of 12.5 is 4.6% above its median of 11.9.
Aside from Venture, Indian Private Equity Has Not Delivered
While public markets in India are robust and diverse, some investors are interested in private investments as well. Our data indicate that while venture capital in India has been successful, historically the same cannot be said for private equity.
Private equity funds collectively returned 4%, 5%, and 7% over the past five, ten, and 15 years, respectively: roughly the returns offered by public markets (Figure 9).[9]The public market returns shown use the modified public market equivalent (mPME) methodology to assess the returns of the MSCI India Index over the period when private market investors would have … Continue reading Private equity in India, like the public equity markets, has a growth-tilted flavor. Leveraged buyouts (LBOs) have accounted for just 16% of all private capital fund investments from 1992 to the present by value,[10]Buyouts account for 3% of investments when counted by number of deals. while more than half of investments have been expansion stage. Interestingly, buyouts played an outsized role in 2016, accounting for 26% of the market as growth stage and PIPEs (private investments in public equity) collectively fell from 76% of private market investments in 2015 to 62% in 2016. Unlike LBO investors, growth equity investors typically have little operational control over their portfolio companies, and they use little or no debt. Growth equity investors are along for the ride, leaving little room for disruptive changes to bring about breakout returns from their portfolio companies. Further, these funds raised an abundance of capital in the middle of the last decade, limiting returns by increasing both valuations and competition for deal flow.
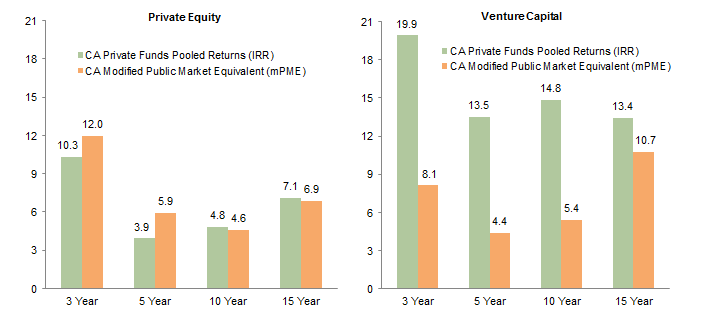
Figure 9. Returns for Indian Private and Public Equity Markets
As of September 30, 2016 • Return (%)
Sources: Cambridge Associates LLC, MSCI Inc., and Thomson Reuters Datastream. MSCI data provided “as is” without any express or implied warranties.
Notes: Private funds pooled returns are net to Limited Partners. Public market equivalent calculated using Cambridge Associates methodology based on the MSCI India Index returns gross of dividend withholding taxes. The CA Modified Public Market Equivalent replicates private investment performance under public market conditions. The public index’s shares are purchased and sold according to the private fund cash flow schedule, with distributions calculated in the same proportion as the private fund, and mPME net asset value is a function of mPME cash flows and public index returns.
Return dispersion, like other private markets, is high, and top-quartile funds did considerably better. Investors who are not confident in their ability to identify and access managers that will outperform may find growth equity less appealing than public markets, particularly given the liquidity trade-off.
Venture capital appears to be a more fertile sector within India. While the number of managers is relatively small, a handful of skilled institutional firms do have good deal flow. Returns for this limited set of managers have been appealing relative to public markets, and broadly within long-term expectations for private investments, in the low- to mid-teens over five-, ten-, and 15-year periods.
Currency Is a Persistent Drag Behind the Returns Sled
Regardless of what Indian asset foreign investors own,[11]We have not discussed rupee-denominated Indian government bonds in this note, given that historically non-Indian investors have not been able to purchase such bonds. The bond market is beginning to … Continue reading they need to be clear that their returns, once translated into their home currency, will likely be somewhat diminished. India tends to have structurally higher inflation than the US dollar, pound sterling, euro, etc., and thus the rupee tends to depreciate over time (Figure 10). In fact, it has depreciated in 85% of rolling five-year periods dating back to 1978, and in half of these periods, the rupee has lost more than a quarter of its value. Today, the rupee appears to be moderately overvalued on a real effective exchange rate (REER) basis. Investors may wish to consider hedging their rupee exposure, but because Indian cash interest rates are higher than those in developed markets, hedging is not cheap, and hedging may not be feasible for private equity investments given the uncertainty of cash flows.

Figure 10. Rolling Five-Year Currency Performance and Inflation Differential
January 31, 1970 – February 28, 2017 • Percent (%)
Sources: Labour Bureau – India, Ministry of Statistics and Programme Implementation – India, Thomson Reuters Datastream, and US Department of Labor – Bureau of Labor Statistics.
Notes: India CPI data till December 31, 2010, are based on the industrial worker price index and are based on the rural and urban general CPI thereafter. Inflation differential calculated as US CPI minus India CPI. CPI data are as of January 31, 2017.
Conclusion
India is a vibrant and growing market, with the negative impact of demonetization probably transitory and moderate. The country’s appealing demographics may boost growth if young people find economic opportunity, but to reach India’s full potential, per-capita growth needs to improve as well. This will require infrastructure improvements, greater gender equality, and further investment in education. These investments, in turn, would be easier to accomplish if the country can unclog its lending pipeline by resolving its NPLs and getting bankruptcy procedures on track. An NPL resolution protocol could create opportunities for risk-tolerant private investors, provided they are confident that process, and not politics or corruption, will guide outcomes.
Investors interested in the Indian market should remember that GDP growth does not equal earnings growth, and they should not get carried away by buying stocks at lofty multiples that may not be justified if earnings growth remains sluggish. They should also bear in mind that if the past is prologue, future currency depreciation could tamp down returns from all Indian investments.
While the country’s aggressive reforms, continuing development, and greater formalization of the economy won’t necessarily translate into EM-topping returns for the overall Indian market, patient and well-positioned investors may find rewarding growth opportunities.
Sean McLaughlin, Managing Director
Stuart Brown, Investment Associate
Steven Pytlar, Associate Investment Director
Han Xu, Investment Associate
Footnotes