Long/short equity funds rebounded in third quarter, thanks in part to strong equity markets, but also to equity correlations that rose only slightly from their June lows. The latter suggests that perhaps the stock-picking environment has improved for long/short equity strategies. The HFRI Equity Hedge (Total) Index returned a preliminary 4.6% for the quarter, besting the S&P 500 Index’s 3.9% return and in line with the MSCI World Index’s 4.9% return. Long/short funds benefited from long positions in the technology sector, which returned 12.9% for the quarter (based on S&P 500 sector returns), as well as shorts in telecommunications, utilities, and consumer staples, which returned -5.6%, -5.9%, and -2.6%, respectively. In recent quarters, managers had lamented that yielding equities in the telecommunications and consumer staples sectors were trading at extremely rich valuations based solely on investors’ quest for yield, not on company fundamentals. This pressure appeared to ease in third quarter, enabling long/short managers to generate alpha on both sides of their portfolios.
Turning to macro/uncorrelated hedge fund strategies, trends in third quarter led to some isolated dramatic returns, particularly for the broadly defined “systematic global macro” complex. Sentiment reversed in the quarter as rates inched slightly higher and as markets anticipated that some central banks may move to raise rates, particularly the US Federal Reserve in December. The biggest rise in rates was in the front of the US yield curve, with two-year yields up 19 basis points (bps) over the course of the quarter, causing the Treasury yield curve to flatten. Equity volatility picked up slightly in September after a positively moribund July and August. Other markets experienced marked volatility in the quarter, most notably the FX markets, where the UK pound continues to plumb fresh lows as the country determines the path to “Brexit,” as well as commodities, which saw both gold and oil round trip to end September at virtually the same levels where they started the quarter.
In this quarter’s edition, we explore the subject of hedge fund crowding. This topic has generated many headlines, though perhaps not quite as many as other pressures on the industry. Hedge fund fees remain at the forefront of investors’ minds, and managers appear to be taking note and responding to these concerns. While every situation is unique, managers and LPs have an opportunity to approach fee negotiations as partners, devising structures that balance the economic needs of each.
Hedge Fund Crowding: Risk or Opportunity?
Much has been written in the press about position crowding among hedge funds and its effects on performance, particularly in periods of market stress and heightened volatility. During sell-offs such as those in first quarter 2016, crowded positions exhibit higher beta to the downside than non-crowded positions. This may owe to multiple hedge funds reducing risk or exposures at the same time, putting downward pressure on share prices. Market volatility can be exacerbated by trading platforms with strict risk limits reducing leverage or individual funds facing redemption pressures.
While it is easy to focus on the negative effects of hedge fund crowding, particularly over shorter periods, evidence suggests that crowded long positions tend to outperform the broader equity markets over the long term, whereas crowded shorts—or companies with high short interest—tend to underperform these indexes. According to Goldman Sachs, from 2001 through second quarter 2016, the quarterly returns of crowded trades (proxied by the Goldman Sachs VIP Index) outperformed the S&P 500 Index by an average of 51 bps. In third quarter 2016, the VIP Index surpassed the S&P 500 by more than 600 bps and outperformed a basket of widely held short positions, defined by the Goldman Sachs HF VISP Index, by nearly 1,000 bps.
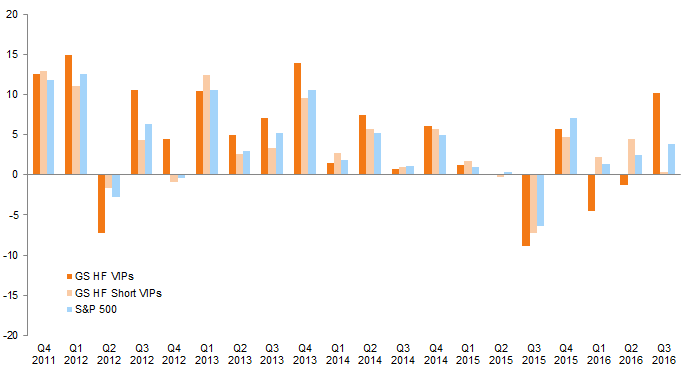
Performance of Goldman Sachs’ Hedge Fund VIP Indexes vs S&P 500 for the Past Five Years
Fourth Quarter 2011 – Third Quarter 2016 • Percent (%)
Sources: Bloomberg L.P., Goldman, Sachs & Co., Standard & Poor’s, and Thomson Reuters Datastream.
Note: Goldman’s VIP indexes represent the performance of the 50 stocks that appear most frequently in the holdings of hedge fund managers with 10–200 holdings.
Many fund managers began proactively avoiding crowded positions after the first quarter, perhaps leaving a dearth of buyers to offset outright sales, and creating price dislocations. Noting the difficulty of predicting which positions will become crowded, one practitioner explained that his team has embraced the opportunity posed by these dislocations, rather than running from it. According to another practitioner, the shift to less crowding in second quarter presented attractive opportunities to those who took a longer view and a fresh look at formerly crowded positions.
Managers may not avoid a stock simply because another hedge fund owns it, but many grow skeptical if the corresponding investment case becomes too widely known. A practitioner remarked that his team does not ignore high-quality businesses simply because they are crowded; in fact, he argued, all high-quality businesses eventually end up crowded, and for good reasons. These companies may still represent advantageous opportunities for managers that take a three- to five-year view—but only if that view is accompanied by long-term capital from like-minded investors willing to absorb short-term volatility in search of greater long-term gain.