After tumbling 34% peak-to-trough from mid-February to late March amid the worsening economic and human toll from the COVID-19 pandemic, global equities recouped the bulk of those losses in second quarter as policymakers’ swift and massive response gave investors hope that a worst-case global depression scenario would be successfully averted. Credit markets also rallied sharply, with spreads over sovereigns narrowing as investors reacted to major central banks announcing unprecedented quantitative easing programs, including the US Federal Reserve purchasing corporate bonds for the first time.
For the quarter, the MSCI All Country World Index gained 19.2% in USD terms, its best quarterly return since first quarter 2009, while US equities continued to outperform, with the S&P 500 Index returning 20.5%. By comparison, Europe’s STOXX 600 Index, Japan’s TOPIX Index, and the MSCI Emerging Markets Index returned 16.2%, 11.2%, and 18.1% in USD, respectively. Among S&P 500 sectors, consumer discretionary (32.9%) and information technology (30.5%) maintained their strong leadership, with both ending June well into positive territory year-to-date. Meanwhile, the energy sector (30.5%) bounced back from a steep first quarter loss but remains mired in a deep bear market.
Among hedge fund strategies, equity long/short led the way in second quarter with the HFR Equity Hedge (Total) Index surging 13.3%, trimming its 2020 decline to -3.2% year-to-date. Event-driven strategies also clawed back part of their first quarter losses: the HFR Event-Driven (Total) Index gained 9.7% in second quarter (-6.7% YTD), with the HFR Event Driven: Distressed/Restructuring Index adding 7.2% (-5.3% YTD) and the HFR Event Driven: Credit Arbitrage Index rebounding 9.5% (-8.4% YTD). By comparison, the HFR Macro (Total) Index experienced a more modest 0.8% gain in second quarter, bringing its year-to-date return to -0.9%, with the HFR Macro: Discretionary Thematic Index performing particularly well, returning 5.8% in second quarter to finish June up 3.4% year-to-date.
Growth stocks (28.0%) led the market rebound, while value stocks lagged (14.6%) as investors crowded into secular growth stories within internet services and infrastructure, e-commerce, payments, and semiconductor equipment, catapulting several to new heights on the belief that the pandemic may accelerate several important technological trends. As a result, within equity long/short, growth-oriented managers with directional net long exposure to these sub-industries posted impressive second quarter results, pushing many into positive territory year-to-date. Most value-oriented long/short managers also generated gains but struggled to keep pace with their growth counterparts, with many value strategies still down on the year through June.
While equity markets appear to have priced in a V-shaped economic rebound, the International Monetary Fund expects a more gradual recovery after further downgrading its global growth forecast for 2020 to -4.9% in June. Despite the sharp rally in risk assets and hedge fund returns in second quarter, many managers remain cautious, citing evidence that some securities’ rich valuations have decoupled from problematic underlying fundamentals. In addition, with the prospect of a more uneven recovery, highly leveraged companies already facing liquidity challenges pre-pandemic may find restructuring unavoidable. In this quarter’s update, we discuss prospects for a coming wave of defaults and bankruptcies and the strains that could put on the courts, as well as the potential opportunity set for credit-focused hedge fund managers.
Credit-Focused Hedge Funds: Preparing to Play the
Pandemic-Driven Distressed Debt Cycle
Since the COVID-19 pandemic emerged in first quarter, causing financial markets to fluctuate and economic activity to slump, investors have pondered how this credit cycle will play out. Credit-oriented hedge funds focused on the high-yield bond and leveraged loan spaces were generally hurt by the first quarter downdraft in leveraged finance markets, with spreads in corporate bonds and loans topping out at levels not seen since the global financial crisis (GFC). While funds’ short books mostly generated profits, they were typically not sized at levels sufficient to offset losses from their long credit exposure.
Yet, since late first quarter, credit markets have staged something of a turnaround as policymakers took decisive action to support markets, applying the lessons learned during the GFC. While most of these efforts were aimed at supporting investment-grade assets, some measures also boosted speculative-grade issues, either directly or tangentially. Year-to-date, the action in credit spreads resembles the Greek alphabet’s capital lambda or an upside down “V” (Figure 1). Second quarter performance reflected this spread tightening—high-yield bonds and leveraged loans were each up more than 9%, the best quarterly returns for both asset classes since second quarter 2009. Yet, those strong gains followed losses of 13% for both in first quarter, the worst period since fourth quarter 2008.
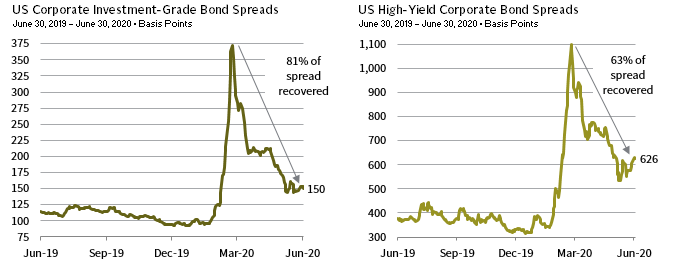
FIGURE 1 CREDIT SPREADS ACTION
Sources: Bloomberg Index Services Limited and Thomson Reuters Datastream.
Notes: Asset classes represented by Bloomberg Barclays US Corporate Bond Index and Bloomberg Barclays US Corporate High Yield Index. Data are daily index-level option-adjusted spreads. Spread recovered are based on spreads at US equity market peak date (February 19, 2020) and peak spreads reached in late March.
Simply looking at second quarter credit market performance, an investor might conclude that the worst of the COVID-19 crisis has passed. Recent new issue market activity seems to support such a view—investment-grade new issuance was above average in second quarter, and high-yield issuance in June set a single-month record. Yet, second quarter’s strong returns and vastly improved market liquidity mask deeper issues within credit, with the second quarter rebound unlikely to mean bouts of elevated volatility are behind us. Instead, the recent rally should be viewed as just one step in a likely protracted process during which the pandemic’s myriad impacts work their way through the global economy and financial markets.
Several experienced managers with whom we regularly speak have recently laid out frameworks to help understand how credit opportunities might develop over the coming months and years. These frameworks were informed by the GFC experience and therefore similarly view the COVID-19 pandemic through the prism of an economic crisis. Importantly, however, managers are amending their crisis investing playbooks in recognition that this recession and credit cycle are being driven by a global pandemic unlike anything experienced in modern capital markets history. Indeed, credit analysts have never had to model a downside scenario in which entire parts of the economy temporarily shut down and certain individual issuers go through a multi-month period generating essentially ZERO revenues.
How this crisis unfolds will largely depend on public health officials’ capacity to slow the virus’s transmission and policymakers’ ability to help businesses and individuals weather the economic slump until scientists and drug companies can develop and widely distribute an effective treatment or vaccine. We can therefore look at the potential evolution of credit opportunities stemming from the COVID-19 crisis in terms of three stages or phases: first, a period of dislocation, followed by an interlude bringing better clarity, then concluding with a developing distress cycle and its ultimate resolution.
The dislocation stage is marked by a sudden jump in economic uncertainty. In this stage, investors unload risk assets to preserve liquidity or, in some cases, to meet margin calls or redemption requests. Forced sellers often must liquidate those assets that can still attract bids, rather than what they would prefer to sell. As liquidity evaporates, perversely, the highest-quality assets are the first to go on sale, with steep discounts on what are normally stable, highly rated corporate debt securities.
The opportunity to purchase deeply discounted investment-grade bonds appeals to several types of investors. Traditional long-only investors focused on investment-grade or higher-quality leveraged credits will, of course, attempt to deploy capital in such situations. Credit-oriented hedge funds also naturally gravitate toward such opportunities. Indeed, private credit funds that possess the flexibility to do so have opportunistically purchased deeply discounted, liquid debt of high-quality companies that would typically not make it onto these funds’ radars. With the current crisis, the window of opportunity for such investments was originally expected to last perhaps several months. Yet, central bank bond–buying programs—for example, the Fed’s Secondary Market Corporate Credit Facility—may have greatly truncated this opportunity (Figure 2). This first dislocation stage already appears to be coming to an end, if it has not already passed.

FIGURE 2 FED HOLDINGS FROM SECONDARY MARKET CORPORATE CREDIT FACILITIES BOND PURCHASES
As of June 28, 2020 • USD (Billions)
Source: Federal Reserve.
Notes: Market value of ETF purchase transactions, which is the recorded value of all ETF transactions that have reached their contractual settlement date as of May 19, 2020, and June 16, 2020. Bond purchase amount includes accrued interest.
The second stage brings a period of greater clarity and markets functioning in a more normal fashion. For many businesses and types of investments, the range of potential outcomes is quite wide in the first stage. In stage two, some of the uncertainty begins to lift as the magnitude of the economic fallout becomes more quantifiable and the fundamental impact on various assets and business models begins to materialize. There tends to be a quality bifurcation—some companies will be clear winners in the post-COVID landscape, while others will suffer disproportionately. It should become evident that not all companies will be eligible for government assistance programs, and this will produce a need for rescue financings, which certain investors including hedge funds may be able to arrange or at least help fund. As some businesses feel the strain of having revenues disappear entirely (or at least fall and remain below a level at which they can properly service debt) for a period, ratings agencies will begin downgrading credits. Downgrades will create further forced selling: for example, collateralized loan obligation (CLO) vehicles that are already bumping up against lower-credit quality bucket thresholds will need to offload certain investments. Opportunistic hedge funds with capital to deploy could pick up some of the underlying loans from these CLOs at attractive prices.
The third stage is likely the longest and involves a wave of corporate defaults and debt restructurings. Credit hedge funds with a focus on corporate bankruptcies will likely find a wide opportunity set. Despite markets’ current complacency, much of the damage to companies is baked in, so to speak, as they exhaust various available life lines: drawing down lines of credit, laying off staff, shifting operations, or reorienting the business itself. It may be instructive to look to default forecasts to consider the magnitude of the expected opportunity set. Moody’s, the credit ratings agency, recently forecast a 12.2% base case default rate for US speculative-grade credit at year-end. Its optimistic forecast was 6.8%, effectively where actual bond and loan default rates recently stood (Figure 3), and its pessimistic forecast calls for a 14.9% default rate. The base case would result in roughly $280 billion of corporate defaults for calendar year 2020 alone. To put that number into perspective, it is greater than the level of US corporate defaults for all of 2008, 2009, and 2010 combined.

FIGURE 3 US HIGH-YIELD BOND AND LEVERAGED LOAN DEFAULT RATES
January 31, 1998 – June 30, 2020 • Percent (%)
Sources: Deutsche Bank, Moody’s Investor Services, and National Bureau of Economic Research.
Notes: All default data are based on trailing 12 months. Gray bars represent NBER-defined US recessions.
The sheer size of the potential bankruptcy pipeline could put a strain on the US corporate restructuring apparatus. To wit, a group of bankruptcy scholars recently called for Congress to increase budgets for bankruptcy courts and to bring some judges out of retirement to handle the anticipated surge. Such a wave of restructurings is exactly the raw material distressed debt specialists can use to produce competitive returns.
How does one invest in such an environment? For investors wanting to focus on the stressed and distressed debt opportunity set with a long bias, there are dedicated distressed debt hedge funds, as well as newer dislocation funds that have more of a private credit liability structure. Given that distressed debt opportunities have cooled for now, some investors might wish to be more defensive at this point as they await rising downgrades and defaults. This cohort may wish to consider credit opportunity hedge fund strategies, which tend to be more defensive and make greater use of short positions to mitigate risk.
While the volatility in corporate credit markets during first half 2020 was seemingly enough for one lifetime, current prices for many credit investments do not appear to reflect their rather dire underlying economic realities. This disconnect should present opportunities for credit hedge funds to capitalize on for months, if not years, to come.
Stephen Mancini, Senior Investment Director
Adam Perez, Senior Investment Director
Index Disclosures
Bloomberg Barclays US Corporate Bond Index
The Bloomberg Barclays US Corporate Bond Index measures the investment-grade, fixed-rate, taxable corporate bond market. It includes USD-denominated securities publicly issued by US and non-US industrial, utility, and financial issuers. The US Corporate Index is a component of the US Credit and US Aggregate Indices, and provided the necessary inclusion rules are met, US Corporate Index securities also contribute to the multi-currency Global Aggregate Index.
Bloomberg Barclays US Corporate High Yield Index
The Bloomberg Barclays US Corporate High Yield Index measures the US corporate market of non-investment-grade, fixed-rate corporate bonds. Securities are classified as high yield if the middle rating of Moody’s, Fitch, and S&P is Ba1/BB+/BB+ or below.