Capital markets continued to perform well in second quarter 2017, and volatility remained low. The S&P 500 Index reached historic highs in mid-June and returned 3.1% at quarter-end. Most sectors showed solid, positive performance. The exceptions, energy and telecommunications, each lost more than 6%. Growth outperformed value and large-cap stocks outperformed small caps, but all were in the black. In its best stretch since fourth quarter 2013, the STOXX Europe 600 Index returned over 7% in USD terms for two consecutive quarters in 2017. Emerging markets equities also appreciated significantly, with the MSCI Emerging Markets Index returning 6.3% in USD terms for the quarter. High-yield credit returned 2.1% in second quarter based on the J.P. Morgan High Yield Index.
As was widely expected, the US Federal Reserve raised interest rates and initiated discussion of its balance sheet normalization process. In addition, the Eurozone showed signs of increasing economic growth, prompting the European Central Bank (ECB) to signal a forthcoming move toward less accommodative monetary policy in the region.
Major hedge fund strategies diverged in performance, as measured by the indexes from Hedge Fund Research, Inc. The HFRI Equity Hedge Index returned 2.1%; the HFRI Event-Driven Index, 1.7%; and the HFRI Macro Index, -0.6%. In our last quarterly update, we discussed long/short equity and encouraged investors to remain patient with the strategy. This quarter, we examine the progress in the long/short equity space and challenges in the macro landscape.
Fundamental Hedge Fund Strategies
Long/Short Equity. Many of the bottom-up, fundamentals-focused hedge fund managers we follow posted positive returns and value-add in second quarter, adding to first quarter gains. Europe- and Asia-based long/short equity managers were standouts. Morgan Stanley reported midyear that long/short equity managers had produced positive alpha relative to the MSCI World Index in five of 2017’s six months. Among the major hedge fund categories, long/short equity has also been the best-performing hedge fund strategy for the first half of the year in absolute terms, based on HFR’s indexes.
Factor and style stock rotations remained tangible in the quarter, but restrained compared with the recent past. Mega-capitalization stocks like Amazon and Alphabet outperformed the S&P 500 Index once again in second quarter, but there was broader participation among sectors. The energy sector’s losses rendered it an outlier; however, many of the long/short equity managers we follow tend to avoid companies that are highly sensitive to commodity prices and so sidestepped the pitfalls.
While it is far too early to declare a cyclical rebound for this strategy, we are encouraged by the recent value-add trend.
Macro and Uncorrelated Hedge Fund Strategies
Second quarter was generally challenging for macro and uncorrelated strategies, as some managers were caught wrong-footed in certain positions around the globe. Slight flattening of the US yield curve over the quarter belied intraquarter volatility; ten-year US Treasury yields declined by 8 basis points (bps) over the quarter to end at 2.31%, but had reached as low as 2.13% in June. German ten-year bunds increased by 14 bps to end the quarter at 0.47%, but this overall result also disguised some larger swings. Oil prices declined nearly 10% during the quarter, and the US dollar weakened against a basket of currencies.
The CBOE Volatility Index—often referred to as the “fear index”—hit a 24-year low during second quarter. Many see this not as a sign that the global economic landscape is calm, but rather as a result of years of quantitative easing by central banks. It will be interesting to see what the ECB’s impending policy shift means for volatility, especially given that many global macro strategies rely on volatility in particular asset classes.
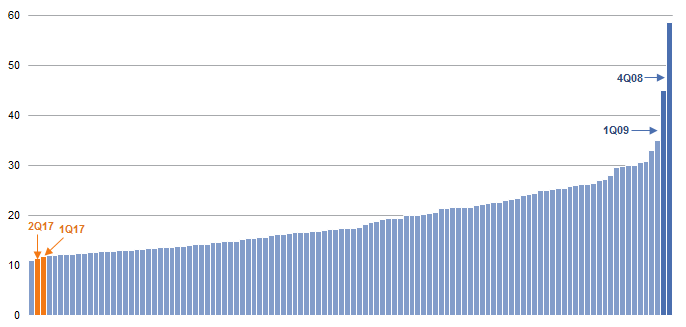
Quarterly S&P 500 Implied Volatility Sorted in Ascending Order
First Quarter 1990 – Second Quarter 2017
Sources: Bloomberg L.P., Chicago Board Options Exchange, and Standard & Poor’s.
Notes: The Chicago Board Options Exchange Volatility Index (“VIX”) reflects a market estimate of future volatility, based on the weighted average of the implied volatilites for a wide range of strikes. Exhibit calculates average VIX observed for each quarter based on daily closes.
While volatility in US stocks declined, some significant changes to asset prices in second quarter generally dampened macro funds’ returns. After news broke in May that Brazil’s president, Michel Temer, might have been involved in a bribery scheme, related movements affected some portfolio managers—the Brazilian equity market, as represented by the Bovespa stock index, fell 8.8% in a single day, and the Brazilian real declined on the news. However, a number of managers have bypassed equities in favor of Brazilian rates. Declining inflation in Brazil bolsters the argument for the nation’s interest rates to come down and some hedge fund managers continue to mine this theme (and even add to it) while cutting exposures to Brazilian equities and currency.
Second quarter continued to sap the strength the US dollar had exhibited in fourth quarter 2016. This may owe in part to concern over the US administration’s difficulty getting Congress to swiftly pass its pro-growth agenda. Some systematic hedge funds that take advantage of medium-term trends are short the US dollar against various currencies, so dollar weakness in the first half of the year has benefited them. Discretionary global macro managers, meanwhile, are worried that the dollar reversal is getting a little long in the tooth, believing that the fundamentals point toward a stronger US currency.