Long/Short Hedge Fund Strategies
At the midpoint of 2015, hedge funds as a group have outpaced widely quoted US large capitalization equity market indexes. Through June 30, 2015, the S&P 500 Index is up 1.2% and the Dow Jones Industrial Average is flat at 0.0% for the year, while the Credit Suisse Hedge Fund Index is up 2.0% and the HFRI Fund-Weighted Composite Index is up 2.5%. Equity-centric hedge funds have performed more strongly through the first half, with the Credit Suisse Long/Short Equity Hedge Fund Index up 3.5% and the HFRI Equity Hedge Index up 4.1%. The six months ended May and June 2015 represent the first time all four hedge fund indexes have outperformed the S&P 500 over a trailing six-month period since September 2011.
As the second quarter came to a close, global markets were shaken by another bout of fears over Greece exiting the European Union. With banks and the stock market closed, Greek Prime Minister Alexis Tsipras announced a referendum allowing Greek citizens to vote on a package of austerity measures proposed by creditors. On July 5, Greek citizens voted overwhelmingly against the deal, and many believed a “Grexit” was imminent. Greek government bonds, a holding for some hedge funds, saw yields skyrocket and prices fall. Through the last week of June and the first two weeks of July, prices on ten-year Greek government bonds fell by over 40%, and yields increased by approximately 8%. Given this turmoil, many investors were worried about their exposure to Greece. Across the group of hedge funds we speak with, Greek government bonds were the most prominent holding. However, very few of the managers we follow closely were involved with Greek government bonds, and those that were sized them as a small fraction of the total portfolio. Since the announcement of a bailout deal that will keep Greece in the European Union, Greek government bond prices have rebounded and ten-year government bonds are trading just below their mid-June levels.
While the situation in Greece was playing out, Puerto Rico Governor Alejandro García Padilla told The New York Times that Puerto Rico—a commonwealth mired in a recession with $72 billion in debt—was “in a death spiral” with debt that is simply “not payable.” To put Puerto Rico’s debt in context, the average debt per capita of the 50 US States is $1,419; Puerto Rico’s is $15,637, according to Moody’s Investors Service. To make matters worse, Puerto Rico is a US territory and by law cannot file for Chapter 9 bankruptcy. As such, it is widely expected that the commonwealth will have to restructure its debt, which could result in a messy legal situation that takes years to play out. While Puerto Rican debt is a more commonly held position than Greek government bonds for the group of hedge funds we monitor, exposure is still limited in both number of funds and sizes of positions. Funds are typically invested in general obligation (GO) bonds, whose repayment is guaranteed by the Puerto Rican constitution, and COFINA bonds, which are backed by sales tax revenue. Puerto Rico’s entire debt structure traded down after Padilla’s comments, with GO bonds falling nearly 12%. Investors’ fears were short lived as the Puerto Rico Electric Power Authority successfully made a $415 million debt payment four days after Padilla’s comments. Many of the managers we follow used the sell-off as an opportunity to increase their positions, and investors, including many of these managers, are beginning to form groups in anticipation of litigation. The situations in Greece and Puerto Rico resulted in a volatile end to the second quarter and highlight the importance of portfolio construction and risk management.
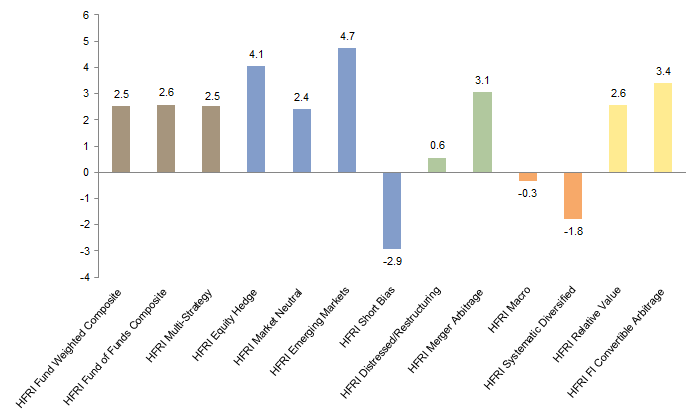
Year-to-Date Hedge Fund Performance: HFRI Indexes
January 1, 2015 – June 30, 2015 • Total Return (%)
Source: Hedge Fund Research, Inc.
Note: Hedge Fund Research data are preliminary for the preceding five months.
Event-Driven Strategies. The opportunity set for event-driven investing appears to be improving relative to late last year, which, as we have discussed in previous updates, was a challenging period for many managers. Broadly speaking, event-driven managers remain underweight distressed securities and credit, as the opportunities have been limited in scale and return potential. Instead, many have preferred to focus on catalyst-driven equities such as mergers & acquisitions (M&A) deals, where the environment has been much more robust and the opportunity set has been improving. According to Dealogic data, global M&A activity has continued to rise, reaching its second-highest half-year on record (by dollar), trailing only the first half of 2007. Likewise, after years of remaining tight, deal spreads have widened in recent months, with some large deals reaching mid-teens annualized internal rates of return, as there has been less capital—particularly from the investment banks—chasing returns.
Despite the positive backdrop, most event-driven managers have not generated exceptional performance. What is causing the disconnect? Unlike fourth quarter 2014, when managers could point to one or two specific events that generated material losses in their portfolios (Fannie/Freddie, Shire/AbbVie), fewer smoking guns can be found today. Rather, in our opinion, the cause is combination of any (or all) of the following factors:
- Liquidity across the capital markets continues to deteriorate. This trend has presented itself most definitively in credit markets, where a lack of dealer inventories has resulted in significantly decreased trading volume. More recently, this phenomenon has affected equity markets, particularly event-driven equities. Historically, investment banks’ proprietary trading desks were common participants in M&A, which increased liquidity in these securities. With the elimination of proprietary trading desks, one large market participant has notably tapered trading activity (although the reduced capital has likely fostered the aforementioned widening of deal spreads, thus improving potential returns).
- Government intervention—either directly via the Federal Trade Commission or indirectly via other agencies—has continued to affect deals. In 2014 nearly $600 billion worth of deals broke or were withdrawn, and a handful of deals have been cancelled this year as a result of government action (e.g., Comcast/Time Warner, Applied Materials/Tokyo Electron).
- Given that equity valuations are already rich, completing deals is becoming increasingly expensive: average US deal valuations reached an all-time high of 16x EBITDA in 2015, according to data from Thomson Reuters. As a result, some event-driven investors have questioned whether these deals create any real shareholder value, particularly when completed with cash rather than stock.
- Reduced liquidity, macroeconomic scares, and jittery investors still scarred from last year have resulted in increased volatility among event-driven positions. Given that many event-driven investors tend to be renters of stocks rather than long-term owners, those that have mishandled interim volatility between the announcement and completion of the event have been disproportionately punished.
We continue to believe that long-term, talented, and experienced event-driven investors will generate strong returns across a market cycle.
Diversifying Hedge Fund Strategies
Volatility, both on the market and macro-policy front, has increased in 2015, leading to further bifurcation between appropriately positioned hedge funds and those whose references continued to be 2014 and the accommodative post–global financial crisis environment. While previous concerns about the market effects of Ukraine, the Middle East, and a (premature) June US Federal Reserve rate rise did not materialize, a possible Grexit and a soaring Chinese market did materialize. Appropriately positioned hedge funds took advantage of higher rates, steeper yield curves, and equity and commodity volatility. Those that were exposed to reversals also suffered losses.
Over the course of the second quarter, the US stock market was virtually unchanged, and the Euro Stoxx Index fell more than 6%. The liberalization of the domestic Chinese equity market caused it to surge over 60% from mid-February before falling back to +25% after panicked (unsophisticated) retail selling caused a plummet, somewhat forestalled by subsequent government intervention. While gyrations in the domestic Chinese market may appear immaterial, the derivative effects for global demand are already being widely felt in commodities such as base metals and commodity exporters. Unrelated, and as a result of quantitative easing beginning in Europe and ending in the United States, the volatility in global fixed income was notable. For instance, German short rates went briefly negative in second quarter, while the yield on the German ten-year dropped to 8 bps and then soared to 99 bps. Less dramatically, yields on intermediate US bonds (five-year to 30-year) rose between 26 bps and 57 bps as quantitative easing ended and markets anticipated a Fed rate rise; the US Treasury curve steepened nearly 50 bps (measured between the two-year and the 30-year). With the US unemployment rate at its lowest in seven years, the Fed appears poised to raise rates; a raise did not materialize in June, as it seemed the Fed did not want to exacerbate or influence overseas events such as a potential Grexit or Chinese policy moves.
Systematic managers as a group maintained and even added to established trends and were hit with sharp reversals leading to losses as a group, with June being particularly pronounced. There were few exceptions; June losses for the group of managers we follow closely ranged between 1% and 8%. Those with a discretionary blend fared slightly better, or less badly. Discretionary macro and fixed income relative value and macro managers generally had good quarters, proactively avoiding China and Greece, while their yield curve steepening bets paid off; returns for second quarter ranged as high as 8%. In the credit space, especially corporate credit, returns continue to be positive as the default rate is benign at 2%, but spreads remain sensitive to external events. Concern in the press about the loan market generally ignores the fact that $180 billion per year needs to be reinvested (probably in more loan structures) from the cash being paid out from collateralized loan obligations.
For those diversifying hedge fund strategies that take advantage of re-established trends—the Euro Stoxx performing well now that Greece is (seemingly, at this writing) out of the way, the Fed lifting rates before year-end, and the continued strength of the US dollar—it could be a good second half.