Overview
In USD terms, the Cambridge Associates LLC Global ex US Developed Markets Private Equity and Venture Capital Index returned 4.9% in third quarter 2016; the Cambridge Associates LLC Emerging Markets Private Equity and Venture Capital Index returned 2.6%. Both indexes performed much better in the third quarter than in the second; a somewhat stronger euro helped boost the developed markets index. Public indexes tracking companies in Europe and emerging markets also rebounded during the quarter. Based on public market equivalents, the developed markets private index (in both USD and EUR terms) has consistently beaten the public index over the time horizons in Table 1, falling short in only the third quarter. The emerging markets private benchmark has trailed the public index recently but bested it over the three-year horizon and longer periods. Cambridge Associates’ modified public market equivalent (mPME) calculation is a private-to-public comparison that seeks to replicate private investment performance under public market conditions.
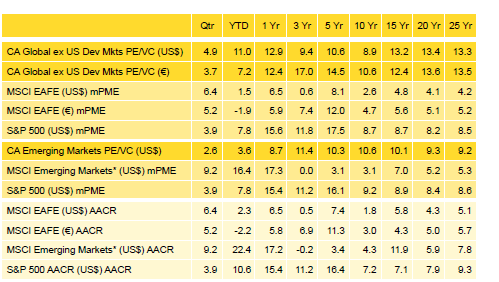
Table 1. Returns for the Global ex US Developed and Emerging Markets PE/VC Indexes vs Public Counterparts
Periods Ending September 30, 2016 • Percent (%)
Sources: Cambridge Associates LLC, MSCI Inc., Standard & Poor’s, and Thomson Reuters Datastream. MSCI data provided “as is” without any express or implied warranties.
Notes: The PE/VC indexes are pooled horizon internal rates of return and are based on limited partners’ fund-level performance; the returns are net of fees, expenses, and carried interest. Because the indexes are capital weighted, performance is mainly driven by the largest vintage years. Public index returns are shown as both time-weighted returns (average annual compound returns) and dollar-weighted returns (modified public market equivalent). The CA mPME replicates private investment performance under public market conditions. The public index’s shares are purchased and sold according to the private fund cash flow schedule, with distributions calculated in the same proportion as the private fund, and mPME net asset value is a function of mPME cash flows and public index returns.
* Returns for the MSCI Emerging Markets Index begin 1/1/1988; to match the 1986 inception of the Emerging Markets PE/VC Index, price returns from Global Financial Data are used for the period 1/1/1986 to 12/31/1987.
Changes to the Sector Classification Methodology for CA Benchmarks
Historically, Cambridge Associates has categorized private equity and venture capital portfolio company investments using a proprietary sector classification methodology, and sector returns discussed in previous editions of these commentaries have been based on that proprietary system. Beginning with this edition of our commentary, we are presenting sector performance based on the Global Industry Classification Standard (GICS). As a result of the shift to GICS, the sector breakdown of the various indexes has changed (Figures 1 and 2). One benefit of using GICS for private investments classification is that it enables more accurate sector comparisons to public indexes. GICS was developed by and is the exclusive property and a service mark of MSCI Inc. and S&P Global Market Intelligence LLC and is licensed for use by Cambridge Associates.
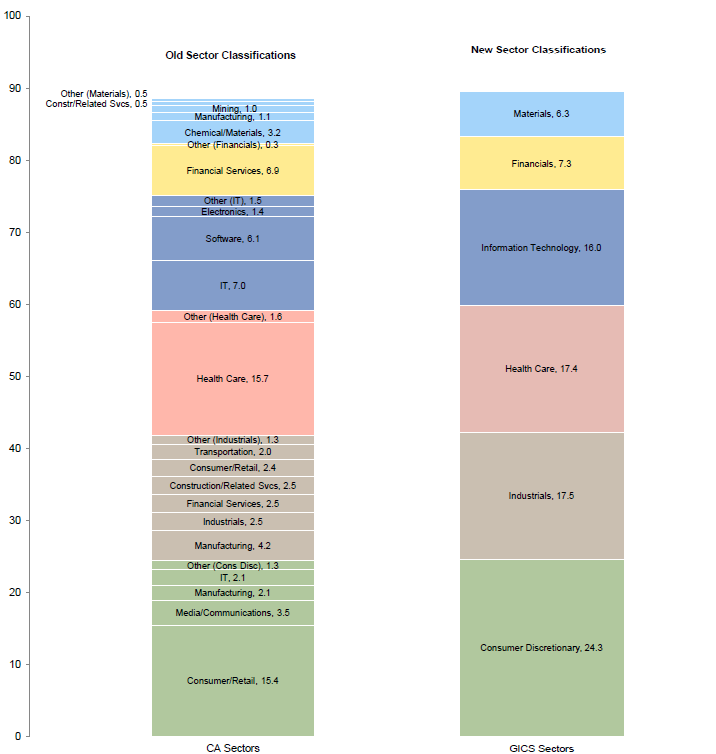
Figure 1. Global ex US Dev Markets PE/VC Index: Mapping the CA Sector Classification to GICS Sectors
As of September 30, 2016 • Percent (%)
Notes: Maps CA sectors to the GICS sectors that make up at least 5% of the Global ex US Developed Markets PE/VC Index. Old sector weights may not sum to new sector weights due to rounding. In several cases companies in the same sector under the old classification system mapped to different GICS sectors. Sectors making up less than 5% of the index under the GICS classification are not shown.
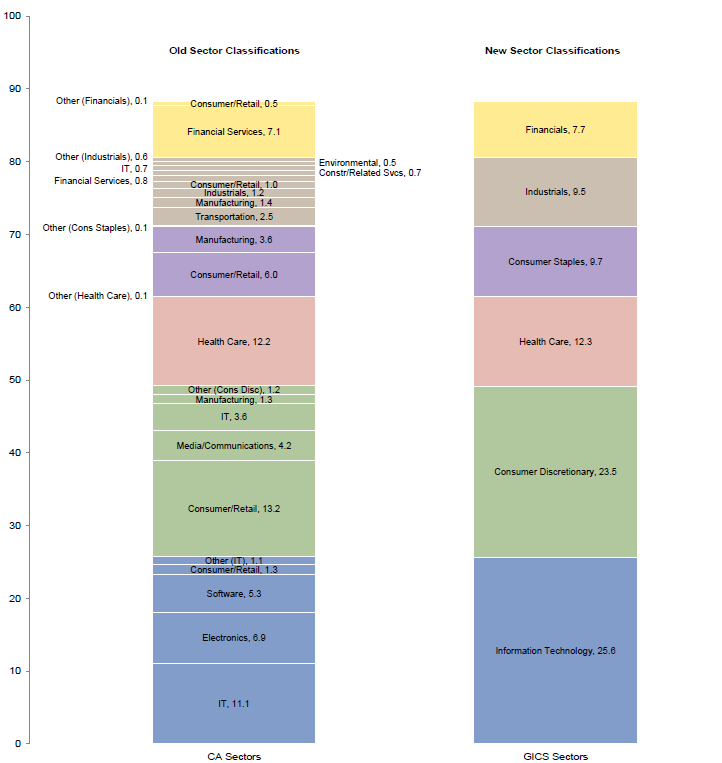
Figure 2. Emerging Markets PE/VC Index: Mapping the CA Sector Classification to GICS Sectors
As of September 30, 2016 • Percent (%)
Notes: Maps CA sectors to the GICS sectors that make up at least 5% of the Emerging Markets PE/VC Index. Old sector weights may not sum to new sector weights due to rounding. In several cases companies in the same sector under the old classification system mapped to different GICS sectors. Sectors making up less than 5% of the index under the GICS classification are not shown.
Third Quarter 2016 Highlights
- As of September 30, 2016, the developed markets PE/VC index had outperformed its comparable public equity index (MSCI EAFE) based on mPME returns in eight of the nine periods listed in Table 1. Outperformance was particularly strong in the three-year horizon and all periods of ten years or longer.
- The emerging markets PE/VC index beat its corresponding public market benchmark (MSCI Emerging Markets Index) in mPME terms across six of the nine time periods; it trailed the public markets from October 2015 through September 2016.
- Geographically, the two indexes remained stable during the quarter with Western Europe dominating the developed markets index and China and India representing the only two countries to account for more than 5% of the emerging markets index. South Korea was close to meeting the 5% threshold, representing 4.8% of the emerging markets index as of September 30. Six other countries—Australia, Brazil, Japan, Singapore, the United Kingdom, and the United States—each represented between 2.5% and 3.5% of the index, for a total of almost 17%.
- Public companies accounted for about 9% of the developed markets PE/VC index and nearly 15% of the emerging markets PE/VC index.
Global ex US Developed Markets Private Equity and Venture Capital Performance Insights
- During the third quarter, all eight vintages representing more than 5% of the index produced positive returns; together these eight accounted for almost 90% of the benchmark’s value (Table 2). Returns among these eight “meaningfully sized” vintages ranged from 3.2% to 7.1%, with the 2006 vintage earning the quarter’s lowest return (2005 was second worst, marking the first time since third quarter 2015 that the vintage wasn’t the worst performer) and 2007 the highest. Write-ups in the consumer discretionary, financials, industrials, and telecommunications sectors were the major positive drivers for the 2006 vintage, with write-downs in health care costing the group. The 2007’s strong return was buoyed by write-ups in health care, consumer discretionary, and information technology (in rank order). In the largest vintage year, 2012, materials, health care, and information technology (in rank order) were the best performers.
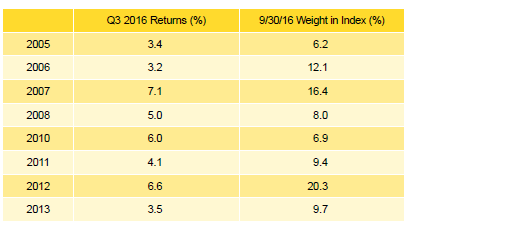
Table 2. Global ex US Developed Markets PE/VC Index Vintage Year Returns:
Net Fund-Level Performance
Notes: Returns in USD terms. Vintage year fund-level returns are net of fees, expenses, and carried interest.
- Developed markets private equity and venture capital funds called $5.2 billion from investors during the third quarter, a 41% decrease from the second quarter. Over the first nine months of 2016, fund managers called $19.1 billion, in contrast to the almost $24 billion called during the same period in 2015 (Figure 3). Limited partner (LP) distributions totaled $15.5 billion in third quarter, a 16% increase over the prior quarter. Distributions in the first nine months of 2016 trailed those made in the same period in 2015 by roughly $6 billion. In keeping with the trend since the beginning of 2011, distributions outpaced contributions.

Figure 3. Contributions, Distributions, and NAV: Global ex US Dev Markets
2005–16 (September 30)
- Managers of funds raised in 2011–15 called $4.2 billion, or 82% of the total capital called during the quarter. All five vintage years called more than $700 million; only the 2012 funds called more than $1 billion. Four vintages, 2005–08, distributed more than $1 billion for a combined total of $10.4 billion (67% of the total). The 2006 and 2007 vintage years led the way, distributing $3.6 billion each.
- All six meaningfully sized sectors earned positive returns for the quarter when measured in either US dollars or euros (Table 3). Among the key sectors, consumer discretionary earned the lowest return and materials the highest. For consumer discretionary, the index’s largest sector, write-ups were dominated by vintage year 2007. The materials sector was the smallest of the large constituents and its performance was driven mostly by write-ups in vintage year 2012. The four largest sectors—consumer discretionary, industrials, health care, and information technology—represented 75% of the index’s value and on a dollar-weighted basis returned 6.1%, outperforming the index’s total gross return of 5.9%.
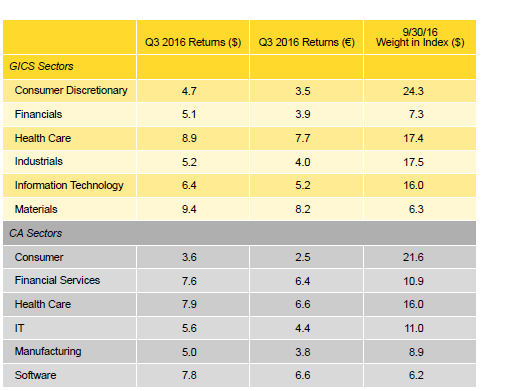
Table 3. Global ex US Developed Markets PE/VC Index Sector Returns:
Gross Company-Level Performance
Percent (%)
Note: Industry-specific gross company-level returns are before fees, expenses, and carried interest.
- Nearly 70% of the capital invested during the quarter went into four sectors, consumer discretionary, health care, industrials, and financials (in rank order). Over the long term, these four sectors garnered closer to 64% of the capital as a group; the differences lie in higher than usual allocations to health care and financials, and lower than average allocations to consumer discretionary and industrials.
- The five countries representing the bulk of the index all posted positive returns during the third quarter (Table 4). The United Kingdom earned the lowest return and Sweden the highest. Consumer discretionary, financials, and telecommunications were the largest positive drivers for the United Kingdom, and write-downs in industrials dampened performance. Swedish consumer discretionary and industrial companies drove that country’s 7.4% return. For the quarter, the gross dollar-weighted return for the three largest countries, the United States, the United Kingdom, and Germany, was 4.4%, about 150 basis points lower than the index’s total gross return.[1]Funds in the global ex US developed markets PE/VC index primarily invest in companies in Europe, but occasionally make investments in US companies as well.
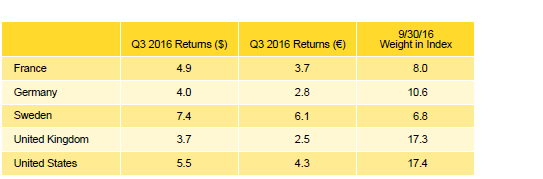
Table 4. Global ex US Developed Markets PE/VC Index Country Returns:
Gross Company-Level Performance
Percent (%)
Note: Gross company-level returns are before fees, expenses, and carried interest.
- European companies attracted 73% of the capital invested during the quarter, about 3% less than the long-term norm for the region. Investment in US-based companies (about 9% of total) was 3% lower than what it has been historically in the global manager index.
Emerging Markets Private Equity and Venture Capital Performance Insights
- After two quarters of anemic returns, the Cambridge Associates LLC Emerging Markets Private Equity and Venture Capital Index posted its best performance of 2016 in the third quarter, but it was still not enough to match the strong returns by public market benchmarks. In mPME terms the index trailed the MSCI EM Index by 6.6 percentage points (ppts) for the quarter and 12.8 ppts year-to-date.
- At the end of the quarter, vintage years 2006 through 2014 accounted for 93% of the emerging markets index (Table 5). The third quarter marked the first period in 2016 that all meaningfully sized vintages posted positive returns. The 2011 vintage led the way with a 4.3% return; the 2012 vintage eked out a 0.2% gain.

Table 5. Emerging Markets PE/VC Index Vintage Year Returns:
Net Fund-Level Performance
Notes: Returns in USD terms. Vintage year fund-level returns are net of fees, expenses, and carried interest.
- The 2011 vintage saw mark ups across all sectors with notable gains made in the consumer discretionary, financial, and health care sectors. The other top-performing vintage year for the quarter, 2014, was driven by increases in the consumer discretionary and information technology sectors.
- The largest vintage year in the index continued to be 2007, which accounted for over 18% of the index’s market value at quarter end. Performance for 2007 funds was 3.1% for the quarter, attributable to strong returns by the financial, health care, and information technology sectors. As older vintages continued to wind down, the 2013 and 2014 vintages, both still in their investment periods, joined vintage years 2006 through 2012 as meaningfully sized vintages in the third quarter.
- During third quarter 2016, emerging markets private equity and venture capital funds called $3.1 billion from investors, a 20% drop from the second quarter (Figure 4). Notably, capital calls have shrunk in each quarter of 2016 from the prior quarter’s mark. Managers of funds raised from 2013 through 2015 called $1.9 billion, or 61% of all dollars called for the quarter. Distributions totaled $5.3 billion and represented a 45% increase from the second quarter. The third quarter distributions represented a return to normal for the index, which has averaged $5.4 billion in quarterly distributions over the past three years. Managers of funds raised in 2006, 2007, 2010, and 2011 returned a combined $3.7 billion to investors, representing 69% of the quarter’s total. Of those four vintages, 2007 funds were by far the largest distributors with $1.4 billion returned to LPs.
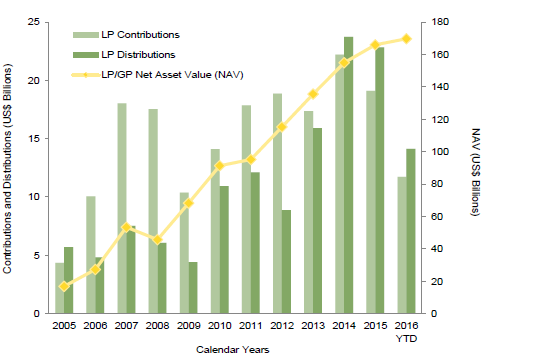
Figure 4. Contributions, Distributions, and NAV: Emerging Markets
2005–16 (September 30)
- As with the largest vintage years in the emerging markets index, each of the six meaningfully sized sectors posted positive quarterly returns (Table 6). Financials posted the strongest return with a 6.3% increase, and industrials rounded out the group with a 2.0% gain. Positive returns by investments made by funds formed in 2007, 2011, and 2012 helped drive performance for financials. Funds from the 2007 vintage years were the leading contributors to quarterly performance for five of the six large sectors. On a gross dollar-weighted basis, the two largest sectors by market value, consumer discretionary and information technology, together returned 2.8% during the quarter, narrowly underperforming the 2.9% return for all companies. The two largest sectors represented 49% of the index’s market value.

Table 6. Emerging Markets PE/VC Index Sector Returns:
Gross Company-Level Performance
Notes: Returns in USD terms. Industry-specific gross company-level returns are before fees, expenses, and carried interest.
- Consumer discretionary, consumer staples, and health care companies (in rank order) attracted the most capital during the third quarter, about 63% of all dollars invested. Investment activity in the third quarter was on par with capital invested in the second quarter at approximately $3.7 billion. Over the long term, managers in the emerging markets index have allocated 82% of their capital to six sectors: consumer discretionary, consumer staples, financials, health care, industrials, and information technology.
- The index’s geographic representation continued to be dominated by China and India, which respectively represented 46.8% and 8.2% of the index by market value (Table 7). This quarter was the first of the year with positive performance for China-based companies, bringing performance for the first nine months to 1.3%. Companies in India returned an impressive 7.6% for the third quarter. Returns there were driven by substantial mark ups in the country’s largest vintage by market value, 2007.

Table 7. Emerging Markets PE/VC Index Country Returns:
Gross Company-Level Performance
Notes: Returns in USD terms. Gross company-level returns are before fees, expenses, and carried interest.
- Performance in China was attributable to positive returns in its four largest vintages, 2007, 2008, 2010, and 2011. China continued to be the leading destination for capital from emerging markets managers and it received 45% of all invested dollars in the third quarter. Despite being the second largest market in the emerging index, investment in India has continued to cool as investors allocated more money to Indonesia and South Korea in the quarter. The third quarter marked the fourth consecutive quarter where India was not among the top three destinations for capital from emerging markets managers.
- Among countries representing at least 2.75% of the emerging markets index, Japan had the largest quarterly return at 13.7%. Australia delivered its second consecutive double-digit quarterly gain by posting a 10.2% return.
About the Cambridge Associates LLC Indexes
Cambridge Associates derives its Global ex US Developed Markets Private Equity and Venture Capital Index from the financial information contained in its proprietary database of global ex US private equity and venture capital funds. As of September 30, 2016, the database comprised 843 global ex US developed markets private equity and venture capital funds formed from 1986 to 2016 with a value of about $252 billion. Ten years ago, as of September 30, 2006, the benchmark index included 455 global ex US developed markets funds, whose value was roughly $111 billion. The funds in this index invest primarily in developed markets in Australia, Canada, Israel, Japan, New Zealand, Singapore, and Western Europe.
Cambridge Associates derives its Emerging Markets Private Equity and Venture Capital Index from the financial information contained in its proprietary database of global ex US private equity and venture capital funds. As of September 30, 2016, the database comprised 606 emerging markets funds formed from 1986 to 2016 with a value of $170 billion. Ten years ago, as of September 30, 2006, the benchmark index included 273 emerging markets funds, whose value was $22 billion. The funds in this index invest primarily in Africa, emerging Asia, emerging Europe, Latin America & Caribbean, and the Middle East ex Israel.
The pooled returns represent the net periodic rates of return calculated on the aggregate of all cash flows and market values as reported to Cambridge Associates by the funds’ general partners in their quarterly and annual audited financial reports. These returns are net of management fees, expenses, and performance fees that take the form of carried interest.
About the Public Indexes
The MSCI EAFE Index is a free-float-adjusted market capitalization–weighted index that is designed to measure large- and mid-cap equity performance of developed markets, excluding Canada and the United States. As of September 2016 the MSCI EAFE Index consisted of the following 21 developed markets country indexes: Australia, Austria, Belgium, Denmark, Finland, France, Germany, Hong Kong, Ireland, Israel, Italy, Japan, the Netherlands, New Zealand, Norway, Portugal, Singapore, Spain, Sweden, Switzerland, and the United Kingdom.
The MSCI Emerging Markets Index is a free-float-adjusted market capitalization–weighted index that is designed to measure large- and mid-cap equity performance of emerging markets. As of September 2016, the MSCI Emerging Markets Index included 23 emerging markets country indexes: Brazil, Chile, China, Colombia, Czech Republic, Egypt, Greece, Hungary, India, Indonesia, Korea, Malaysia, Mexico, Peru, the Philippines, Poland, Russia, Qatar, South Africa, Taiwan, Thailand, Turkey, and the United Arab Emirates.
The Standard & Poor’s 500 Composite Stock Price Index is a capitalization-weighted index of 500 stocks intended to be a representative sample of leading companies in leading industries within the US economy. Stocks in the index are chosen for market size, liquidity, and industry group representation.
Footnotes