Overview
Second quarter returns, in USD terms, for the Cambridge Associates LLC Global ex US Developed Markets Private Equity and Venture Capital Index and the Cambridge Associates LLC Emerging Markets Private Equity and Venture Capital Index were 1.3% and 0.7%, respectively. The dollar strengthened a bit from March to June, helping to dampen returns measured in US dollars. Public indexes tracking European companies generally suffered losses during the quarter, while emerging markets indexes were marginally positive. Based on public market equivalents, the developed markets private index (in both USD and EUR) has beaten the public index over the short, medium, and long terms, and the emerging markets private benchmark has only fallen short of the public index in 2016 (Table 1). Cambridge Associates’ modified public market equivalent (mPME) calculation is a private-to-public comparison that seeks to replicate private investment performance under public market conditions.
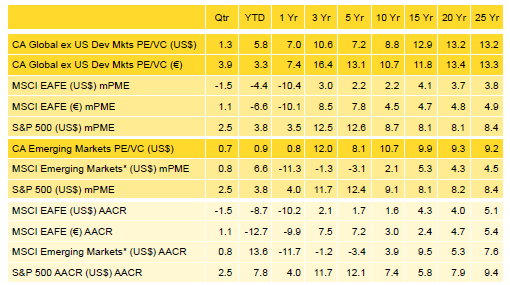
Table 1. Returns for the Global ex US Developed and Emerging Markets PE/VC Indexes vs Public Counterparts
Periods Ended June 30, 2016 • Percent (%)
Sources: Cambridge Associates LLC, MSCI Inc., Standard & Poor’s, and Thomson Reuters Datastream. MSCI data provided “as is” without any express or implied warranties.
Notes: The PE/VC indexes are pooled horizon internal rates of return and are based on limited partners’ fund-level performance; the returns are net of fees, expenses, and carried interest. Because the indexes are capital weighted, performance is mainly driven by the largest vintage years. Public index returns are shown as both time-weighted returns (average annual compound returns) and dollar-weighted returns (modified public market equivalent). The CA mPME replicates private investment performance under public market conditions. The public index’s shares are purchased and sold according to the private fund cash flow schedule, with distributions calculated in the same proportion as the private fund, and mPME net asset value is a function of mPME cash flows and public index returns.
* Returns for the MSCI Emerging Markets Index begin 1/1/1988; to match the 1986 inception of the Emerging Markets PE/VC Index, price returns from Global Financial Data are used for the period 1/1/1986 to 12/31/1987.
Second Quarter 2016 Highlights
- As of June 30, 2016, the developed markets PE/VC index has outperformed its comparable public equity index (MSCI EAFE) based on mPME for all nine periods listed in Table 1. In all time horizons longer than a year, the private equity index bested the EAFE by at least 500 basis points (bps).
- The emerging markets PE/VC index beat its corresponding public market benchmark (MSCI Emerging Markets Index) in mPME terms across all the periods except two (first quarter and first six months of 2016) highlighted in the table. Outperformance in the one-, three-, and five-year periods was particularly strong.
- Geographically, the two indexes remained stable during the quarter with Western Europe dominating the developed markets index and China and India representing the only two countries to account for more than 5% of the emerging markets index. While no other individual country represented more than 5% of the index, South Korea has been inching toward that threshold (at 4.8% as of June 30) and six countries—Australia, Brazil, Japan, Singapore, the United Kingdom, and the United States—each represented between 2.5% and 3.6% of the index, for a total of almost 17%.
- Public companies accounted for almost 11% of the developed markets PE/VC index and nearly 15% of the emerging markets PE/VC benchmark.
Global ex US Developed Markets Private Equity and Venture Capital Performance Insights
- During the second quarter, all but two of the eight vintages that represented more than 5% of the index produced positive returns; together these eight accounted for 90% of the benchmark’s value (Table 2). Returns among the eight “meaningfully sized” vintages ranged from -4.1% to 4.7%, with the 2005 vintage earning the quarter’s lowest return (for the third quarter in a row) and 2013 the highest. Consumer company write downs were the key driver of the 2005 vintage’s performance and in the 2013 vintage, write ups were widespread (among seven sectors) and led by hardware. In the largest vintage year, 2012, modest gains in most sectors were virtually offset by write downs in health care and industrials.
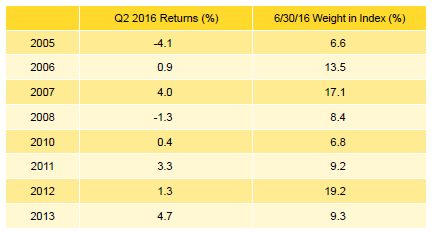
Table 2. Global ex US Developed Markets PE/VC Index Vintage Year Returns: Net Fund-Level Performance
Notes: Returns in USD terms. Vintage year fund-level returns are net of fees, expenses, and carried interest.
- Developed markets private equity and venture capital funds called $6.9 billion from investors during the second quarter, a 33% increase over the first quarter. LP distributions totaled $13.2 billion, a 12% drop from the first quarter and a 38% decrease from fourth quarter 2015. Distributions outpaced contributions, a trend that has held true in all but three quarters since the beginning of 2011.
- Managers of funds raised in 2012, 2013, and 2014 called about $5.2 billion, or 75% of the total capital called during the quarter. All three vintage years called more than $1 billion; the 2012 funds led the group with $2.9 billion in calls. Four vintages, 2005–08 each distributed more than $1.6 billion for a combined total of $10 billion (76% of total). The 2007 vintage year led the way, distributing $3.4 billion.
- Four of the six meaningfully sized sectors earned positive returns for the quarter in USD terms; when measured in euros, performance was much stronger and all sectors were positive (Table 3). Among the key sectors, there was little variation in the positive performers (returns were between 2.4% and 2.6% in USD terms), and returns for the two negative performers, financial services and consumer, were -2.3% and -0.1%, respectively. Health care, the quarter’s second largest and best-performing sector, saw significant write-ups in vintage years 2007 and 2011 and large write-downs in the 2005, 2006, 2012, and 2013 vintages. Amid lackluster gains in most vintages, two years, 2006 and 2010, were almost solely responsible for the negative return for financial services. The four largest sectors—consumer, health care, IT, and financial services—represented around 59% of the index’s value and on a dollar-weighted value returned 0.7%, underperforming the index’s total gross return of 1.3%.

Table 3. Global ex US Developed Markets PE/VC Index Sector Returns: Gross Company-Level Performance
Percent (%)
Note: Industry-specific gross company-level returns are before fees, expenses, and carried interest.
- Almost 75% of the capital invested during the quarter went into four sectors, health care, consumer, media, and financial services (in rank order). Over the long term, these four sectors garnered 54% of the capital.
- Three of the five countries representing the bulk of the index posted positive returns during the second quarter; Sweden and the United Kingdom were the exceptions (Table 4). The best-performing country was France. For the quarter, the gross dollar weighted return for the two largest countries, the United Kingdom and the United States, was -1.1%, almost 20 bps lower than the index’s total gross return.[1]Funds in the global ex US developed markets PE/VC index primarily invest in companies in Europe, but occasionally make investments in US companies as well.
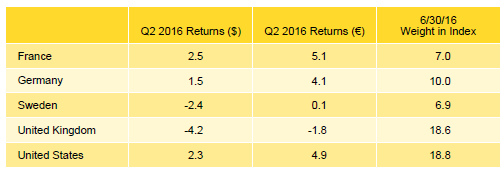
Table 4. Global ex US Developed Markets PE/VC Index Country Returns: Gross Company-Level Performance
Percent (%)
Note: Gross company-level returns are before fees, expenses, and carried interest.
- European companies attracted 54% of the capital invested during the quarter, about 22% less than the long term norm for the region. Investment in US-based companies (about 36% of total) was about 24% higher than what it has been historically in the global manager index.
Emerging Markets Private Equity and Venture Capital Performance Insights
- At the end of the second quarter, vintage years 2006 through 2012 accounted for 83% of the emerging markets index (Table 5). The quarter yielded mixed results for these larger vintages as four of the seven vintages earned either flat or negative returns. The 2010 vintage, for example, erased much of its first quarter gains with a -2.7% return in the second quarter.
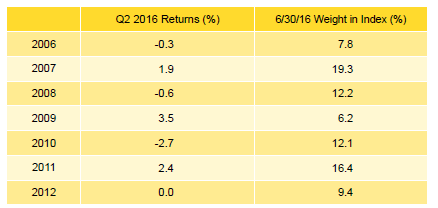
Table 5. Emerging Markets PE/VC Index Vintage Year Returns: Net Fund-Level Performance
Notes: Returns in USD terms. Vintage year fund-level returns are net of fees, expenses, and carried interest.
- In 2009, the quarter’s best-performing vintage, four sectors buoyed returns: consumer, environmental, media, and financial services (in rank order). Although the consumer sector was a strength for the 2009 group, it was the biggest detractor (followed by the IT and manufacturing sectors) in the underperforming 2010 vintage.
- At the close of the first half of 2016, the 2007 vintage was the index’s largest, representing 19% of the benchmark. Performance for 2007 funds was 1.9% for the quarter, with the modest gains driven by the consumer, financial services, manufacturing, and transportation sectors. The 2013 and 2014 vintages both narrowly missed the cutoff for meaningfully sized vintages; both vintages performed well with returns of 2.0% and 3.9%, respectively.
- During second quarter 2016, emerging markets private equity and venture capital funds called $3.3 billion from investors, a 22% decrease from the prior quarter and the smallest amount called since the first quarter of 2013. Distributions totaled $3.5 billion and represented a 31% decrease from the previous quarter’s total. The second quarter distributions amounted to the smallest quarterly payout since third quarter 2013. The second quarter’s distributions outpaced contributions, which has only occurred in 19 of the 119 quarters since the inception of the index in 1986. Notably, 11 of the 19 occurrences have happened in the past three and a half years.
- Managers of funds raised from 2011 through 2015 called $2.9 billion, or 87% of the total for the quarter; the 2011 managers led the way with $912 million of calls. On the distributions front, managers of funds raised in 2006 and 2007 returned a combined $1.7 billion to investors, accounting for 49% of the quarter’s total.
- Five of the seven meaningfully sized sectors posted positive quarterly returns (Table 6). For the second consecutive quarter, manufacturing led the pack with a 3.7% return while IT earned the lowest return at -1.6%. Nearly 54% of the manufacturing write-ups were attributed to investments made by funds formed in 2007 and 2011. For the 2007 funds, the second quarter was a continuation of their strong performance in the first quarter and for the 2011 vintage, the quarter was a rebound from negative performance in first quarter 2016. The IT sector was hurt by major write-downs by 2006 vintage funds and minor losses in 2007 and 2010 vintage year funds. On a positive note, the IT sector’s largest vintage year by market value, 2011, was up for the quarter.
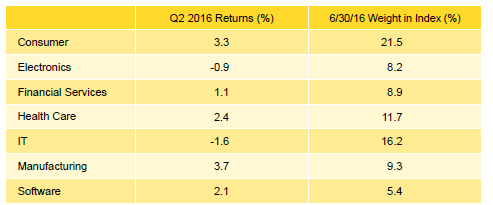
Table 6. Emerging Markets PE/VC Index Sector Returns: Gross Company-Level Performance
Notes: Returns in USD terms. Industry-specific gross company-level returns are before fees, expenses, and carried interest.
- On a gross dollar-weighted basis, the three largest sectors by market value returned 1.4% during the quarter, narrowly outperforming the 1.3% return for all companies.
- Consumer, IT, and health care companies (in rank order) garnered the most capital during the quarter, about 57% of the capital invested; consumer businesses alone attracted a whopping 33% of the total. Investment activity in the second quarter represented an 18% decrease over the previous quarter. Over the long term, managers in the emerging markets index have allocated nearly 70% of their capital to five sectors, consumer, financial services, health care, IT, and manufacturing.
- The index’s geographic concentration remained virtually unchanged as China and India continued to be the only two countries constituting more than 5% of the index by market value (Table 7). Together these colossal economies accounted for approximately 54% of the index. South Korea remained just below the 5% threshold at 4.8% of the total index value.
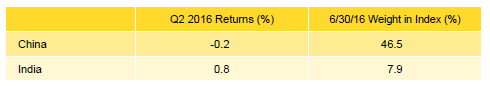
Table 7. Emerging Markets PE/VC Index Country Returns: Gross Company-Level Performance
Notes: Returns in USD terms. Gross company-level returns are before fees, expenses, and carried interest.
- China-based companies continued to receive and return more capital than any other country. Performance for China suffered due to underperformance in its four largest vintages, 2006, 2007, 2008, and 2011. Write downs for India-based companies in the 2006 vintage were the only major losers for the country in an otherwise solid quarter. While India is second in the index in terms of market value, it attracted less capital than Australia, Canada, and South Korea during the quarter.
- On a gross dollar-weighted basis, when combined, returns for China and India were flat in the second quarter. Australia earned the best return, 16.0%, among countries representing at least 2.75% of the index.
About the Cambridge Associates LLC Indexes
Cambridge Associates derives its Global ex US Developed Markets Private Equity and Venture Capital Index from the financial information contained in its proprietary database of global ex US private equity and venture capital funds. As of June 30, 2016, the database comprised 819 global ex US developed markets private equity and venture capital funds formed from 1986 to 2015 with a value of about $248 billion. Ten years ago, as of June 30, 2006, the benchmark index included 435 global ex US developed markets funds, whose value was roughly $108 billion. The funds in this index invest primarily in developed markets in Australia, Canada, Israel, Japan, New Zealand, Singapore, and Western Europe.
Cambridge Associates derives its Emerging Markets Private Equity and Venture Capital Index from the financial information contained in its proprietary database of global ex US private equity and venture capital funds. As of June 30, 2016, the database comprised 588 emerging markets funds formed from 1986 to 2015 with a value of $164 billion. Ten years ago, as of June 30, 2006, the benchmark index included 266 emerging markets funds, whose value was $20 billion. The funds in this index invest primarily in Africa, emerging Asia, emerging Europe, Latin America & Caribbean, and the Middle East ex Israel.
The pooled returns represent the net periodic rates of return calculated on the aggregate of all cash flows and market values as reported to Cambridge Associates by the funds’ general partners in their quarterly and annual audited financial reports. These returns are net of management fees, expenses, and performance fees that take the form of carried interest.
About the Public Indexes
The MSCI EAFE Index is a free-float-adjusted market capitalization–weighted index that is designed to measure large- and mid-cap equity performance of developed markets, excluding Canada and the United States. As of June 2016 the MSCI EAFE Index consisted of the following 21 developed markets country indexes: Australia, Austria, Belgium, Denmark, Finland, France, Germany, Hong Kong, Ireland, Israel, Italy, Japan, the Netherlands, New Zealand, Norway, Portugal, Singapore, Spain, Sweden, Switzerland, and the United Kingdom.
The MSCI Emerging Markets Index is a free-float-adjusted market capitalization–weighted index that is designed to measure large- and mid-cap equity performance of emerging markets. As of June 2016, the MSCI Emerging Markets Index included 23 emerging markets country indexes: Brazil, Chile, China, Colombia, Czech Republic, Egypt, Greece, Hungary, India, Indonesia, Korea, Malaysia, Mexico, Peru, the Philippines, Poland, Russia, Qatar, South Africa, Taiwan, Thailand, Turkey, and the United Arab Emirates.
The Standard & Poor’s 500 Composite Stock Price Index is a capitalization-weighted index of 500 stocks intended to be a representative sample of leading companies in leading industries within the US economy. Stocks in the index are chosen for market size, liquidity, and industry group representation.
Footnotes