Overview
The Cambridge Associates LLC Global ex US Developed Markets Private Equity and Venture Capital Index® returned 7.6% in US$ terms in second quarter 2015; the Cambridge Associates Emerging Markets Private Equity and Venture Capital Index® returned 4.4%. Bucking the recent trend, the euro strengthened a bit in the second quarter, helping to boost returns measured in US dollars. Non-US public indexes tracking companies in the developed and emerging markets produced modestly positive returns in the second quarter. In the public markets, the emerging markets index slightly outperformed the developed markets. Both the developed and emerging markets private indexes have beaten the public indexes over the long term.
Performance for the Cambridge Associates LLC Global ex US Developed Markets and Emerging Markets PE/VC Indexes is derived from data compiled from institutional quality funds raised between 1986 and 2015. There are more than 760 funds in the developed markets index and over 550 in the emerging markets index. Funds in the global ex US developed market PE/VC index primarily invest in companies in Europe, but occasionally make investments in US companies as well.
Second Quarter 2015 Highlights
- The developed markets PE/VC index outperformed its comparable public equity index (MSCI EAFE) in six of the eight time periods ending June 30, 2015, listed in Table 1. The private equity index’s slight underperformance has been recent as it has beaten the EAFE index handily in time horizons of five years and longer.
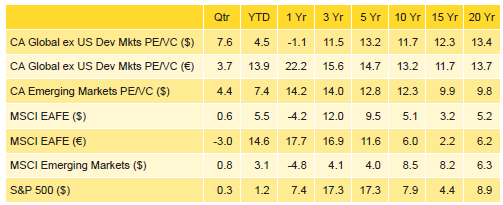
Table 1. Returns for the Global ex US Developed and Emerging Markets PE/VC Indexes vs Public Counterparts
Periods Ended June 30, 2015 • Percent (%)

Sources: Cambridge Associates LLC, MSCI Inc., Standard & Poor’s, and Thomson Reuters Datastream. MSCI data provided “as is” without any express or implied warranties.
Notes: The CA global ex US developed markets index includes private equity and venture capital funds that invest primarily in developed markets in Australia, Canada, Israel, Japan, New Zealand, Singapore, and Western Europe. The CA emerging markets index includes private equity and venture capital funds that invest primarily in Africa, emerging Asia, emerging Europe, Latin America & Caribbean, and the Middle East ex Israel. Because the indexes are capital weighted, performance is mainly driven by the largest vintage years. The PE/VC indexes’ returns are based on limited partners’ fund-level performance; the returns are net of fees, expenses, and carried interest.
- The emerging markets PE/VC index bested its corresponding public market benchmark (MSCI Emerging Markets) across all the periods shown in the table. Outperformance in the one-, three-, and five-year periods was particularly strong.
- Geographically, the two indexes remained largely stable during the quarter, with Western Europe dominating the developed markets index, and China, India, and South Korea representing the only three countries to account for more than 5% of the emerging markets index. South Korea generally hovers around the 5% threshold and by the end of the second quarter had exceeded it.
- Based on market values at June 30, 2015, public companies accounted for nearly 12% of the developed markets PE/VC index and 18% of the emerging markets PE/VC index.
Global ex US Developed Markets Private Equity and Venture Capital Performance Insights
- During the second quarter, all but one vintage year from 2000 through 2014 posted positive returns (a reversal of the prior quarter); the exception was 2014, which is not surprising given the “age” of the vintage. The seven vintages that represented more than 5% of the index accounted for 85% of the benchmark’s value. The range of returns among the seven “meaningfully sized” vintages was 5.2% to 9.6%, with the 2012 vintage earning the quarter’s lowest return, and 2007 the highest (Table 2). Write-ups in health care, financial services, IT, and energy accounted for almost all of the valuation increases in the 2012 vintage year. In the 2007 funds, the strong return for the quarter was driven mostly by write-ups in consumer, IT, manufacturing, and financial services companies.
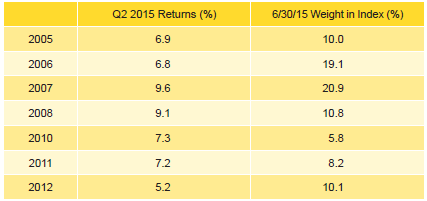
Table 2. Global ex US Developed Markets PE/VC Index Vintage Year Returns: Net Fund-Level Performance
Notes: Returns in US$ terms. Vintage year fund-level returns are net of fees, expenses, and carried interest.
- Developed markets private equity and venture capital funds called $6.6 billion from investors during the quarter, a slight increase (3%) from the prior quarter. Distributions totaled $16.9 billion, which represented just 5% more than the previous quarter’s total. Distributions have outpaced contributions for ten consecutive quarters, and 12 of the last 13.
- Managers of funds raised in 2011–13 called $4.7 billion, or 72% of the total capital called during the quarter. All three vintage years called more than $1.0 billion each. Each of the vintage years 2004 –08 and 2010 distributed more than $1.2 billion, with the 2006 vintage leading the way with $5.4 billion of distributions. Combined, these six vintage years accounted for 84% of the total capital distributed in the quarter.
All seven meaningfully sized sectors earned positive returns for the quarter (Table 3). Among the key sectors, IT and financial services virtually tied for the highest return (13.2%); media was the lowest, although at 8.5% for the quarter it was strong in absolute terms. Industrial and energy businesses produced lower returns (3.8% and 4.0%, respectively), but neither represented more than 5% of the index during the quarter. The 2007, 2008, and 2010 vintages were the three largest contributors to the write-ups in the IT sector. The 2008, 2007, and 2006 vintages (in rank order) were the biggest positive drivers of the financial services return, while the media sector return was driven mainly by vintage years 2006 and 2007. The four largest sectors—consumer, health care, IT, and financial services—represented nearly 60% of the index’s value and on a dollar-weighted basis returned 10.7%, outperforming the index’s total gross return of 9.5%.

Table 3. Global ex US Developed Markets PE/VC Index Sector Returns: Gross Company-Level Performance
Percent (%)
Note: Industry-specific gross company-level returns are before fees, expenses, and carried interest.
- The consumer, financial services, and manufacturing sectors attracted the most capital during the quarter, about 64% of the capital invested. Since the inception of the index (1986), these three sectors garnered about 46% of the capital; financial services deviated the most from the long-term norms, accounting for most of the difference between investments during the quarter and over the longer time horizon.
- All five countries representing the bulk of the index earned positive returns during the second quarter (Table 4). Companies in the United Kingdom and France produced the best results for the quarter while those in the United States earned the lowest among the top five countries. The US companies benefited least from the stabilizing euro. With one exception, the continental European countries enjoyed double-digit gains—Germany, at 9.6%, fell just shy of that milestone.

Table 4. Global ex US Developed Markets PE/VC Index Regional Returns: Gross Company-Level Performance
Percent (%)
Note: Geographic region–specific gross company-level returns are before fees, expenses, and carried interest.
- Companies in the United States, Germany, the United Kingdom, and Australia attracted 54% of the capital invested during the quarter, about 3% more than the long-term norm for the various countries; the United States and Australia garnered significantly more than their historical norms, and the reverse was true for the United Kingdom.
Emerging Markets Private Equity Performance Insights
- By the end of the second quarter there were seven key vintage years, 2005–11, that together accounted for 87% of the emerging markets index; all vintages from 2004 on earned positive returns for the quarter (Table 5). Among the large vintages, similar to the prior quarter, funds raised in 2011 posted the quarter’s highest return. The 2012 vintage almost made the cut with an index weight of 4.9% and a second quarter return of 4.2%.
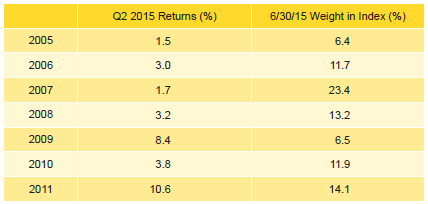
Table 5. Emerging Markets PE/VC Index Vintage Year Returns: Net Fund-Level Performance
Notes: Returns in US$ terms. Vintage year fund-level returns are net of fees, expenses, and carried interest.
- Significant write-ups in consumer and manufacturing were the main drivers in many of the vintage years and, overall, represented 43% of the index’s total net appreciation. IT write-ups also helped lift the 2008–09 and 2011 vintage returns, but had an adverse effect for 2010 vintage funds. In addition to those three sectors, health care and software boosted the 2011 vintage return. By the end of the quarter, 2007 was the largest vintage year and experienced significant write-downs in the energy sector. The 2005 vintage earned the lowest quarterly return out of the key seven vintage years, due to write-downs in financial services and media that nearly offset write-ups in manufacturing and software.
- During second quarter 2015, emerging markets private equity and venture capital funds called $3.7 billion from investors, a 10% increase from the prior quarter. Capital call activity during the first half of 2015 was 27% slower than it was in the first half of last year. Distributions totaled $6.5 billion, representing a 49% jump from the previous quarter’s total. Distributions during the first six months of 2015 were about 5% lower than the same period in 2014, which was a record year for contributions and distributions. Since the inception of the index in 1986, quarterly distributions outpaced contributions in only 11% of the quarters, and based on the ratio of distributions to capital calls, second quarter 2015 ranked third all-time.
- Managers of funds raised from 2010 through 2014 called $3.2 billion, or 86% of the total for the quarter; all five vintages called more than $500 million, led by the 2011 funds that called nearly $900 million. On the distributions front, managers of funds raised in 2006 and 2007 distributed $4.3 billion, or 67% of the total. The 2007 funds alone distributed almost $3 billion.
- All six of the meaningfully sized sectors posted positive quarterly returns (Table 6). Manufacturing earned the best return at 9.6%, while financial services earned the lowest return at 1.9%. Strong write-ups in manufacturing were led by 2011 funds, with 2006 following closely behind. Valuation increases for financial services companies in the 2007 funds were completely offset by the write-downs in the 2005 vintage year fund investments.
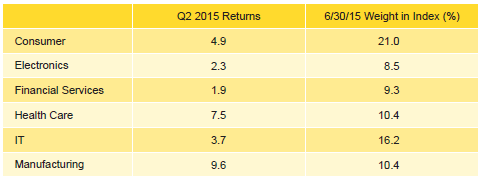
Table 6. Emerging Markets PE/VC Index Sector Returns: Gross Company-Level Performance
Notes: Returns in US$ terms. Industry-specific gross company-level returns are before fees, expenses, and carried interest.
- On a gross, dollar-weighted basis, the six largest sectors by market value returned 5.0% during the quarter, slightly outperforming the 4.7% return for all companies.
- Consumer, health care, and IT companies garnered about 68% of the capital invested during the quarter, with IT businesses alone attracting 29%. There was an increase in investment activity after the fairly slow first quarter, as the amount of capital invested jumped 45%. Over the long term, managers in the emerging markets index have allocated over 70% of their capital to six sectors: consumer, manufacturing, IT, financial services, health care, and media.
- Historically the index has been concentrated in China and India, but South Korea has hovered near the value threshold of 5%, and recently surpassed it by representing 5.2% of the index’s ending value in the second quarter (Table 7). China and India still accounted for approximately 54% of the index. Four countries— Singapore, the United States, Brazil, and Japan—each represented at least 2.5% of the index. China-based companies continued to receive and return more capital than any other country, 46% and 54% of the index, respectively. Write-ups for Chinese companies continued to be strong, mainly driven by funds raised in 2011.
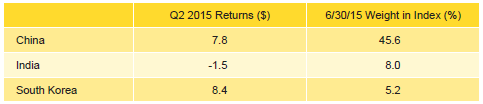
Table 7. Emerging Markets PE/VC Index Regional Returns: Gross Company-Level Performance
Notes: Returns in US$ terms. Geographic region–specific gross company-level returns are before fees, expenses, and carried interest.
- On a gross, dollar-weighted basis, the three largest countries combined returned 6.5%, with South Korea coming in strong as the top returner of the quarter.
About the Indexes
Cambridge Associates derives its Global ex US Developed Markets Private Equity and Venture Capital Index from the financial information contained in its proprietary database of global ex US private equity and venture capital funds. As of June 30, 2015, the database comprised 765 global ex US developed markets private equity and venture capital funds formed from 1986 to 2015 with a value of about $256 billion. Ten years ago, as of June 30, 2005, the benchmark index included 374 global ex US developed markets funds, whose value was roughly $80 billion.
Cambridge Associates derives its Emerging Markets Private Equity and Venture Capital Index from the financial information contained in its proprietary database of global ex US private equity and venture capital funds. As of June 30, 2015, the database comprised 553 emerging markets funds formed from 1986 to 2014 with a value of $159 billion. Ten years ago, as of June 30, 2005, the benchmark index included 216 emerging markets funds, whose value was $14 billion.
The pooled returns represent the net periodic rates of return calculated on the aggregate of all cash flows and market values as reported to Cambridge Associates by the funds’ general partners in their quarterly and annual audited financial reports. These returns are net of management fees, expenses, and performance fees that take the form of a carried interest.