Overview
The Cambridge Associates LLC Global ex US Developed Markets Private Equity and Venture Capital (PE/VC) Index returned 2.0% in USD terms in fourth quarter 2015, bringing its return for the year to 5.7%, a small improvement over 2014. The Cambridge Associates LLC Emerging Markets PE/VC Index returned 5.1% in fourth quarter and 8.5% for the year, a drop of more than 5 percentage points from its 2014 return. In 2015, the private developed and emerging markets had mixed results when compared to their public markets counterparts but over the long term, private benchmarks have outperformed the public indexes handily. For the second year in a row, the euro weakened, once again hampering the developed markets index return when measured in US dollars (Table 1). Other factors that influenced European buyouts were high entry valuations and strong exit environments, with the value of private equity–backed initial public offerings (IPOs) hitting a historic high. The Asian exit environment was also strong, with merger & acquisition (M&A) activity outpacing all other years and IPOs reaching the highest level since 2010.
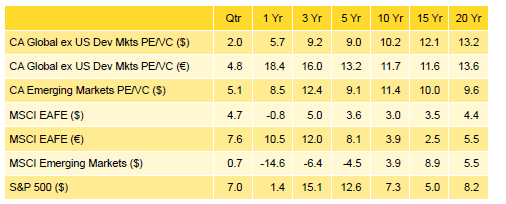
Table 1. Returns for the Global ex US Developed and Emerging Markets PE/VC Indexes vs Public Counterparts
Periods Ended December 30, 2015 • Percent (%)
Sources: Cambridge Associates LLC, MSCI Inc., Standard & Poor’s, and Thomson Reuters Datastream. MSCI data provided “as is” without any express or implied warranties.
Notes: Private indexes are pooled horizon internal rates of return, net of fees, expenses, and carried interest. Public indexes are average annual compound returns (time-weighted returns). The CA global ex US developed markets index includes private equity and venture capital funds that invest primarily in Australia, Canada, Israel, Japan, New Zealand, Singapore, and developed markets in Western Europe. The CA emerging markets index includes private equity and venture capital funds that invest primarily in Africa, emerging Asia, emerging Europe, Latin America & Caribbean, and the Middle East ex Israel. Because the indexes are capital weighted, performance is mainly driven by the largest vintage years. The PE/VC indexes’ returns are based on limited partners’ fund-level performance; the returns are net of fees, expenses, and carried interest.
Performance for the Cambridge Associates LLC Global ex US Developed and Emerging Markets PE/VC indexes is derived from data compiled from institutional quality funds raised between 1986 and 2015. There are almost 800 funds in the developed markets index and more than 560 in the emerging markets index. Funds in the global ex US developed markets PE/VC index primarily invest in companies in Europe, but occasionally make investments in US companies as well.
Fourth Quarter and Calendar Year 2015 Highlights
- With the exception of the most recent quarter, the developed markets PE/VC index outperformed its public equity counterpart (MSCI EAFE) in all trailing time periods listed in Table 1. The emerging markets index bested its comparable public benchmark (MSCI EM) in all of the time horizons in the table.
- Based on market values on December 31, 2015, public companies accounted for more than 11% of the developed markets PE/VC index and almost 18% of the emerging markets PE/VC index.
Global ex US Developed Markets Private Equity and Venture Capital Performance Insights
The Cambridge Associates LLC Global ex US Developed Markets PE/VC Index returned 2.0% in fourth quarter 2015, bringing its return for the year to 5.7%, about a 200 basis point (bp) improvement over its performance in 2014. Returns across the eight meaningfully sized (5% or more of the index value) vintage years in the index (2005 through 2008 and 2010 through 2013) ranged from -1.9% to 4.6% during the fourth quarter; for the year, they ranged from -0.8% to 12.4% (Table 2). These eight years represented roughly 91% of the benchmark’s value; 51% of the index’s value resided in the three largest vintages, 2006, 2007, and 2012. While a variety of smaller vintages suffered losses in the quarter and year, the 2005 vintage not only was the worst performing among the meaningfully sized vintage years, but also was the only one to earn a negative return in either time period. The 2010 and 2007 vintages were the best performing for the quarter and year, respectively.
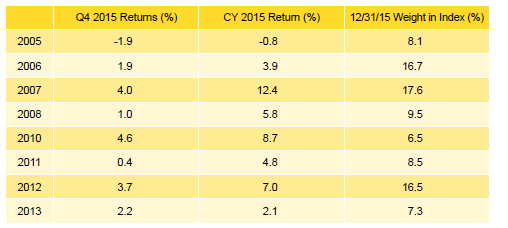
Table 2. Global ex US Developed Markets PE/VC Index Vintage Year Returns: Net Fund-Level Performance
Notes: Returns in USD terms. Vintage year fund-level returns are net of fees, expenses, and carried interest.
A mix of sectors contributed to the results for the best- and worst-performing large vintage years. For the quarter’s best vintage year, 2010, write-ups were most significant for consumer companies and losses were minimal across the other sectors, whereas in the 2005 vintage, the quarter’s lowest performer, gains in consumer were more than offset by write-downs in energy and health care. For the year, the 2007 vintage enjoyed healthy write-ups in many sectors, led by IT, and only suffered significant write-downs in energy. In the 2005 vintage, gains in consumer, financial services, and health care were nearly completely offset by losses in energy, industrials, and IT.
All Seven Key Sectors Posted Positive Returns for the Quarter and Year. Fourth quarter returns were positive, albeit only modestly for some, across the index’s seven meaningfully sized sectors. Energy, which continued to decline as a percentage of the index, representing only 4.3% at year end, was down 8.7% in the quarter. The four largest sectors—consumer, health care, IT, and financial services—represented more than 57% of the index’s total value and on a dollar-weighted basis gained 2.6%, trailing the benchmark’s total gross return by 41 bps.
Among the meaningfully sized sectors, media turned in the best performance for the quarter with a 12.6% return (Table 3). The vintage years that contributed most to the media sector’s return were 2004 and 2006. Consumer lagged the group with a return of 0.8%; write-downs were greatest in the 2008 vintage and write-ups were largest in 2005 and 2010. Energy companies were written down in all vintages from 2002 through 2015 in the fourth quarter.
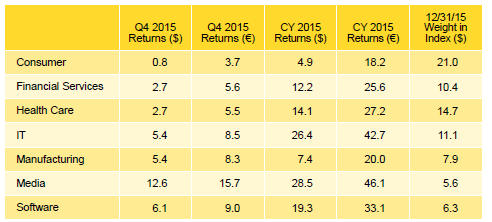
Table 3. Global ex US Developed Markets PE/VC Index Sector Returns: Gross Company-Level Performance
Percent (%)
Note: Industry-specific gross company-level returns are before fees, expenses, and carried interest.
For the year, returns among the meaningfully sized sectors ranged from 4.9% (consumer) to 28.5% (media) but again, had energy (at 4.3% of the index) been included in that range, the lowest return for the year would have been -18.8%. It was the second year in a row that media turned in the best performance. On a dollar-weighted basis, the four largest sectors returned 12.4% for the year, outperforming the total gross benchmark by 185 bps. IT was the best performer among the largest four sectors.
Portfolio Companies Based in Sweden Led in the Fourth Quarter; UK Companies Performed Best for the Year; US Companies Struggled. Fourth quarter returns for the five meaningfully sized geographic regions ranged from the United States’ 1.2% to Sweden’s 7.9% (Table 4). Five countries—the United Kingdom, the United States, Germany, France, and Sweden (in rank order)—accounted for 65% of the index’s value. Most of the portfolio companies in the index are located in Western Europe, but because some of the larger funds in the index invest in businesses based in the United States, the United States is the second largest region in the index. Three other countries, the Netherlands, Italy, and Denmark, each represented more than 3% of the index.

Table 4. Global ex US Developed Markets PE/VC Index Regional Returns: Gross Company-Level Performance
Percent (%)
Note: Geographic region–specific gross company-level returns are before fees, expenses, and carried interest.
For the sixth year in a row, all of the meaningfully sized geographic regions produced positive annual returns; smaller country constituents in the index, such as Spain, Canada, and Japan, earned negative returns for the year. The United States was the worst-performing country among the large regional components of the index. As seen in Table 4, when calculated in euros, returns for the European companies were much better than those in US dollars, illustrating the downward pressure a strong US dollar puts on performance when calculated in that currency.
During the fourth quarter, across the index, company-level valuations rose by more than $6.4 billion, driven mostly by write-ups in UK and Swedish companies and write-downs in Spanish and Japanese companies. For the year, valuation increases were dominated by companies based in developed Europe and decreases were concentrated in Canada. Vintage years 2006 through 2008 and 2012 all saw values for developed European companies rise by more than $2.0 billion. Vintage year 2008 was the largest contributor to the write-downs in Canadian businesses.
Distributions Continued to Outpace Contributions. In the fourth quarter, managers in the global ex US developed markets index called $9.0 billion from limited partners (LPs) and returned $20.3 billion, the second highest amount distributed during a quarter since the inception of the index. Capital calls increased by $961 million, or 12.0%, from the third quarter, while distributions climbed $5.3 billion, or 35.1%. Investors in funds launched in 2012 and 2013 contributed $6.6 billion (or 73% of the total called). On the other hand, investors in funds launched in 2005 through 2008, 2010, and 2012 all received more than $1 billion of distributions during the quarter for a total of $17.0 billion or 84% of the total. Vintage year 2007 LPs received nearly $8 billion. For the seventh quarter in a row, and the 17th out of the past 20, distributions outpaced contributions.
For the year, contributions and distributions moved in different directions when compared with the previous year. Contributions were down 24.4% and distributions were up 5.0% from levels reached in 2014. With record distributions of more than $69 billion, 2015 was the fifth consecutive year that distributions outnumbered contributions (Figure 1).

Figure 1. Contributions & Distributions for the Global ex US Dev Mkts PE/VC Index
2005–15 • US Dollar (billions)
Two sectors, consumer and financial services, were the main focus of fund managers in the developed markets index in the fourth quarter; the two sectors together represented 38% of total investments, about 4% lower than their combined long-term norm. Other sectors, including health care, IT, and energy also garnered significant capital. For the year, three sectors—consumer, health care, and financial services (in rank order)—received almost half of the invested capital, and each attracted more than $3 billion of investments.
Just under 50% of the capital invested in the year by fund managers in the developed markets index went to companies in France, Germany, the United Kingdom, and the United States. The percentage is about 7% lower than what has been invested in these four countries since inception of the index. US-based businesses attracted almost 16% of the money invested, roughly 4% more than over the long term.
Emerging Markets Private Equity Performance Insights
The Cambridge Associates LLC Emerging Markets PE/VC Index posted a 5.1% gain in fourth quarter 2015. The seven largest vintage years, 2006 through 2012, represented 85% of the index’s ending value and returned from 1.1% to 9.8% for the fourth quarter (Table 5). Three of the seven largest vintage years outperformed the index (2010, 2011, and 2012). The fourth quarter saw the 2005 vintage drop below the 5% threshold, replaced in the top-sized group by the 2012 vintage. The strongest performance for the quarter was recorded by the 2011 vintage with a 9.8% return. Performance was driven by write-ups in the vintage’s largest sectors, consumer and IT.
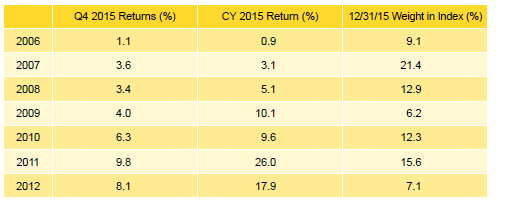
Table 5. Emerging Markets PE/VC Index Vintage Year Returns: Net Fund-Level Performance
Notes: Returns in USD terms. Vintage year fund-level returns are net of fees, expenses, and carried interest.
For the year, the Emerging Markets PE/VC Index returned 8.5%. Of the seven top-sized vintage years, only three, 2009, 2011, and 2012, earned double-digit returns. One of the large vintages, 2006, struggled and earned a 0.9% return. The 2011 vintage led the index in both returns and net appreciation, posting a 26.0% return and adding $5.5 billion in value for the year. Valuations were up across all sectors in the 2011 vintage, led by write-ups in IT and health care. At the other side of the performance spectrum, vintage year 2006, moderate gains in manufacturing and consumer were offset by losses in IT and construction. The index’s largest vintage year, 2007, saw big gains in media, IT, and consumer partially offset by hefty write-downs in energy.
Monumental Media! Returns for Fourth Quarter’s Top-Performing Sector Were Head and Shoulders Above Peers. The dollar-weighted gross returns for the index were 5.9% in fourth quarter and 10.4% for the year. By the end of the year, media, thanks to its eye-popping 30% fourth quarter return, joined the group of meaningfully sized sectors that also included consumer, electronics, financial services, health care, IT, and manufacturing (Table 6). The seven largest sectors comprised nearly 82% of the index and returned 6.8% for the quarter and 13.4% for the year. All seven produced positive returns in both the fourth quarter and the year. The energy sector continued its downward slide in both sizing and performance. Energy made up only 2.9% of the index on December 31, 2015, after returning -0.3% for the quarter and -21.6% for the year.
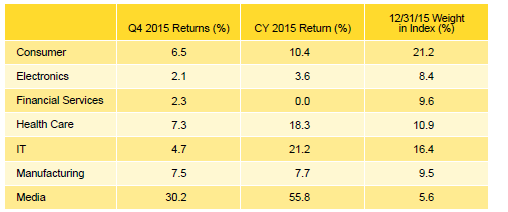
Table 6. Emerging Markets PE/VC Index Sector Returns: Gross Company-Level Performance
Notes: Returns in USD terms. Industry-specific gross company-level returns are before fees, expenses, and carried interest.
China-Based Companies Continued to Dominate Emerging Markets. The Emerging Markets PE/VC Index continued to be concentrated by geography, with only three meaningfully sized countries—China, India, and South Korea—that together represented 62% of the index’s value on December 31, 2015 (Table 7). The combined dollar-weighted gross return for the countries was 8.3% in fourth quarter, outperforming the benchmark’s total gross return by 250 bps. Notably, the United States held the fourth highest weight in the emerging markets index, representing 3.1% at the end of 2015. Similar to the funds in the developed markets benchmark, some funds in the emerging markets benchmark invest in companies based in the United States. China-based companies continued to receive and return more capital than any other region during the fourth quarter, with $1.5 billion invested and $1.4 billion realized; the amount invested in Chinese companies was roughly three times what was invested in businesses in the next largest country, India. Fourth quarter write-ups for Chinese companies were driven mainly by funds raised in 2007, 2011, and 2012.

Table 7. Emerging Markets PE/VC Index Regional Returns: Gross Company-Level Performance
Notes: Returns in USD terms. Geographic region–specific gross company-level returns are before fees, expenses, and carried interest.
China generated a return of 21.4% for the year, which outpaced the index’s gross return by a sizeable 1,100 bps. The strong performance of China-based companies was attributed to vintage years 2007, 2008, and 2010–12, which in total represented 82% of the write-ups for the year. In all five of these vintages, write-ups for Chinese companies equaled more than $1 billion. Consumer, financial services, health care, IT, manufacturing, and media were the sectors with the largest mark-ups for both the quarter and the year. While India was essentially flat for the fourth quarter, performance for the year was 8.0%. For India-based companies, 71% of the write-ups in 2015 were from investments made by 2007 and 2011 vintage funds. Valuations for consumer, health care, and IT companies were written up over the year, while financial services and manufacturing were written down. South Korea was buoyed by mark-ups in its three largest vintages by value—2010, 2012, and 2013—but write-downs in 2005 and 2007 vintages partially offset those gains. Media was by far the strongest performing sector in South Korea.
Contributions and Distributions Receded From 2014 Highs. In the fourth quarter, emerging markets PE/VC managers called $4.4 billion from limited partners and distributed $5.7 billion, the fourth-largest quarterly distribution in the history of the index. Funds raised in 2006, 2007, and 2010 accounted for 63% of the fourth quarter distributions. Managers of 2010 and 2012 vintage year funds called the most capital from investors during the quarter, over $1.0 billion each, and were closely followed by 2014 vintage funds. These three vintage years represented 70% of the capital contributed in the fourth quarter.
In 2015, capital calls and distributions by emerging markets managers fell below 2014’s record levels. Contributions equaled $16.1 billion and distributions totaled $21.7 billion, decreases of 21% and 6% from 2014, respectively (Figure 2). Distributions outpaced contributions for the second year in a row.

Figure 2. Contributions & Distributions for the Emerging Markets PE/VC Index
2005–15 • US Dollar (billions)
About the Cambridge Associates LLC Indexes
Cambridge Associates derives its Global ex US Developed Markets Private Equity and Venture Capital Index from the financial information contained in its proprietary database of global ex US private equity and venture capital funds. As of December 31, 2015, the database comprised 790 global ex US developed markets private equity and venture capital funds formed from 1986 to 2015 with a value of about $253 billion. Ten years ago, as of December 31, 2005, the benchmark index included 408 global ex US developed markets funds, whose value was roughly $90 billion.
Cambridge Associates derives its Emerging Markets Private Equity and Venture Capital Index from the financial information contained in its proprietary database of global ex US private equity and venture capital funds. As of December 31, 2015, the database comprised 565 emerging markets funds formed from 1986 to 2015 with a value of about $158 billion. Ten years ago, as of December 31, 2005, the benchmark index included 243 emerging markets funds, whose value was nearly $17 billion.
The pooled returns represent the net end-to-end rates of return calculated on the aggregate of all cash flows and market values as reported to Cambridge Associates by the funds’ general partners in their quarterly and annual audited financial reports. These returns are net of management fees, expenses, and performance fees that take the form of a carried interest.
About the Public Indexes
The MSCI EAFE Index is a free float-adjusted market capitalization–weighted index that is designed to measure large- and mid-cap equity performance of developed markets, excluding Canada and the United States. As of February 2016 the MSCI EAFE Index consisted of the following 21 developed markets country indexes: Australia, Austria, Belgium, Denmark, Finland, France, Germany, Hong Kong, Ireland, Israel, Italy, Japan, the Netherlands, New Zealand, Norway, Portugal, Singapore, Spain, Sweden, Switzerland, and the United Kingdom.
The MSCI Emerging Markets Index is a free float-adjusted market capitalization–weighted index that is designed to measure large- and mid-cap equity performance of emerging markets. As of February 2016, the MSCI Emerging Markets Index includes 23 emerging markets country indexes: Brazil, Chile, China, Colombia, Czech Republic, Egypt, Greece, Hungary, India, Indonesia, Korea, Malaysia, Mexico, Peru, the Philippines, Poland, Russia, Qatar, South Africa, Taiwan, Thailand, Turkey, and the United Arab Emirates.
The Standard & Poor’s 500 Composite Stock Price Index is a capitalization-weighted index of 500 stocks intended to be a representative sample of leading companies in leading industries within the US economy. Stocks in the index are chosen for market size, liquidity, and industry group representation.