Overview
The Cambridge Associates LLC Global ex US Developed Markets Private Equity and Venture Capital (PE/VC) Index® was virtually flat (0.1%) in US$ terms in fourth quarter 2014, bringing its return for the year to 3.5%, which was a sharp drop from the prior year. The Cambridge Associates LLC Emerging Markets PE/VC Index® returned 4.5% for the fourth quarter and 14.3% for the year, almost equaling its 2013 results. Both the global ex US developed and emerging markets PE/VC indexes outperformed public market counterparts in fourth quarter and year-end 2014.
The euro weakened considerably over the course of 2014, hampering the developed markets index return when measured in US$ terms (Table 1). Other factors that influenced European buyouts were high entry valuations and strong exit environments, with the value of PE-backed initial public offerings (IPOs) hitting a historic high. The Asian exit environment was also strong, with mergers & acquisitions (M&A) activity outpacing all other years and IPOs reaching the highest level since 2010.
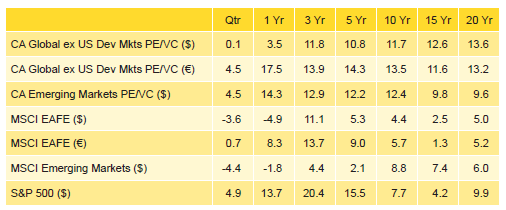
Table 1. Returns for the Global ex US Developed and Emerging Markets PE/VC Indexes vs Public Counterparts
Percent (%)
Sources: Cambridge Associates LLC, MSCI Inc., Standard & Poor’s, and Thomson Reuters Datastream. MSCI data provided “as is” without any express or implied warranties.
Notes: The global ex US developed markets index includes private equity and venture capital funds that invest primarily in developed markets in Australia, Canada, Israel, Japan, New Zealand, Singapore, and Western Europe. The emerging markets index includes private equity and venture capital funds that invest primarily in Africa, emerging Asia, emerging Europe, Latin America & Caribbean, and the Middle East ex Israel. Because the indexes are capital weighted, performance is mainly driven by the largest vintage years. The PE/VC indexes’ returns are based on limited partners’ fund-level performance; the returns are net of fees, expenses, and carried interest.
Performance for the Cambridge Associates LLC Global ex US Developed and Emerging Markets PE/VC indexes is derived from data compiled from institutional quality funds raised between 1986 and 2014. There are almost 750 funds in the developed markets index and about 550 in the emerging markets index. Funds in the global ex US developed market PE/VC index primarily invest in companies in Europe but occasionally make investments in US companies as well.
This commentary reviews the indexes’ performance. Highlights of the fourth quarter and year are:
- In the 20 years ending in 2014, both the developed and emerging markets PE/VC indexes outperformed the comparable public equity indexes (MSCI EAFE and MSCI EM) in all trailing time periods shown in Table 1.
- Based on market values at December 31, 2014, public companies accounted for about 13% of the developed markets PE/VC index, about a 4% drop from the end of 2013. The emerging markets PE/VC index had a lower exposure to public companies than it did at the end of 2013, 20.5% versus 22.4%.
Global ex US Developed Markets Private Equity and Venture Capital Performance Insights
The Cambridge Associates LLC Global ex US Developed Markets PE/VC Index returned 0.1% in fourth quarter 2014, bringing its return for the year to 3.5%, a drop of nearly 13.5% from its performance in 2013. Returns across the six meaningfully sized (5% or more of the index value) vintage years in the index (2005 through 2008, 2011, and 2012) ranged from -1.2% to 1.1% during the fourth quarter; for the year, they ranged from -0.9% to 7.6% (Table 2). These six years represented roughly 81% of the benchmark’s value; almost 44% of the index’s value resided in the two largest vintages, 2006 and 2007, down from more than 50% at the end of last year. For the second year in a row, the 2005 vintage was the only meaningfully sized group that underperformed the index in both fourth quarter and year-end 2014 (and it also had the lowest year-end return); the 2011 and 2006 vintage years were the worst- and best-performing in the quarter, respectively, and the 2008 vintage outperformed all others for the year.
A mix of sectors contributed to the results for the best- and worst- performing large vintage years. For the quarter’s best vintage year, 2006, write-ups in health care and materials were partially offset by losses in energy and consumer, whereas in the 2011 vintage, the quarter’s lowest performer, gains and losses were all fairly modest. For the year, consumer, financial services, IT, and electronics (in rank order) were the key drivers of vintage year 2008’s results. In the 2005 vintage, the only sector with healthy write-ups was consumer, while write-downs were more prevalent, led by the energy and software companies.
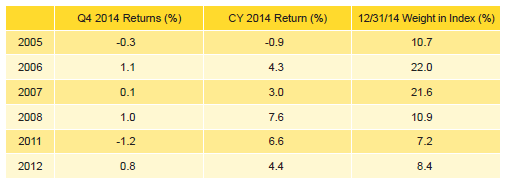
Table 2. Global ex US Developed Markets PE/VC Index Vintage Year Returns: Net Fund-Level Performance
Note: Returns in US$ terms. Vintage year fund-level returns are net of fees, expenses, and carried interest.
All Seven Key Sectors Posted Positive Returns for the Quarter and Year. Fourth quarter returns were positive, albeit marginally for some, across the index’s seven meaningfully sized sectors. Energy, which represented only 4.7% and thus not quite meaningfully sized, was down more than 8% in fourth quarter 2014. The three largest sectors—consumer, health care, and IT—represented more than 49% of the index’s total value and on a dollar-weighted basis gained 2.4%, beating the index’s return by 161 bps.
Among the meaningfully sized sectors, health care turned in the best performance for the quarter with a 3.3% return (Table 3). Most of the write-ups in media companies took place in vintage years 2006, 2011, and 2012, with 2006 leading the way. Software lagged the group with a return of 0.1%, as write-downs in 2005 outweighed write-ups in 2006 and 2012 (changes in the other vintage years were more modest). Funds in virtually all vintage years from 1998 through 2014 wrote down valuations for energy companies in fourth quarter 2014.
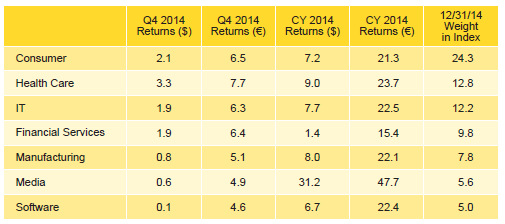
Table 3. Global ex US Developed Markets PE/VC Index Sector Returns: Gross Company-Level Performance
Percent (%)
Note: Industry-specific gross company-level returns are before fees, expenses, and carried interest.
For the year, the range of returns among the meaningfully sized sectors was quite wide, with a nearly 30 ppt difference between best and worst. Because energy fell below the 5% threshold with its strongly negative performance for the year, the financial services return of 1.4% was the lowest of the large sectors. Media turned in by far the best performance with a return of 31.2% for the year. On a dollar-weighted basis, the three largest sectors returned 7.8% for the year, outperforming the total gross benchmark by 115 bps. Health care was the best performer among the largest three sectors.
Portfolio Companies Based in the United States Performed Best for the Quarter and Year; German Companies Struggled. Fourth quarter returns for the five meaningfully sized geographic regions ranged between Germany’s -5.0% and the United States’ 5.7% (Table 4). Five countries—the United Kingdom, the United States, Germany, France, and Sweden (in rank order)—accounted for 64.3% of the index’s value. Most of the portfolio companies in the index are located in western Europe, but because some of the larger funds in the index invest in US-based businesses, the United States is the second largest region in the index. Three other countries, Australia, Italy, and Spain, each represented more than 3% of the index.
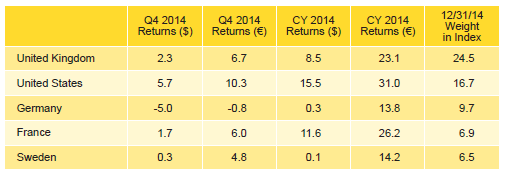
Table 4. Global ex US Developed Markets PE/VC Index Regional Returns: Gross Company-Level Performance
Percent (%)
Notes: Geographic region–specific gross company-level returns are before fees, expenses, and carried interest.
For the fifth year in a row, all of the meaningfully sized geographic regions produced positive annual returns; for the second consecutive year the United States led all others in 2014 with a return of 15.5%. Germany was the worst-performing country among the large regional components of the index. As seen in Table 4, returns calculated in euros for the European companies were much better than those calculated in US$ terms, illustrating the downward pressure a strong US dollar puts on performance when calculated in that currency.
During the fourth quarter, valuations were driven mostly by write-ups in US companies and write-downs in Canadian companies, which suffered losses due to energy price declines. For the year, valuation increases were dominated by companies based in western Europe, the United States, and developed Asia; the three regions saw write-ups that equaled 101% of the index. Losses were dominated by emerging Asia companies. Vintage years 2004 and 2006–08 accounted for the lion’s share of the increases in western European businesses. Vintage years 2006 and 2008 were responsible for more than 60% of the US-company write-ups. Losses in emerging Asia were driven most by vintages 2004 and 2006.
Distributions Continue to Outpace Contributions. In fourth quarter 2014, managers in the global ex US developed markets index called $7.2 billion from limited partners and returned $19.6 billion, the second highest amount distributed during a quarter since the inception of the index. Capital calls fell by $4.6 billion, or 38.9%, from third quarter 2014, while distributions dropped $447 million, or 2.2%. Investors in funds launched in 2011, 2012, and 2013 all contributed more than $1.0 billion during the quarter; as a group, they contributed $5.1 billion (or 72% of the total called). On the other hand, investors in funds launched in 2004 through 2008 received approximately $16.9 billion, or 86.2%, of the capital distributed. For the eighth quarter in a row, and the 14th out of the past 16, distributions outpaced contributions.
For the year, contributions and distributions were up 22.8% and 18.1%, respectively, from levels hit in 2013. With record distributions of $64 billion, 2014 was the fourth consecutive year that distributions outnumbered contributions (Figure 1).
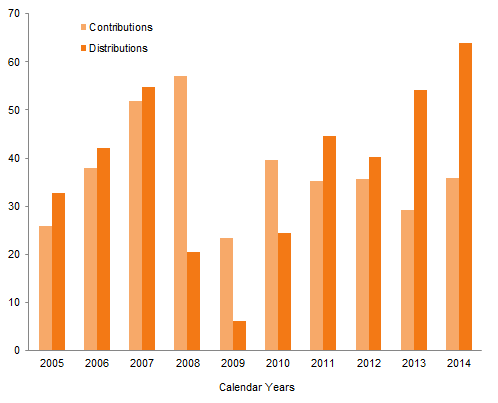
Figure 1. Contributions and Distributions for the Global ex US Dev Mkts PE/VC Index
2005–14 • US Dollar (billions)
Fund managers in the developed markets index invested most heavily in consumer, financial services, industrials, and software in fourth quarter 2014; the four sectors together represented 60% of total investments, about 20% higher than their combined long-term norm. Industrials and software garnered significantly more capital than over the long term. For the year, five sectors received 66% of the invested capital—IT, consumer, health care, financial services, and software (in rank order)—and all garnered more than $3 billion of investments.
Just under 76% of the capital invested in fourth quarter 2014 by fund managers in the developed markets index went to companies based in western Europe, about the same as the long-term norm. US-based businesses attracted almost 14% of the money invested, about 2% less than over the long term.
Emerging Markets Private Equity Performance Insights
The Cambridge Associates LLC Emerging Markets PE/VC Index posted a 4.5% gain in fourth quarter 2014. The seven largest vintage years, 2005 through 2011, represented 90% of the index’s ending value and returned from -2.5% to 20.2% for the fourth quarter (Table 5). Only two of the seven vintage years outperformed the index (2008 and 2011). The 2006 vintage year moved from the second to the third largest vintage during the quarter and was the only vintage year that generated a negative return. Performance was driven by write-downs in the vintage’s largest sectors: health care, consumer, IT, and manufacturing.
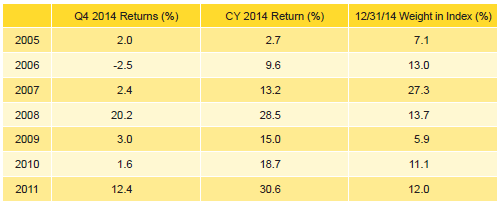
Table 5. Emerging Markets PE/VC Index Vintage Year Returns: Net Fund-Level Performance
Notes: Returns in US$ terms. Vintage year fund-level returns are net of fees, expenses, and carried interest.
For the year, the Emerging Markets PE/VC Index returned 14.3%. The three largest vintage years, 2006 through 2008, accounted for roughly 54% of the benchmark’s value and earned positive returns from 9.6% to 28.5%. The 2014 net appreciation was the highest annual gain in the index’s history at $17.4 billion, led by vintage years 2007 and 2008 with gains of over $4.2 billion each. Within the 2006 vintage, the IT sector’s significant write-ups accounted for 73% of the total gains for the vintage. Financial services and electronics were the main contributors to the 2007 vintage’s gains. The 2008 and 2011 vintages were the two best-performing vintages for the year with significant write-ups in electronics and IT, respectively.
Hello Electronics, Goodbye Energy! Electronics Becomes Best-Performing Sector and Doubles its Index Weight in the Fourth Quarter. The dollar-weighted gross returns for the index were 6.4% for the quarter and 17.7% for the year. The electronics sector’s increased valuations during the fourth quarter boosted its weight in the index to 8.5%, nearly doubling its third quarter exposure. The sector’s $5.5 billion in write-ups helped it generate the highest return. Electronics joined the other meaningfully sized sectors (at least 5% of the index value): consumer, IT, manufacturing, financial services, and health care (Table 6). The six largest sectors comprised 76% of the index and returned 8.5% for the quarter and 20.4% for the year. Honorable mentions went to the software and media sectors; each represented 4% of the index and produced positive returns for both the quarter and year. The energy sector only made up 3.8% of the index and returned -15.1% for the quarter, with write-downs concentrated in upstream and royalty investments backed by 2007, 2008, and 2010 vintage funds.
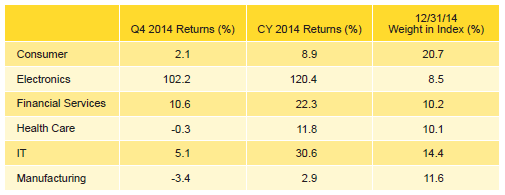
Table 6. Emerging Markets PE/VC Index Sector Returns: Gross Company-Level Performance
Notes: Returns in US$ terms. Industry-specific gross company-level returns are before fees, expenses, and carried interest.
Colossal Write-Ups for China-Based Companies Lead to Strong Returns. The Emerging Markets PE/VC Index continued to be highly concentrated, with only two meaningfully sized countries, China and India, together representing 52% of the index’s value at December 31, 2014 (Table 7). The dollar-weighted gross return for the two countries combined was 14.6% in fourth quarter 2014, outperforming the overall index by 820 bps. Three countries—South Korea, Singapore, and Australia—each represented at least 2.9% of the index at the end of 2014. The China-based companies continued to receive and return more capital than any other region during the fourth quarter, nearly five times as much capital invested and over two and a half times realized than the next closest country. Fourth quarter write-ups for Chinese companies were two times as much as the prior quarter, driven mainly by funds raised in 2007, 2008, and 2011.
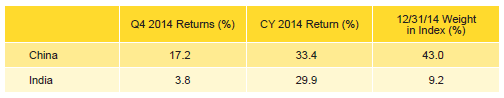
Table 7. Emerging Markets PE/VC Index Regional Returns: Gross Company-Level Performance
Notes: Returns in US$ terms. Geographic region–specific gross company-level returns are before fees, expenses, and carried interest.
China and India generated a combined return of 32.8% for the year, which outpaced the index’s gross return by a whopping 1,500 bps. The strong performance of China-based companies was attributed to vintage years 2007, 2008, and 2011, which in total represented 80% of the write-ups for the year. Electronics, IT, software, and financial services were the key sectors with the largest mark-ups for both the quarter and the year. For India-based companies, 50% of the write-ups in 2014 were from investments made by 2007 vintage funds. IT, financial services, and health care all saw significant write-ups and represented 72% of the total for the year.
2014 was a Record Breaking Year for Contributions and Distributions. In fourth quarter 2014, emerging markets PE/VC managers called $4.8 billion from limited partners and distributed $5.8 billion. It was the third largest quarterly distribution in the history of the index, falling behind second quarter 2014 and second quarter 2013. Nearly 56% of the fourth quarter distributions came from funds raised in 2005 and 2007. Managers of 2013 vintage year funds called the most capital from investors during the quarter, over $1.0 billion, and were closely followed by 2011 vintage funds. These two vintage years represented 40% of the capital contributed in fourth quarter 2014.
During 2014, capital calls and distributions by emerging markets managers topped the charts for the highest level of cash flow activity within a calendar year since the beginning of the index. Contributions equaled $18.3 billion and distributions totaled $21.2 billion, an increase of 19% and 37%, respectively, from 2013 (Figure 2). Distributions outpaced contributions for the second year in a row.
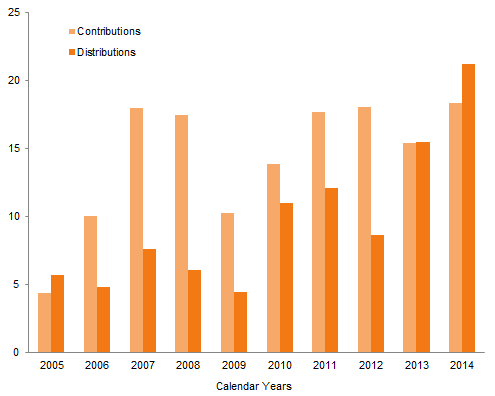
Figure 2. Contributions and Distributions for the Emerging Markets PE/VC Index
2005–14 • US Dollar (billions)
About the Indexes
Cambridge Associates derives its Global ex US Developed Markets Private Equity and Venture Capital Index® from the financial information contained in its proprietary database of global ex US private equity and venture capital funds. As of December 31, 2014, the database comprised 744 global ex US developed markets private equity and venture capital funds formed from 1986 to 2014 with a value of about $262 billion. Ten years ago, as of December 31, 2004, the benchmark index included 348 global ex US developed markets funds, whose value was roughly $78 billion.
Cambridge Associates derives its Emerging Markets Private Equity and Venture Capital Index® from the financial information contained in its proprietary database of global ex US private equity and venture capital funds. As of December 31, 2014, the database comprised 552 emerging markets funds formed from 1986 to 2014 with a value of about $149 billion. Ten years ago, as of December 31, 2004, the benchmark index included 205 emerging markets funds, whose value was more than $15 billion.
The pooled returns represent the net periodic rates of return calculated on the aggregate of all cash flows and market values as reported to Cambridge Associates by the funds’ general partners in their quarterly and annual audited financial reports. These returns are net of management fees, expenses, and performance fees that take the form of a carried interest.