Overview
During first quarter 2016, in USD terms, the Cambridge Associates LLC Global ex US Developed Markets Private Equity and Venture Capital Index returned 4.5% and the Cambridge Associates Emerging Markets Private Equity and Venture Capital Index returned 0.2%. The euro strengthened a bit from the end of 2015 to the end of the first quarter, helping to boost returns measured in US dollars. Non-US public indexes tracking companies in developed markets generally suffered losses, while those in emerging markets produced strong returns in the first quarter.
Table 1 shows private equity and venture capital returns based on the performance data collected versus indexes tracking developed, emerging, and US public equities—the MSCI EAFE, the MSCI EM, and the S&P 500. Beginning this quarter, public market index returns are shown as both traditional time-weighted returns and dollar-weighted returns, as measured by the Cambridge Associates modified public market equivalent (mPME). The mPME calculation is a private-to-public comparison that seeks to replicate private investment performance under public market conditions. Over any one quarter, an mPME and time-weighted return will match, but they will begin to diverge over longer time horizons because the mPME calculation takes into account the size and timing of cash flows. While mPME is by no means a perfect metric, it provides a better picture of relative public to private performance than a traditional time-weighted return.

Table 1. Returns for the Global ex US Developed and Emerging Markets PE/VC Indexes vs Public Counterparts
Periods Ended March 31, 2016 • Percent (%)
Sources: Cambridge Associates LLC, MSCI Inc., Standard & Poor’s, and Thomson Reuters Datastream. MSCI data provided “as is” without any express or implied warranties.
Notes: The PE/VC indexes are pooled horizon internal rates of return and are based on limited partners’ fund-level performance; the returns are net of fees, expenses, and carried interest. Because the indexes are capital weighted, performance is mainly driven by the largest vintage years. Public index returns are shown as both time-weighted returns (average annual compound returns) and dollar-weighted returns (modified public market equivalent). The CA mPME replicates private investment performance under public market conditions. The public index’s shares are purchased and sold according to the private fund cash flow schedule, with distributions calculated in the same proportion as the private fund, and mPME net asset value is a function of mPME cash flows and public index returns.
*Returns for the MSCI Emerging Markets Index begin 1/1/1988; to match the 1986 inception of the Emerging Markets PE/VC Index, price returns from Global Financial Data are used for the period 1/1/1986 to 12/31/1987.
First Quarter 2016 Highlights
- The developed markets PE/VC index has enjoyed success against the comparable public equity index (MSCI EAFE) based on mPME returns for the various time periods ending March 31, 2016, listed in Table 1. In all periods, the index bested the EAFE by at least 550 basis points (bps).
- The emerging markets PE/VC index bested its corresponding public market benchmark (MSCI Emerging Markets Index) in mPME terms in all periods except first quarter 2016. Outperformance in the one-, three-, five-, and ten-year periods was particularly strong.
- Geographically, the two indexes remained stable during the quarter, with Western Europe dominating the developed markets index and China and India representing the only two countries to account for more than 5% of the emerging markets index. While no other individual country represented more than 5% of the index, South Korea was close to that threshold, and the Latin American region (with Brazil being the largest country) accounted for almost 5%.
- Based on market values at March 31, 2016, public companies accounted for about 11% of the developed markets PE/VC index and almost 16% of the emerging markets PE/VC index.
Global ex US Developed Markets Private Equity and Venture Capital Performance Insights
- During first quarter 2016, all vintage years in the index (from 1994 through 2015) posted positive returns. The eight vintages that represented more than 5% of the index accounted for 91% of the benchmark’s value (Table 2). The range of returns among the eight “meaningfully sized” vintages was 1.5% to 7.5%, with the 2005 vintage earning the quarter’s lowest return and 2012 the highest. Write-ups, led by the consumer sector, were widespread but modest in the 2005 vintage. In the 2012 funds, three sectors—financial services, consumer, and energy (in rank order)—were the main contributors to write-ups, while health care dominated the write-downs. For the second largest vintage, 2007, five sectors made up about 80% of the net write-ups for the quarter (construction, consumer, health care, manufacturing, and software).
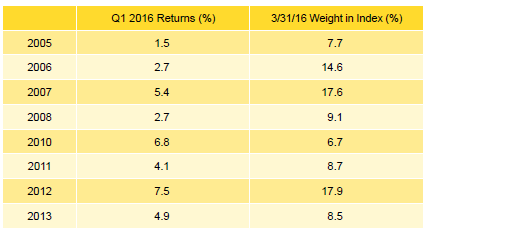
Table 2. Global ex US Developed Markets PE/VC Index Vintage Year Returns: Net Fund-Level Performance
Notes: Returns in USD terms. Vintage year fund-level returns are net of fees, expenses, and carried interest.
- Limited partner contributions and distributions were lower in first quarter than they were in fourth quarter 2015. Developed markets private equity and venture capital funds called $4.5 billion from investors during the quarter, a 51% decrease, and distributions totaled $15.7 billion, which represented a 24% drop. Distributions continued to outpace contributions, a trend that has generally held true since fourth quarter 2010.
- Managers of funds raised in 2011, 2013, and 2014 called $3.2 billion, or 70% of the total capital called during the quarter. All three vintage years called more than $740 million; the 2013 funds led the group with $1.7 billion in calls. Five vintages—2004, 2006–08, and 2012—each distributed more than $1.3 billion for a combined total of $13.2 billion (84% of the total). The 2006 vintage year led the way, distributing $5.9 billion.
- All six meaningfully sized sectors earned positive returns for the quarter, though when measured in euros, performance was mixed (Table 3). Among the key sectors, manufacturing earned the highest return and IT the lowest. The 2007, 2008, and 2012 vintages were responsible for more than 60% of the write-ups in the manufacturing sector. IT write-ups were highest in the 2012 and 2007 vintages, while write downs were most severe in the 2008 funds. The four largest sectors—consumer, health care, IT, and financial services—represented slightly more than 60% of the index’s value and on a dollar-weighted value returned 3.8%, underperforming the index’s total gross return of 4.2%.

Table 3. Global ex US Developed Markets PE/VC Index Sector Returns: Gross Company-Level Performance
Percent (%)
Note: Industry-specific gross company-level returns are before fees, expenses, and carried interest.
- Consumer companies attracted by far the most capital during the quarter, collecting 42% of the capital invested during the quarter. Over the long term, the consumer sector has garnered 26% of capital invested.
- In USD terms, four of the five countries representing the bulk of the index posted positive returns during the first quarter; the largest country, the United Kingdom, was the exception (Table 4). The continental European countries, France, Germany, and Sweden, gained between 4.9% and 6.6%. For the quarter, the gross, dollar-weighted return for the two largest countries, the United Kingdom and the United States, was 1.2%, 300 bps lower than the index’s total gross return.[1]Funds in the global ex US developed markets PE/VC index primarily invest in companies in Europe, but occasionally make investments in US companies as well.
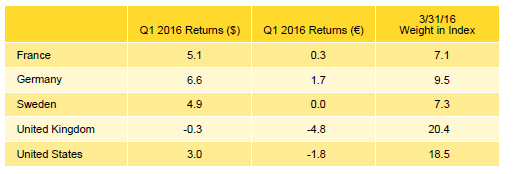
Table 4. Global ex US Developed Markets PE/VC Index Country Returns: Gross Company-Level Performance
Percent (%)
Note: Gross company-level returns are before fees, expenses, and carried interest.
- European companies attracted 64% of the capital invested during the quarter, about 14% less than the long-term norm for the region. Investment in US-based companies (about 22% of total) was about 10% higher than what it has been historically in the global ex US manager index.
Emerging Markets Private Equity Performance Insights
- At the end of the first quarter, vintage years 2006 through 2012 accounted for 84% of the emerging markets index (Table 5). With the exception of 2010, each of the meaningfully sized vintages had a return that was negative or less than 1% for the first quarter. Write ups in IT, software, and transportation were the main drivers for the 2010 vintage. The 2008 vintage dropped 2.5% due to large losses in energy, environment, and media companies, coupled with tepid performance in all other sectors. By the end of the quarter, 2007 was the largest vintage year, representing 20% of the index. Performance for the 2007 vintage was driven by losses in the financial services, media, and software sectors.
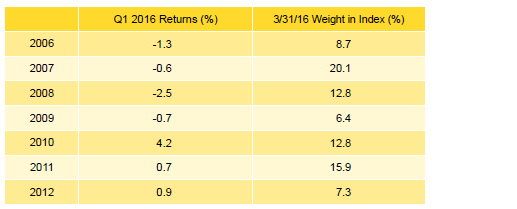
Table 5. Emerging Markets PE/VC Index Vintage Year Returns: Net Fund-Level Performance
Notes: Returns in USD terms. Vintage year fund-level returns are net of fees, expenses, and carried interest.
- During first quarter 2016, emerging markets private equity and venture capital funds called $3.6 billion from investors, a 26% decrease from the prior quarter and the lowest amount since first quarter 2015. Distributions totaled $4.6 billion and represented a 22% decrease from the previous quarter’s total. Since the inception of the index in 1986, quarterly distributions have outpaced contributions in only 14% of the quarters, and in absolute terms, the first quarter’s distributions ranked seventh all-time.
- Managers of funds raised from 2011 through 2015 called $2.8 billion, or 77% of the total for the quarter; the 2011 managers alone called over $850 million. On the distributions front, managers of funds raised in 2007 distributed by far the most money to investors, almost $1.9 billion, accounting for 41% of the quarter’s total.
- Five of the seven meaningfully sized sectors posted positive quarterly returns (Table 6); manufacturing and health care represented the brightest spots in an otherwise pedestrian quarter. Manufacturing earned the best return at 3.8%, while financial services earned the lowest return at -3.3%. Nearly 64% of the manufacturing write-ups were attributed to investments made by funds formed in 2006 and 2007; the 2007 funds were responsible for 43% of the write-ups. At the opposite end for manufacturing, two thirds of the sector’s write-downs came from the 2011 vintage. Financial services companies in the 2007 and 2011 funds had the largest write-downs for the quarter, while the 2012 vintage year fund investments were the lone strong performers for the sector, representing 75% of write-ups. On a gross, dollar-weighted basis, the three largest sectors by market value returned 1.7% during the quarter, outperforming the 0.6% return for all companies.

Table 6. Emerging Markets PE/VC Index Sector Returns: Gross Company-Level Performance
Notes: Returns in USD terms. Industry-specific gross company-level returns are before fees, expenses, and carried interest.
- Software, consumer, financial services, and IT companies (in rank order) garnered the most capital during the quarter, 61% of the capital invested; software businesses alone attracted 19% of it. Investment activity in the first quarter represented a more than 10% increase over the previous quarter. Over the long term, managers in the emerging markets index have allocated nearly 70% of their capital to five sectors: consumer, financial services, health care, IT, and manufacturing.
- Highlighting the index’s geographic concentration, China and India continued to be the only two countries that made up more than 5% of the index by market value, and together they accounted for approximately 55% of the index (Table 7). South Korea fell just shy of the 5% threshold at 4.9% of the total index value. Four other countries, including Brazil, Singapore, the United Kingdom, and the United States, represented at least 2.5% of the index. China-based companies continued to receive and return more capital than any other country. Together with India, total capital invested in the first quarter in companies headquartered in the two countries represented 35% of dollars invested. Chinese companies struggled due to significant write-downs in vintages 2006 through 2011. Write-downs for India-based companies were less severe but the group as a whole produced a negative return.
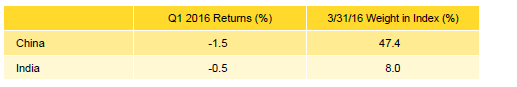
Table 7. Emerging Markets PE/VC Index Country Returns: Gross Company-Level Performance
Notes: Returns in USD terms. Gross company-level returns are before fees, expenses, and carried interest.
- On a gross, dollar-weighted basis, China and India returned a combined -1.3%. Brazil earned the best return among any country representing more than 2.5% of the index, returning 13.2%.
About the Cambridge Associates LLC Indexes
Cambridge Associates derives its Global ex US Developed Markets Private Equity and Venture Capital Index from the financial information contained in its proprietary database of global ex US private equity and venture capital funds. As of March 31, 2016, the database comprised 805 global ex US developed markets private equity and venture capital funds formed from 1986 to 2015 with a value of about $252 billion. Ten years ago, as of March 31, 2006, the benchmark index included 416 global ex US developed markets funds, whose value was roughly $95 billion. The funds in this index invest primarily in developed markets in Australia, Canada, Israel, Japan, New Zealand, Singapore, and Western Europe.
Cambridge Associates derives its Emerging Markets Private Equity and Venture Capital Index from the financial information contained in its proprietary database of global ex US private equity and venture capital funds. As of March 31, 2016, the database comprised 575 emerging markets funds formed from 1986 to 2015 with a value of $159 billion. Ten years ago, as of March 31, 2006, the benchmark index included 255 emerging markets funds, whose value was $18 billion. The funds in this index invest primarily in Africa, emerging Asia, emerging Europe, Latin America & Caribbean, and the Middle East ex Israel.
The pooled returns represent the net periodic rates of return calculated on the aggregate of all cash flows and market values as reported to Cambridge Associates by the funds’ general partners in their quarterly and annual audited financial reports. These returns are net of management fees, expenses, and performance fees that take the form of a carried interest.
About the Public Indexes
The MSCI EAFE Index is a free-float-adjusted market capitalization–weighted index that is designed to measure large- and mid-cap equity performance of developed markets, excluding Canada and the United States. As of February 2016 the MSCI EAFE Index consisted of the following 21 developed markets country indexes: Australia, Austria, Belgium, Denmark, Finland, France, Germany, Hong Kong, Ireland, Israel, Italy, Japan, the Netherlands, New Zealand, Norway, Portugal, Singapore, Spain, Sweden, Switzerland, and the United Kingdom.
The MSCI Emerging Markets Index is a free-float-adjusted market capitalization–weighted index that is designed to measure large- and mid-cap equity performance of emerging markets. As of February 2016, the MSCI Emerging Markets Index included 23 emerging markets country indexes: Brazil, Chile, China, Colombia, Czech Republic, Egypt, Greece, Hungary, India, Indonesia, Korea, Malaysia, Mexico, Peru, the Philippines, Poland, Russia, Qatar, South Africa, Taiwan, Thailand, Turkey, and the United Arab Emirates.
The Standard & Poor’s 500 Composite Stock Price Index is a capitalization-weighted index of 500 stocks intended to be a representative sample of leading companies in leading industries within the US economy. Stocks in the index are chosen for market size, liquidity, and industry group representation.
Footnotes