Overview
The Cambridge Associates LLC Global ex US Developed Markets Private Equity and Venture Capital (PE/VC) Index® returned -2.8% in US$ terms in first quarter 2015; the Cambridge Associates LLC Emerging Markets Index® returned 3.1%. The euro continued to weaken in the first quarter, putting pressure on returns measured in US dollars. Non-US public indexes tracking companies in developed and emerging markets produced strong returns in the first quarter, and the emerging markets index underperformed the developed markets. Both the developed and emerging markets PE/VC indexes have beaten the public indexes over the long term.
Performance for the Cambridge Associates LLC Global ex US Developed Markets and Emerging Markets PE/VC indexes is derived from data compiled from institutional-quality funds raised between 1986 and 2014. There are more than 750 funds in the developed markets index and over 550 in the emerging markets index. Funds in the global ex US developed market PE/VC index primarily invest in companies in Europe, but occasionally make investments in US companies as well.
First Quarter 2015 Highlights
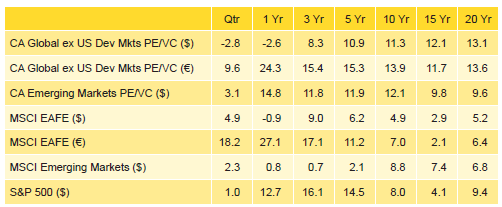
Table 1. Returns for the Global ex US Developed and Emerging Markets PE/VC Indexes vs Public Counterparts
Periods Ended March 31, 2015 • Percent (%)
Sources: Cambridge Associates LLC, MSCI Inc., Standard & Poor’s, and Thomson Reuters Datastream. MSCI data provided “as is” without any express or implied warranties.
Notes: The CA global ex US developed markets index includes private equity and venture capital funds that invest primarily in developed markets in Australia, Canada, Israel, Japan, New Zealand, Singapore, and Western Europe. The CA emerging markets index includes private equity and venture capital funds that invest primarily in Africa, emerging Asia, emerging Europe, Latin America & Caribbean, and the Middle East ex Israel. Because the indexes are capital weighted, performance is mainly driven by the largest vintage years. The PE/VC indexes’ returns are based on limited partners’ fund-level performance; the returns are net of fees, expenses, and carried interest.
- The developed markets PE/VC index has had mixed results versus the comparable public equity index (MSCI EAFE) over the various time periods ending March 31, 2015 listed in Table 1. The private equity index has struggled to keep pace over the recent periods, but has beaten the EAFE index handily in time horizons of five years and longer.
- The emerging markets PE/VC index bested its corresponding public market benchmark (MSCI Emerging Markets Index) across all the periods highlighted in the table. Outperformance in the one-, three-, and five-year periods was particularly strong.
- Geographically, the two indexes remained stable during the quarter with Western Europe dominating the developed markets index and China and India the only two countries to account for more than 5% of the emerging markets index. While no other individual country represented more than 5% of the index, the Latin American region (with Brazil being the largest country) now represents almost 5%.
- Based on market values at March 31, 2015, public companies accounted for nearly 16% of the developed markets PE/VC index and 20% of the emerging markets PE/VC index, roughly the same amounts as during the prior quarter.
Global ex US Developed Markets Private Equity and Venture Capital Performance Insights
During the first quarter, all but two vintage years from 2000 through 2014 posted negative returns, and the exceptions were 2001 and 2006. The seven vintages that represented more than 5% of the index accounted for almost 86% of the benchmark’s value. The range of returns among the seven “meaningfully sized” vintages was -5.6 to 1.2, with the 2011 vintage earning the quarter’s lowest return and 2006 the highest (Table 2). Two sectors, consumer and IT, dragged down the performance for the 2011 vintage. In the 2006 funds, substantial write-downs in consumer, health care, and energy were lower than gains in media, electronics, IT, and industrials. For the largest vintage, 2007, more than a billion dollars of write-ups in IT could not offset the significant write-downs in consumer, health care, and manufacturing.
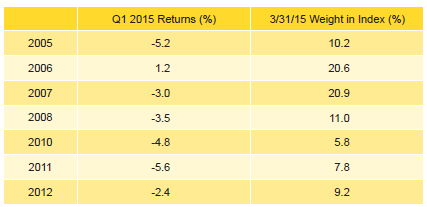
Table 2. Global ex US Developed Markets PE/VC Index Vintage Year Returns: Net Fund-Level Performance
Developed markets private equity and venture capital funds called $6.4 billion from investors during the quarter, a 13% decrease from the prior quarter. Distributions totaled $15.9 billion, which represented a 20% drop from previous quarter’s total. Distributions have outpaced contributions for nine consecutive quarters and 11 of the last 12.
Managers of funds raised in 2010 through 2013 called about $5.0 billion, or 77% of the total capital called during the quarter. All four vintage years called more than $800 million each. Each of the vintage years from 2004 through 2008 distributed more than $970 million, with the 2006 vintage leading the way with $6.9 billion of distributions. Combined, these five vintage years accounted for 87% of the total capital distributed in the quarter.
All but two of the seven meaningfully sized sectors earned negative returns for the quarter (Table 3). Among the key sectors, media earned the highest return and manufacturing the worst, but the energy sector, now only 4.6% of the index, produced the lowest return among all sectors, -8.7%. The 2006 vintage was responsible for the bulk of the write-ups in the media sector. Write-downs for manufacturing were somewhat concentrated in vintage years 2005 through 2008. Energy company write-downs were widespread, but highest in vintage years 2005, 2006, and 2008. The three largest sectors—consumer, health care, and IT—represented nearly half of the index’s value and on a dollar-weighted value returned -1.2%, slightly outperforming the index’s total gross return of -1.6%.
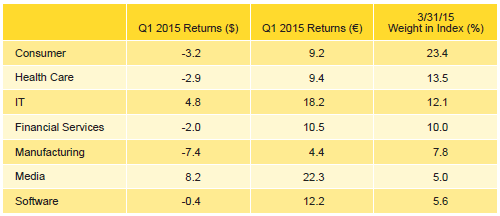
Table 3. Global ex US Developed Markets PE/VC Index Sector Returns: Gross Company-Level Performance
Percent (%)
The manufacturing and health care sectors attracted the most capital during the quarter and, along with IT and financial services, collected more than 59% of the capital invested during the quarter. Since inception, these four sectors garnered about 41% of the capital.
Three of the five countries representing the bulk of the index posted negative returns during the first quarter (Table 4). The two largest countries, the United Kingdom and the United States, were the exceptions, earning positive returns, and were the two least impacted by currency shifts. The continental European countries—France, Germany, and Sweden—lost between 3.9% and 5.6%. Companies based in developed Asia, Japan, and Australia accounted for almost 5% and were the only other countries that had a positive return for the quarter.
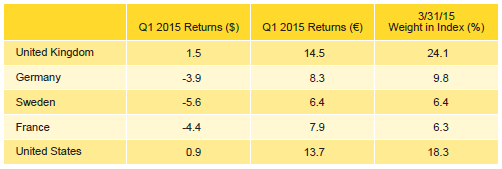
Table 4. Global ex US Developed Markets PE/VC Index Regional Returns: Gross Company-Level Performance
Percent (%)
Western European companies attracted 73% of the capital invested during the quarter, about 6% less than the long-term norm for the region. Investment in US-based companies (about 22% of total) was substantially higher than what it has been historically in the global manager index (approximately 13%).
Emerging Markets Private Equity Performance Insights
At the end of the first quarter, vintage years 2005 through 2011 accounted for 89% of the emerging markets index, and all earned positive returns for the quarter (Table 5). Funds raised in 2011 posted the quarter’s highest return with 2005 following closely behind. Significant write-ups in IT were the main driver in four of the seven vintage years and, overall, represented 44% of the index’s total net appreciation. Software and manufacturing write-ups also helped boost the 2011 vintage’s first quarter return. The 2008 vintage earned the lowest quarterly return out of the key seven vintage years, due in part to more modest write-ups in health care and media. By the end of the quarter, 2007 was the largest vintage year, representing 26% of the index. Alongside IT, the write-ups in financial services, consumer, media, and software contributed to that vintage’s middling performance for the quarter.
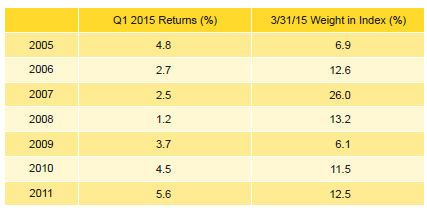
Table 5. Emerging Markets PE/VC Index Vintage Year Returns: Net Fund-Level Performance
During first quarter 2015, emerging markets private equity and venture capital funds called $2.9 billion from investors, a 39% decrease from the prior quarter and the lowest amount in two years. Distributions totaled $4.2 billion and represented a 28% decrease from the previous quarter’s total. However, 2014 was the top year for distributions in the index’s entire history, and the first quarter’s distributions were only 2% lower than first quarter 2014. Since the inception of the index in 1986, quarterly distributions outpaced contributions in only 11% of the quarters; first quarter 2015 ranked fifth all-time based on the ratio of distributions to capital calls.
Managers of funds raised from 2010 through 2014 called $2.3 billion, or 78% of the total for the quarter; the 2012 and 2014 managers alone called more than $1.2 billion. On the distributions front, managers of funds raised in 2007 by far distributed the most money to investors—over $2.0 billion, accounting for 48% of the quarter’s total.
All six of the meaningfully sized sectors posted positive quarterly returns (Table 6). IT earned the best return at 12.4% while financial services earned the lowest return at 0.1%. Nearly 70% of the strong IT write-ups were attributed to investments made by funds formed in 2005, 2006, and 2011; the 2006 funds were responsible for 30% of the write-ups. Valuation increases for financial services companies in the 2007 funds were completely offset by write-downs in the investments of vintage years 2005 and 2006.
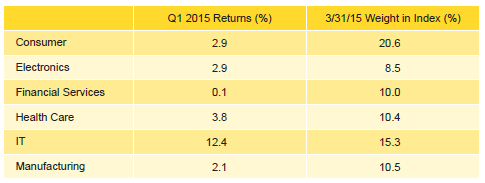
Table 6. Emerging Markets PE/VC Index Sector Returns: Gross Company-Level Performance
On a gross, dollar-weighted basis, the six largest sectors by market value returned 4.3% during the quarter, slightly outperforming the 4.0% return for all companies.
Consumer, health care, and IT companies garnered about 64% of the capital invested during the quarter, with consumer businesses alone attracting about 26%. There was a slowdown of investment activity in the first quarter, as the amount of capital invested was only about half of that invested during the previous quarter. Since inception, managers in the emerging markets index have allocated nearly 70% of their capital to five sectors, consumer, manufacturing, IT, financial services, and health care.
Highlighting the index’s geographic concentration, China and India were the only two countries that made up more than 5% of the index by market value, and together they accounted for approximately 54% of the index (Table 7). South Korea fell just shy of the 5% threshold at 4.8% of the total index value. Four countries—Singapore, the United States, Brazil, and Japan—each represented at least 2.5% of the index. China-based companies continued to receive and return more capital than any other country. Together with India, total capital invested in companies headquartered in the two countries represented 56% of the index. Write-ups for Chinese companies continued to be strong, mainly driven by funds raised in 2005 and 2011.
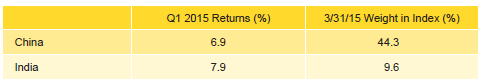
Table 7. Emerging Markets PE/VC Index Regional Returns: Gross Company-Level Performance
On a gross, dollar-weighted basis China and India combined returned 7.1%. India earned the best return among any country representing more than 3% of the index, outperforming the index’s gross overall return by about 300 bps.
About the Indexes
Cambridge Associates derives its Global ex US Developed Markets Private Equity and Venture Capital Index® from the financial information contained in its proprietary database of global ex US private equity and venture capital funds. As of March 31, 2015, the database comprised 753 global ex US developed markets private equity and venture capital funds formed from 1986 to 2014 with a value of about $247 billion. Ten years ago, as of March 31, 2005, the benchmark index included 355 global ex US developed markets funds, whose value was roughly $76 billion.
Cambridge Associates derives its Emerging Markets Private Equity and Venture Capital Index® from the financial information contained in its proprietary database of global ex US private equity and venture capital funds. As of March 31, 2015, the database comprised 553 emerging markets funds formed from 1986 to 2014 with a value of $154 billion. Ten years ago, as of March 31, 2005, the benchmark index included 211 emerging markets funds, whose value was $16 billion.
The pooled returns represent the net periodic rates of return calculated on the aggregate of all cash flows and market values as reported to Cambridge Associates by the funds’ general partners in their quarterly and annual audited financial reports. These returns are net of management fees, expenses, and performance fees that take the form of a carried interest.