Overview
During the third quarter, the Cambridge Associates LLC Global ex US Developed Markets Private Equity and Venture Capital (PE/VC) Index fell 5.0% in US$ terms, its first negative quarterly return since second quarter 2012 (breaking its string of eight consecutive positive quarters). The euro weakened in the third quarter, putting pressure on returns measured in US dollars (measured in euros, the index returned 3.0%, illustrating how the strong dollar dragged down returns shown in this report, which are all in US$ terms). The Emerging Markets Index returned 1.6%. Non-US public indexes tracking companies in the developed and emerging markets were down in the third quarter, and the developed markets index lost more than the emerging markets index. The PE/VC benchmarks for the global ex US developed markets and emerging markets outperformed their public counterparts. Both the developed and emerging markets PE/VC indexes have beaten the public indexes over the long term.
Performance for the Cambridge Associates LLC Global ex US Developed Markets and Emerging Markets PE/VC Indexes is derived from data compiled from institutional-quality funds raised between 1986 and 2014. There are more than 700 funds in the developed markets index and over 500 in the emerging markets index. Funds in the global ex US developed markets PE/VC index primarily invest in companies in Europe, but occasionally make investments in US companies as well.
Third Quarter 2014 Highlights
- With the exception of the three-year period, the developed markets PE/VC index outperformed the comparable public equity index in all time periods ending September 30, 2014, shown in Table 1, with particularly wide spreads in the longer horizons.
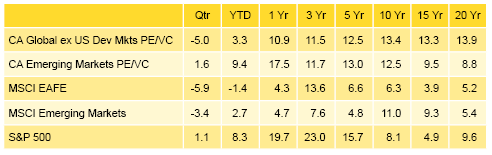
Table 1. Returns for the Global ex US Developed and Emerging Markets PE/VC Indexes vs Public Counterparts
US$ Terms • Percent (%)
Notes: The global ex US developed markets index includes private equity and venture capital funds that invest primarily in developed markets in Australia, Canada, Israel, Japan, New Zealand, Singapore, and Western Europe. The emerging markets index includes private equity and venture capital funds that invest primarily in Africa, emerging Asia, emerging Europe, Latin America & Caribbean, and the Middle East ex Israel. Because the indexes are capital weighted, performance is mainly driven by the largest vintage years. The PE/VC indexes’ returns are based on limited partners’ fund-level performance; the returns are net of fees, expenses, and carried interest.
- The emerging markets PE/VC index bested its corresponding public market benchmark (MSCI Emerging Markets Index) across all the periods highlighted in the table. Outperformance in the one- and five-year periods was particularly strong.
- Geographically, the two indexes remained stable during the quarter with Western Europe dominating the developed markets index and China and India representing the only two countries to account for more than 5% of the emerging markets index. There are now nine other countries that make up between 2% and 4% of the emerging index, suggesting that the index has become slightly more diversified than it has been in the past.
- Based on market values at September 30, 2014, public companies accounted for nearly 14% of the developed markets PE/VC index, a 1% drop from the prior quarter. At close to 21%, public company exposure in the emerging markets PE/VC index was also down about 1% from the second quarter.
Global ex US Developed Markets Private Equity and Venture Capital Performance Insights
- During the third quarter, all vintage years from 1994 through 2014 posted negative returns. Only six vintages represented more than 5% of the index, together accounting for more than 81% of the benchmark’s value (Table 2). The range of returns among the six “meaningfully sized” vintages was -2.2 to -6.3, with the 2011 vintage earning the quarter’s highest return and 2005 the lowest. Only two sectors, consumer and IT, experienced significant write-downs in the 2011 vintage year but there were five such sectors in the 2005 vintage.
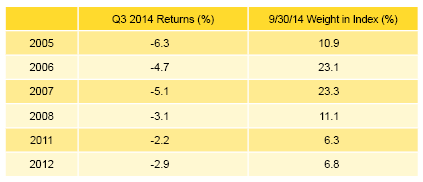
Table 2. Global ex US Developed Markets PE/VC Index Vintage Year Returns: Net Fund-Level Performance
Notes: Returns in US$ terms. Vintage year fund-level returns are net of fees, expenses, and carried interest.
- The two largest vintages, 2006 and 2007, each fell about 5% during the quarter due to widespread write-downs. The bright spots for the 2006 and 2007 vintages were health care and IT, respectively.
- Developed markets PE/VC funds called $11.0 billion from investors during the quarter, a 71% increase from the prior quarter. Distributions totaled $19.9 billion, which represented a 33% increase from previous quarter’s total. Distributions have now outpaced contributions for ten consecutive quarters.
- Managers of funds raised in 2011, 2012, and 2013 called $8.5 billion, or 78% of the total capital called during the quarter. All three vintage years called more than $2 billion each. Vintage years 2004 through 2008 each distributed more than $1.2 billion, with the 2006 vintage leading the way with almost $6 billion of distributions. Combined, these five vintage years accounted for 85% of the total capital distributed in the quarter.
- All seven meaningfully sized sectors posted negative returns for the quarter (Table 3). The IT sector had the best return and media the worst, ending the sector’s run of strong performance that began in 2012. Write-downs were widespread for both sectors. The three largest sectors—consumer, health care, and IT—represented nearly half of the index’s value and on a dollar-weighted basis returned -3.4%.
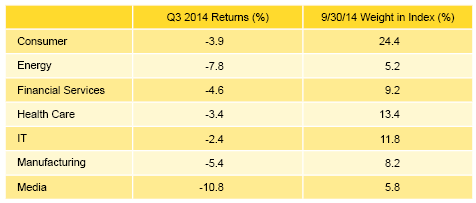
Table 3. Global ex US Developed Markets PE/VC Index Sector Returns: Gross Company-Level Performance
Notes: Returns in US$ terms. Industry-specific gross company-level returns are before fees, expenses, and carried interest.
- The IT and health care sectors attracted the most capital during the quarter—41% of the total. For the second quarter in a row, IT company investments represented 24% of the capital deployed in the quarter, which is about 14% higher than the sector’s long-term norm.
- All five of the countries representing the bulk of the index posted negative returns during the third quarter (Table 4). While the return for the European countries ranged from -6.5% for French companies to -4.3% for UK-based businesses, US companies in the index lost 2.2%, the quarter’s best return but the one least influenced by currency fluctuations. Companies headquartered throughout Western Europe and in the United States represented about 83% of the index. Businesses based in Japan accounted for less than 2% of the index but they were the only ones that had a positive return for the quarter.
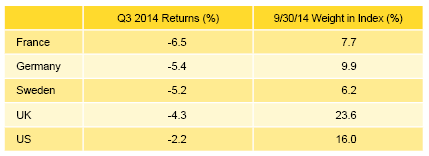
Table 4. Global ex US Developed Markets PE/VC Index Regional Returns: Gross Company-Level Performance
Notes: Returns in US$ terms. Geographic region–specific gross company-level returns are before fees, expenses, and carried interest.
- Western European companies attracted 65% of the capital invested during the quarter, about 11% less than the long-term norm for the region. Investment in US-based companies (14% of total) was a bit higher than what it has been historically in the global PE/VC index.
Emerging Markets Private Equity and Venture Capital Performance Insights
- By the end of third quarter 2014, vintage years 2005 through 2011 accounted for slightly more than 92% of the emerging markets PE/VC index, and all but one earned positive returns for the quarter (Table 5). Funds raised in 2005 posted the quarter’s lone negative return, and write-downs in media and software companies were to blame. The 2010 vintage earned the best return among the seven vintages, thanks mostly to IT write-ups. With 30% of the index’s value, 2007 was the largest vintage year, and its modest return had a significant impact on the benchmark’s return. Four sectors (electronics, heath care, IT, and software) saw healthy valuation increases but they were partially offset by diminished values for consumer companies.
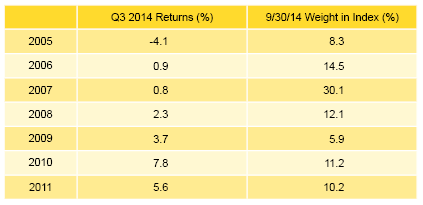
Table 5. Emerging Markets PE/VC Index Vintage Year Returns: Net Fund-Level Performance
Notes: Returns in US$ terms. Vintage year fund-level returns are net of fees, expenses, and carried interest.
- In third quarter 2014, emerging markets PE and VC funds called $3.9 billion from investors, a 19% decrease from the prior quarter. Distributions totaled $4.1 billion, a nearly 43% decrease from the previous quarter’s total, which represented the highest amount ever distributed in a quarter. This marks the fifth quarter in the past seven that distributions outnumbered contributions, an unusual trend given that in the last ten years there have been only nine quarters when distributions were higher than contributions.
- Managers of funds raised from 2010 to 2012 called $2.7 billion, or 68% of the total; the 2011 vintage alone called $1.4 billion, or 35% of the total. Vintage years 2005–07 combined to distribute $2.8 billion to LPs, which represented 68% of the total distributed in the quarter. The 2007 funds distributed the most of the three, $1.6 billion.
- All six of the meaningfully sized sectors posted positive quarterly returns (Table 6). IT earned the highest return at 4.2%, while consumer earned the lowest return at 0.6%. The IT sector’s strongest write-ups were in vintage years 2010 and 2011, which were partially offset by losses in the 2006 vintage. For the consumer sector, modest write-ups, led by vintage year 2008, were nearly offset by write-downs, the highest of which were in vintage year 2007 funds.
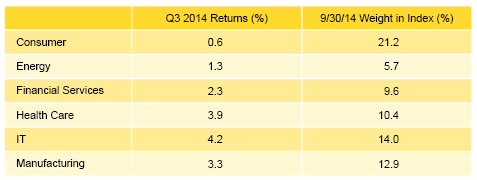
Table 6. Emerging Markets PE/VC Index Sector Returns: Gross Company-Level Performance
Notes: Returns in US$ terms. Industry-specific gross company-level returns are before fees, expenses, and carried interest.
- On a gross, dollar-weighted basis, the six large sectors by market value—consumer, IT, manufacturing, health care, financial services and energy—returned 2.5% during the quarter, slightly out-performing the return for all companies.
- Consumer, IT, transportation and financial services companies garnered about 64% of the capital invested during the quarter, with consumer businesses alone attracting about 30% of it. Over the long term, these four sectors have represented about 46% of the dollars invested by managers in the emerging markets index. Above average commitments were made to consumer, IT, and transportation in the quarter.
- Highlighting the index’s geographic concentration, China and India were the only two countries that made up more than 5% of the index by market value, and together they accounted for more than 48% of the index (Table 7). Five countries—Australia, Brazil, South Korea, Singapore, and the United Kingdom—each represented at least 2.9% of the index. Concentration was also evident in where capital was directed, with companies headquartered in China or India attracting 62% of the total invested by managers in the index. The next largest investments by country were in South Korea, Singapore, Russia, and Australia, and each country represented between 4% and 5% of invested capital in the quarter.
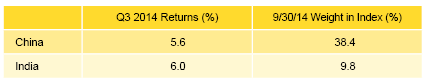
Table 7. Emerging Markets PE/VC Index Regional Returns: Gross Company-Level Performance
Notes: Returns in US$ terms. Geographic region–specific gross company-level returns are before fees, expenses, and carried interest.
- On a dollar-weighted basis, China and India returned 5.6%. India earned the best return among countries representing more than 3% of the index.
About the Indexes
Cambridge Associates derives its Global ex US Developed Markets Private Equity and Venture Capital Index from the financial information contained in its proprietary database of global ex US private equity and venture capital funds. As of September 30, 2014, the database comprised 732 global ex US developed markets private equity and venture capital funds formed from 1986 to 2014 with a value of about $274 billion. Ten years ago, as of September 30, 2004, the benchmark index included 345 global ex US developed markets funds, whose value was roughly $67 billion.
Cambridge Associates derives its Emerging Markets Private Equity and Venture Capital Index from the financial information contained in its proprietary database of global ex US private equity and venture capital funds. As of September 30, 2014, the database comprised 543 emerging markets funds formed from 1986 to 2014 with a value of $142 billion. Ten years ago, as of September 30, 2004, the benchmark index included 202 emerging markets funds, whose value was $15 billion.