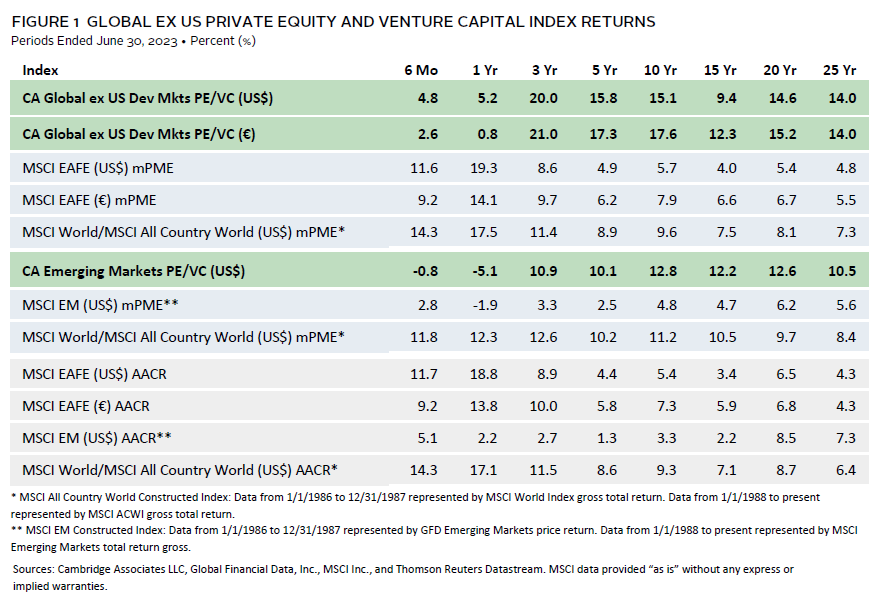
Private equity and venture capital (PE/VC) in the developed markets outperformed those in emerging markets in the first half of 2023 according to Cambridge Associates. The Cambridge Associates LLC Developed Markets ex US Private Equity and Venture Capital Index returned 4.8% in the period in USD terms and 2.6% in euros. Because returns are measured in US dollars, the currency’s value relative to the euro impacts performance of the developed markets index. As global economies slowly recovered, the US dollar weakened against the euro, making returns relatively stronger in USD. The Cambridge Associates LLC Emerging Markets Private Equity and Venture Capital Index earned -0.8% for the period, continuing a trend of weaker returns than the developed markets index over the last ten years (Figure 1). While the developed and emerging markets PE/VC indexes have historically outperformed their public market counterparts, the most recent year stands out as an exception.
First Half 2023 Highlights
- The developed PE/VC index earned better returns than its emerging counterpart, but both were outshined by public markets. In general, private equity outperformed venture capital, younger vintage years did better than older ones, and inflation-resistant sectors proved the most resilient.
- Based on market values as of June 30, 2023, public companies accounted for a larger percentage of the emerging markets PE/VC index (more than 16%) than the developed markets PE/VC index (less than 5%). This is typical, as the emerging markets index has more than twice as much exposure to venture capital than developed.
Developed ex US Markets Private Equity and Venture Capital Performance Insights
Vintage Years
Performance was positive but modest in the developed ex US PE/VC index in the first six months of 2023 when broken down by vintage year. Funds from the most recent years earned the best returns, but all eight meaningfully sized vintages (those that represented at least 5% of the index’s value) were in the black, ranging from 1.9% for 2014 to 7.9% for 2021 (Figure 2). The largest vintage year by weight, 2018, accounted for 18% of the index and returned 5.6%. In total, the key vintages represented roughly 86% of the index and earned a pooled return of 5.2%, slightly better than the full benchmark’s return.
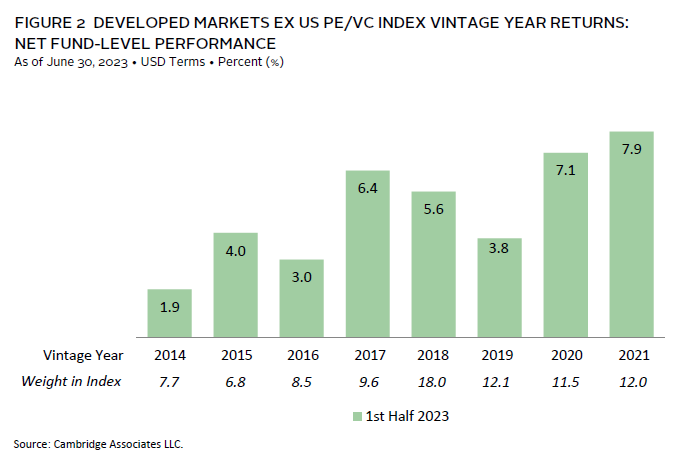
Write-ups in IT and, to a lesser extent, healthcare helped 2021 funds earn the best return of any vintage. The worst-performing vintage year, 2014, suffered from losses in consumer discretionary and a weak return from its largest sector, IT. Except for 2021, the industrials sector was a meaningfully positive contributor to vintage year performance in the first half of the year.
In aggregate, limited partner (LP) cash flows continued to decline in 2023, following a trend that started after record breaking levels in the second half of 2021. Contributions fell to $24.4 billion, a 20% drop from the last six months in 2022, and distributions decreased to $21.3 billion, their lowest amount since the onset of the COVID-19 pandemic in early 2020. Contributions have now outpaced distributions in the last four quarters, as a lack of exit opportunities and depressed valuations made it hard for general partners (GPs) to return capital.
Funds started from 2019 to 2022 accounted for more than 90% of the capital called in the first six months of 2023. The 2022 vintage alone called $7.1 billion or roughly 30% of the index total. Older vintage years (2014–18) returned approximately $17 billion, representing 80%. The distribution drought was mostly caused by funds from 2019 and 2020, which only returned 3% of the total despite being over three years old. These vintages likely invested most of their capital so far during the peak valuation environment in 2021 and are now facing a tougher exit environment.
Sectors
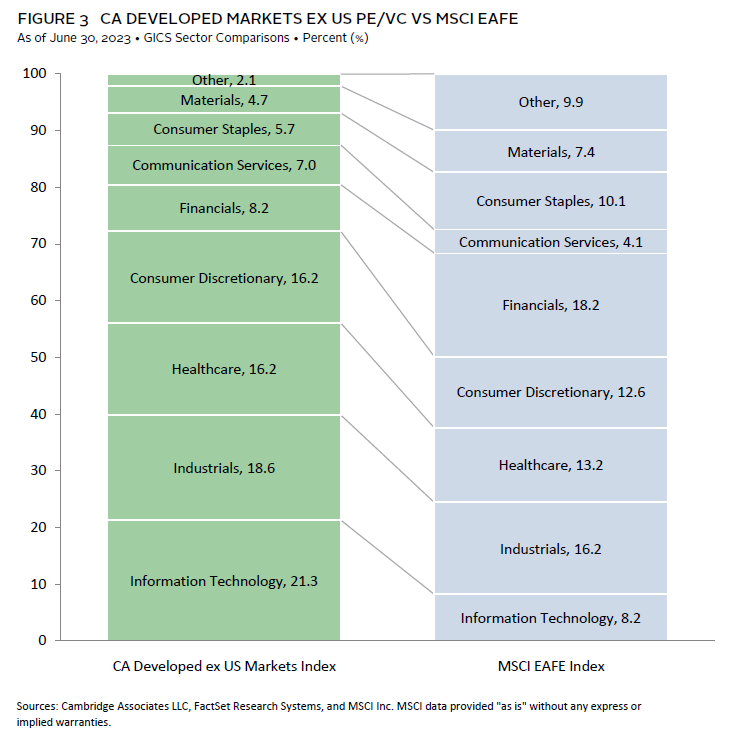
Figure 3 shows the Global Industry Classification Standard (GICS®) sector breakdown of the Developed Markets ex US Private Equity and Venture Capital Index and a public market counterpart, the MSCI EAFE Index. The chart illustrates differences in sector exposures, which helps explain relative performance. The PE/VC index has more than twice as much exposure to IT and less than half the exposure to financials. The private markets also have smaller overweights to healthcare and consumer discretionary and an underweight to consumer staples.
All seven meaningfully sized sectors earned positive returns in the first two quarters when measured in USD. The US dollar weakened somewhat over the period, which lowered returns when measured in euros; performance for consumer staples in euros was the only negative return (Figure 4). Businesses in the industrials sector were resilient amid high inflation and interest rates and earned the highest returns of any sector (6.8%). Collectively, the key sectors posted a pooled gross return of 5.2% in USD and 2.9% in euro terms.
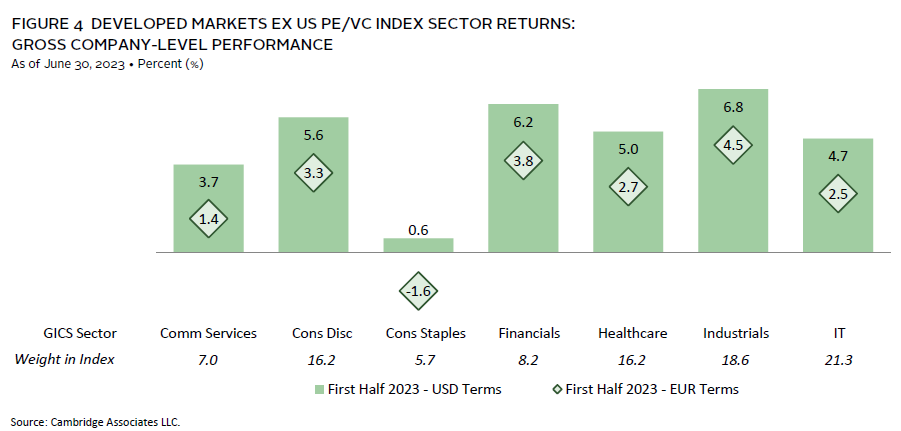
Healthcare, industrials, IT, and financials (in rank order) garnered a combined 64% of the invested capital, and each attracted at least 15%. IT—which accounts for over 21% of the index by market value—only received 16% during the first half of 2023, perhaps a reflection of the broader “risk-off” investor sentiment. Two other key sectors, consumer discretionary and communication services, each represented 11% of the invested capital. Consumer staples, the smallest of the key sectors, only received 3%, half its long-term average of 6%.
Countries
Performance varied across the seven meaningfully sized countries, with all earning positive returns in the first six months when measured in USD terms (Figure 5). Italy-based companies earned by far the best returns (13%), although they only account for 5.6% of the index. The largest country by value is the United States, which posted a 5.5% return. The worst-performing country was France, which returned 0.7% in USD terms but -1.5% when measured in euros, the local currency. Combined, the pooled gross return for all seven countries was 5.3% (USD) and 3.0% (EUR).
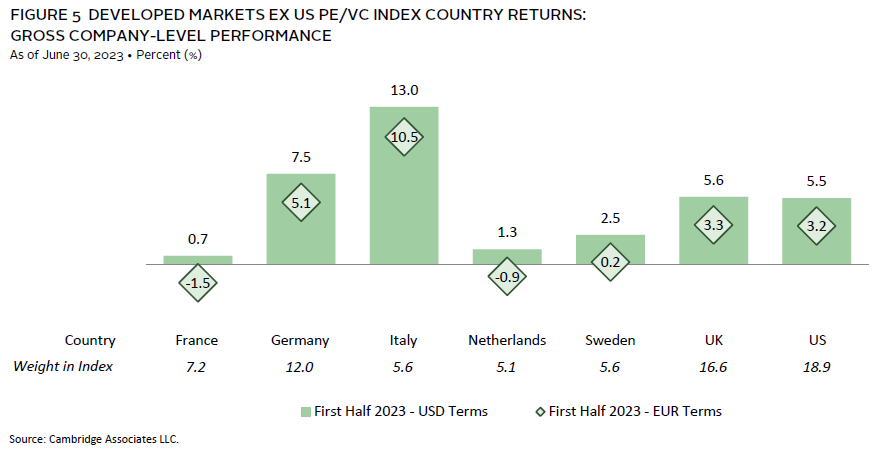
Companies in Germany garnered more than 20% of the capital invested during the first six months of the year, almost twice the country’s historical trend. UK businesses attracted only 14% of the invested capital, which is about 8% lower than the United Kingdom’s long-term allocation.
Emerging Markets Private Equity and Venture Capital Performance Insights
Vintage Years
As of June 30, 2023, ten vintage years in the emerging markets index were meaningfully sized (those that represented at least 5% by capital weight) and accounted for a combined 90% of the index’s value (Figure 6). Performance ranged from -2.6% for funds raised in 2011 to 7.9% for 2021 funds.
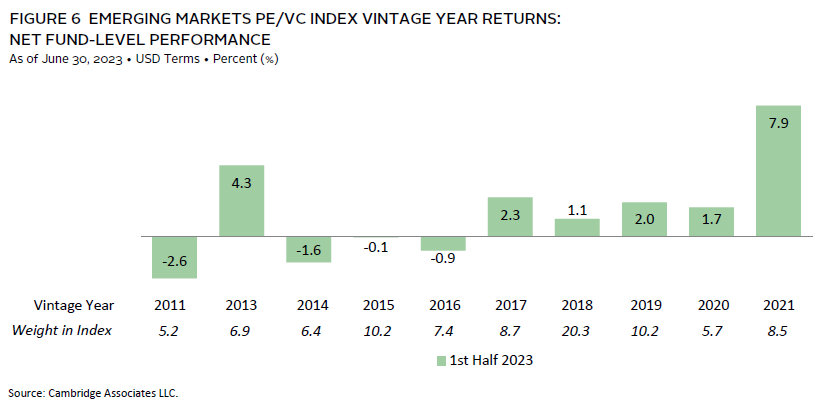
Performance for the best-returning vintage year, 2021, was primarily driven by write-ups in its largest two sectors: healthcare and consumer discretionary. On the bottom of the list, performance for the 2011 funds was pulled lower by write-downs across sectors, including communication services, consumer discretionary, financials, and healthcare. The largest vintage year by far, 2018, represented 20.3% of the index—nearly double the next largest vintage year—and posted a middling return of 1.1%, driven by mixed performance across sectors.
First half contributions and distributions both declined from the prior period, down 37% and 29%, respectively, with second quarter activity lower than first quarter. The amount called was the lowest of any half-year period since 2016, and the amount distributed was the lowest since 2017; emerging markets PE/VC funds called $8.3 billion from and distributed $9.1 billion to LPs during the period. Distributions have outpaced contributions in 11 of the last 15 quarters, unlike in the United States and in developed markets, where recent quarters have seen contributions outpace distributions since the beginning of 2022.
More than 70% of the capital called in the first six months was from funds raised in 2018 and 2021, with 58% coming from 2021 alone. The 2018 vintage funds drew down just over $1.0 billion, with 2021 funds calling $4.8 billion, by far the most of any vintage. Distributions were much more widespread as six different vintages returned more than $800 million to investors. Notably, the 13-year-old funds from 2011 returned the most capital, $2.0 billion.
Sectors
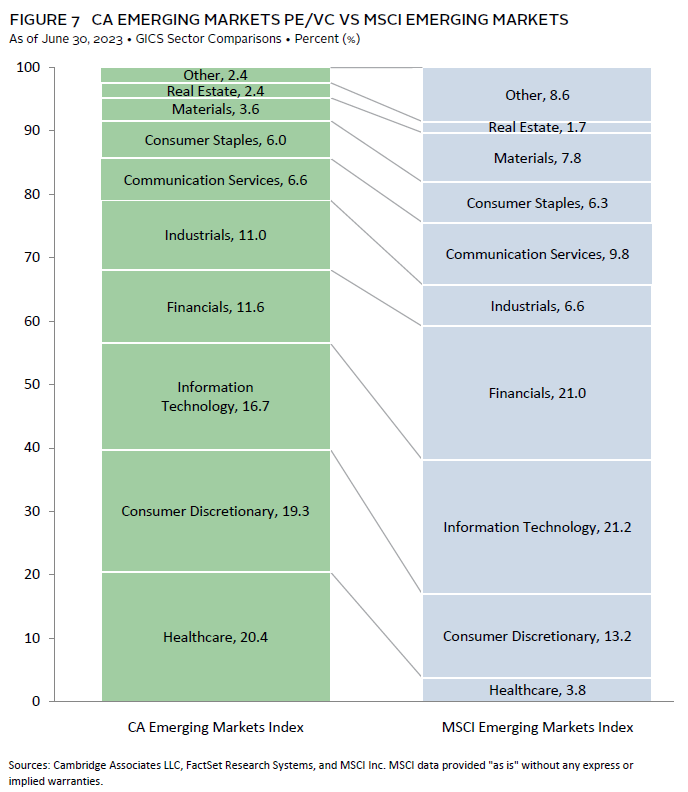
Figure 7 shows the GICS® sector breakdown of the emerging markets PE/VC index and a public market counterpart, the MSCI Emerging Markets Index. The chart highlights the significant overweights in the PE/VC index, such as in healthcare, for which exposure is more than five times higher than in the public index, and, to a lesser extent, consumer discretionary. Previously, the PE/VC index also had considerably more capital allocated to IT than the public benchmark, but exposure to this sector has recently increased in the MSCI Emerging Markets Index; the PE/VC benchmark now has an underweight to IT. The private index’s underweights are most significant in financials, followed by IT and energy (which is included in the “other” category).
Six of seven meaningfully sized sectors saw positive, though weak, returns in the first half (Figure 8). Financials (3.8%) and healthcare (3.5%) led the pack, while communication services, the worst-performing sector, experienced a 1.5% decline. The positive performance for financials was driven almost entirely by funds in the 2015 vintage. In communication services, positive returns from 2018 vintage funds were offset by funds in the 2011 and 2015 vintages. On a gross, dollar-weighted basis, the three largest sectors by market value—IT, consumer discretionary, and healthcare—accounted for 57% of the index and together returned 3.0% on a pooled basis, just above that of the other four meaningfully weighted sectors.
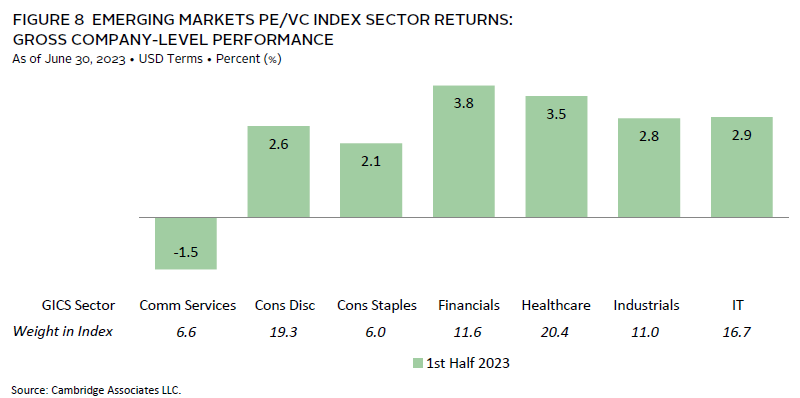
Companies in healthcare, communication services, and IT garnered nearly 75% of the capital invested. Since the inception of the emerging markets index, managers have only allocated 47% of capital to these three sectors. The discrepancy is primarily due to a recent significant increase in healthcare investment reaching 53% of capital (compared to 15% long term) at the detriment of consumer discretionary at 5% (19% long term) and industrials at 6% (13% long term).
Countries
China remained the largest country in the emerging markets PE/VC index by a considerable margin as of the end of the first half of 2023. The five meaningfully weighted countries ranged from China at 37.3% to Japan at 5.5%; Japan is a new addition this period, attracting just 4.6% of invested capital over the long term. India and the United States made the cut, representing 9.8% and 9.4% of the index, respectively, as did South Korea at 7.6% (Figure 9). Among meaningfully sized countries, Japan posted the best return—17.2% on a gross USD basis during the first half. South Korea also posted a double-digit return at 10.5%. India and the United States returned just 1.1% and 0.3%, respectively, while China posted the only negative return of the group at -3.8%.
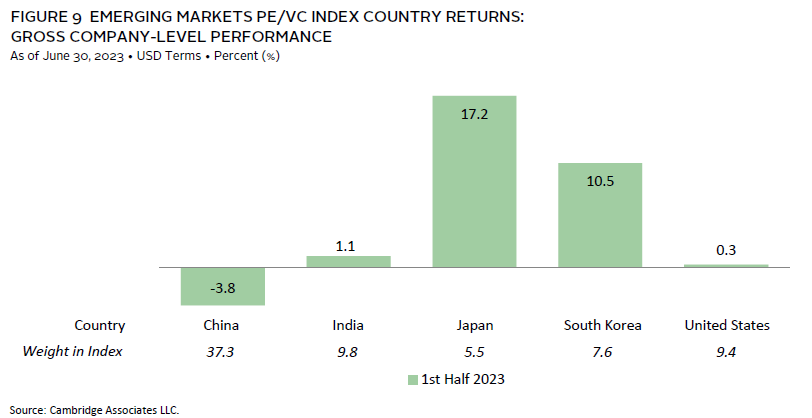
Companies in South Korea received 32% of the capital, significantly more than the country’s long-term norm of 7%. Japan also received substantially more than its long-term average, at 22% of the capital invested. After attracting 50% of the capital invested during the first half of 2021, China-based companies have seen a steady decline in the amount of capital received from emerging markets PE/VC managers and took in just 21% of invested capital during the period, reflective of ongoing geopolitical tensions. Businesses based in India and the United States both received about 4% of the capital invested during the period.
On a gross USD-weighted basis, when combined, companies based in China, India, Japan, South Korea, and the United States returned 2.5%, beating out the full index by about 50 basis points in the first half of 2023.
Caryn Slotsky, Senior Investment Director
Wyatt Yasinski, Associate Investment Director
Drew Carneal, Senior Investment Associate
Figure Notes
Private equity includes only buyout and growth equity funds.
Global ex US Private Equity and Venture Capital Index Returns
The PE/VC indexes are pooled horizon internal rates of return and are based on limited partners’ fund-level performance; the returns are net of fees, expenses, and carried interest. Because the indexes are capitalization weighted, performance is mainly driven by the largest vintage years.
Public index returns are shown as both time-weighted returns (average annual compound returns) and dollar-weighted returns (modified public market equivalent). Returns are annualized, with the exception of returns less than one year, which are cumulative. The CA mPME replicates private investment performance under public market conditions. The public index’s shares are purchased and sold according to the private fund cash flow schedule, with distributions calculated in the same proportion as the private fund, and mPME net asset value is a function of mPME cash flows and public index returns.
Vintage Year Returns
Vintage year fund-level returns are net of fees, expenses, and carried interest.
Sector Returns
Industry-specific gross company-level returns are before fees, expenses, and carried interest.
Country Returns
Industry-specific gross company-level returns are before fees, expenses, and carried interest.
GICS Sector Comparisons
The Global Industry Classification Standard (GICS®) was developed by and is the exclusive property and a service mark of MSCI Inc. and S&P Global Market Intelligence LLC and is licensed for use by Cambridge Associates. Other includes sectors that make up less than 3% of the CA benchmark.
About the Cambridge Associates LLC Indexes
Cambridge Associates derives its Global ex US Developed Markets Private Equity and Venture Capital Index from the financial information contained in its proprietary database of global ex US private equity and venture capital funds. As of June 30, 2023, the database comprised 1,075 global ex US developed markets buyouts, growth equity, and venture capital funds formed from 1986 to 2023 with a value of about $514 billion. Ten years ago, as of June 30, 2013, the benchmark index included 656 global ex US developed markets funds, whose value was roughly $253 billion. The funds in this index invest primarily in developed markets in Australia, Canada, Israel, Japan, New Zealand, Singapore, and Western Europe.
Cambridge Associates derives its Emerging Markets Private Equity and Venture Capital Index from the financial information contained in its proprietary database of global ex US buyouts, growth equity, and venture capital funds. As of June 30, 2023, the database comprised 791 emerging markets private equity and venture capital funds formed from 1986 to 2023 with a value of about $323 billion. Ten years ago, as of June 30, 2013, the benchmark index included 477 emerging markets funds, whose value was about $107 billion. The funds in this index invest primarily in Africa, emerging Asia, emerging Europe, Latin America & Caribbean, and the Middle East ex Israel.
The pooled returns represent the net periodic rates of return calculated on the aggregate of all cash flows and market values as reported to Cambridge Associates by the funds’ general partners in their quarterly and annual audited financial reports. These returns are net of management fees, expenses, and performance fees that take the form of carried interest.
About the Public Indexes
The MSCI ACWI captures large- and mid-cap representation across 23 developed markets and 24 emerging markets countries. With 2,946 constituents, the index covers approximately 85% of the global investable equity opportunity set. As of June 30, 2023, the MSCI ACWI consisted of 47 country indexes comprising 23 developed and 24 emerging markets country indexes. The developed markets country indexes included are: Australia, Austria, Belgium, Canada, Denmark, Finland, France, Germany, Hong Kong, Ireland, Israel, Italy, Japan, the Netherlands, New Zealand, Norway, Portugal, Singapore, Spain, Sweden, Switzerland, the United Kingdom, and the United States. The emerging markets country indexes included are: Brazil, Chile, China, Colombia, Czech Republic, Egypt, Greece, Hungary, India, Indonesia, Korea, Kuwait, Malaysia, Mexico, Peru, the Philippines, Poland, Qatar, Saudi Arabia, South Africa, Taiwan, Thailand, Turkey, and the United Arab Emirates.
The MSCI EAFE Index is a free float–adjusted, market capitalization–weighted index that is designed to measure large- and mid-cap equity performance of developed markets, excluding Canada and the United States. As of June 30, 2023, the MSCI EAFE Index consisted of the following 21 developed markets country indexes: Australia, Austria, Belgium, Denmark, Finland, France, Germany, Hong Kong, Ireland, Israel, Italy, Japan, the Netherlands, New Zealand, Norway, Portugal, Singapore, Spain, Sweden, Switzerland, and the United Kingdom.
The MSCI Emerging Markets Index is a free float–adjusted, market capitalization–weighted index that is designed to measure large- and mid-cap equity performance of emerging markets. As of June 30, 2023, the MSCI Emerging Markets Index included 24 emerging markets country indexes: Brazil, Chile, China, Colombia, Czech Republic, Egypt, Greece, Hungary, India, Indonesia, Korea, Kuwait, Malaysia, Mexico, Peru, the Philippines, Poland, Qatar, Saudi Arabia, South Africa, Taiwan, Thailand, Turkey, and the United Arab Emirates.
The MSCI World Index represents a free float–adjusted, market capitalization–weighted index that is designed to measure the equity market performance of developed markets. As of June 30, 2023, it includes 23 developed markets country indexes: Australia, Austria, Belgium, Canada, Denmark, Finland, France, Germany, Hong Kong, Ireland, Israel, Italy, Japan, the Netherlands, New Zealand, Norway, Portugal, Singapore, Spain, Sweden, Switzerland, the United Kingdom, and the United States.