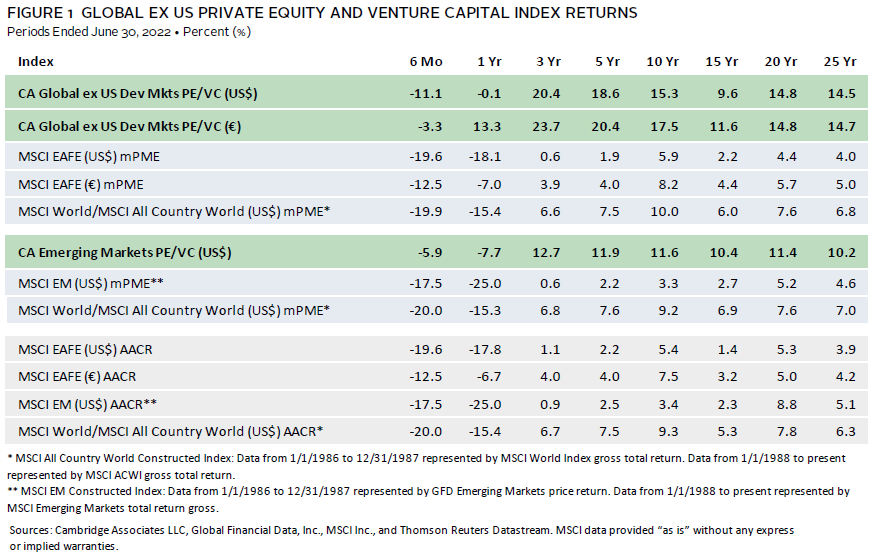
According to Cambridge Associates (CA) indexes, private equity and venture capital (PE/VC) in the developed markets underperformed those in emerging markets in first half 2022. The Cambridge Associates LLC Developed Markets ex US PE/VC Index returned -11.1% in the period, in USD terms, and -3.3% in euros. Because returns are measured in US dollars, the currency’s value relative to the euro impacts performance of the developed markets index. Amid fears of a global recession, the US dollar strengthened against most currencies, including the euro, making returns relatively weaker. The Cambridge Associates LLC Emerging Markets PE/VC Index earned -5.9% for the period, breaking a long-term trend of generating weaker returns than the developed markets index (Figure 1). The developed markets and emerging markets PE/VC indexes have handily outperformed their public market counterparts across time (based on modified public market equivalent [mPME] returns), with the widest margins occurring within the last five years.
First Half 2022 Highlights
- The sharp correction in global financial markets during first half 2022 was evident for both the developed and emerging PE/VC indexes, as negative returns were widespread across vintage years, sectors, and countries.
- Based on market values at June 30, 2022, public companies accounted for a larger percentage of the emerging markets PE/VC index (just under 16%) than of the developed markets PE/VC index (less than 6%).
Developed ex US Markets Private Equity and Venture Capital Performance Insights
Vintage Years
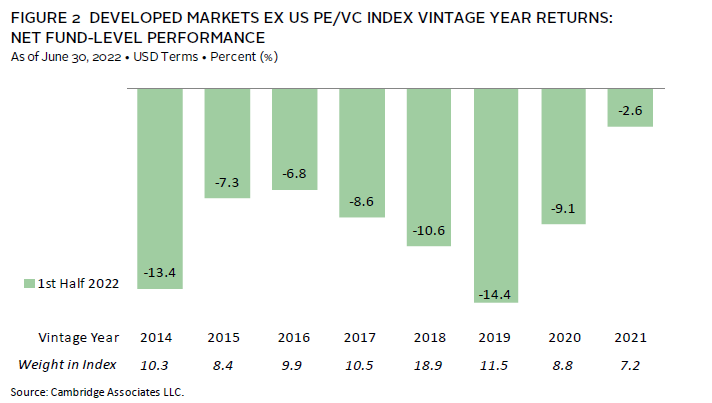
The overall decline in the Developed ex US PE/VC Index during the first six months of 2022 was observable in vintage year performance. All eight meaningfully sized vintages (those that represented at least 5% of the index’s value) had negative returns, ranging from -14.4% for 2019 funds to -2.6% for 2021 (Figure 2). Three of the key vintages (2014, 2018–19) experienced double-digit negative returns; they also represented three of the largest by weight, accounting for more than 40% of the index. In total, all eight vintages represented roughly 85% of the index and earned a pooled return of -9.7%, slightly better than the full benchmark’s return of -11.1%. While still in the red, the 2021 vintage performed the best among the largest years, buoyed by small write-downs in IT companies and a positive return for financials. Additionally, the value of new investments is often held around cost, which could have helped 2021 funds perform better, relative to older vintage years, whose investments are more mature and therefore more impacted in a down market. Vintages also typically require years of activity before qualifying as meaningfully sized but the frothy fundraising environment, fast investment pace, and strong performance during the pandemic recovery enabled the 2021 vintage to reach a weighting of 7.2% of the index after less than two years of investing. The worst-performing vintage, 2019, experienced significant write-downs in its two largest sectors, IT and consumer discretionary (in rank order).
After limited partner (LP) cash flows reached record numbers in the second half of 2021, both contributions and distributions fell significantly in the first six months of 2022. A steep decrease in valuations, high inflation globally, and tighter monetary policy imposed by central banks led PE/VC managers to pause. Contributions and distributions dropped 60% and 37%, respectively, from levels reached during the second half of 2021. The slowdown in investment activity was evident as managers only called $18.8 billion, the lowest amount since the first half of 2019. Funds in the developed markets PE/VC index returned $33.1 billion, in line with the average of all rolling six-month horizons within the last five years. In the last ten years, distributions outpaced contributions in all but seven six-month periods, although every exception occurred since 2019.
Three vintages (2019–21) accounted for almost 88% of the capital called, or $16.5 billion, during the first half of the year. Despite being the largest of the recent vintage years by total capitalization, funds in 2021 called less than $4 billion, far below 2019 and 2020 funds, which both called more than $6 billion. This could correlate to the contraction in the broader investable universe and manager’s inability to deploy newly funded capital. Distributions were widespread across vintages, with nine years (2011–19) returning more than $1.2 billion to their LPs. Even in their eleventh year, funds in 2012 distributed $6.2 billion, the largest of any vintage year.
Sectors
Figure 3 shows the Global Industry Classification Standard (GICS®) sector breakdown of the Developed Markets ex US Private Equity and Venture Capital Index and a public market counterpart, the MSCI EAFE Index. The chart illustrates differences in sector exposures, which helps explain relative performance. Notably, the PE/VC index is overweight in consumer discretionary, healthcare, industrials, and IT, and underweight in financials, consumer staples, and smaller sectors in the “other” categories (energy, utilities, and real estate).

Returns were negative for all seven meaningfully sized sectors in the first two quarters when measured in US dollars. However, given the US dollar’s strength as a reserve currency during the volatile environment, returns were notably better when measured in euros (Figure 4). Performance varied across the value/growth spectrum, ranging from -19.1% for communication services and -18.4% for IT to -6.5% for industrials. There were write-downs in all but three vintage years for industrials, but the majority experienced modest declines when compared to other sectors. Performance for communication services, the worst-performing sector, was driven by an old vintage and a young vintage. Funds in 2006 and 2020 represented the largest amount of capital and each declined by around $1.2 billion during the first half of the year. Much of the value in communication services was held in media and entertainment companies, including streaming services, which performed well during the pandemic and subsequently fell during the recovery in 2022.
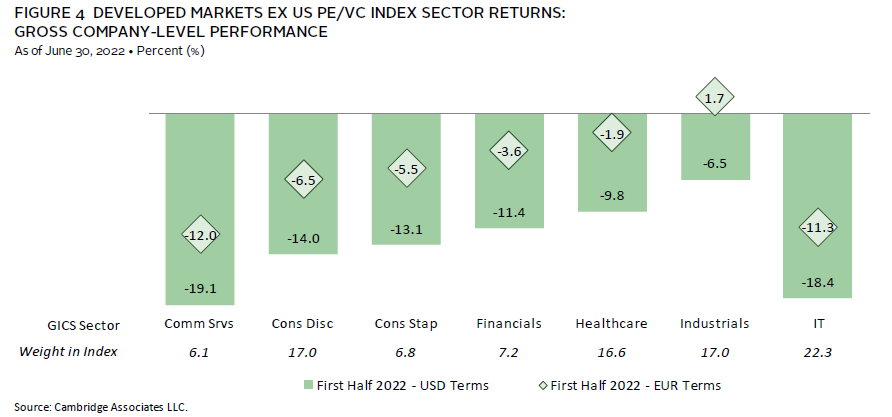
The four largest sectors—IT, industrials, consumer discretionary, and healthcare (in rank order)—represented 73% of the index’s value and combined returned -12.9% compared to -14.4% for the other three meaningfully weighted sectors. The same four sectors accounted for 77% of the capital invested during first half 2022, about 10% higher than their long-term average of 67%. Allocations to IT companies were higher than long-term trends during the period, which accounts for much of the difference.
Countries
Performance varied across the seven meaningfully sized countries, with all but one (the Netherlands) suffering negative returns in the first six months when measured in USD terms (Figure 5). Like sectors, the foreign exchange environment in 2022 made returns in euros materially better. The US-based companies, which accounted for the largest value in the index (18%), had the worst return at -19.9%; four other countries experienced double-digit negative returns. Combined, the seven largest countries accounted for 71% of the PE/VC index. Performance for the Netherlands, which earned 2.2% and 11.2% in USD and euro terms, respectively, was driven by the 2017 vintage. The recent vintages (2017–21) all had positive returns, exceeding declines in older vintages. The two largest sectors within the Netherlands were consumer staples and industrials—two of the more resilient industries—which could explain the country’s outperformance during a volatile, risk-off investment environment. At the bottom of the list, US company valuations decreased in all meaningfully sized vintage years, most notably 2014 and 2018.
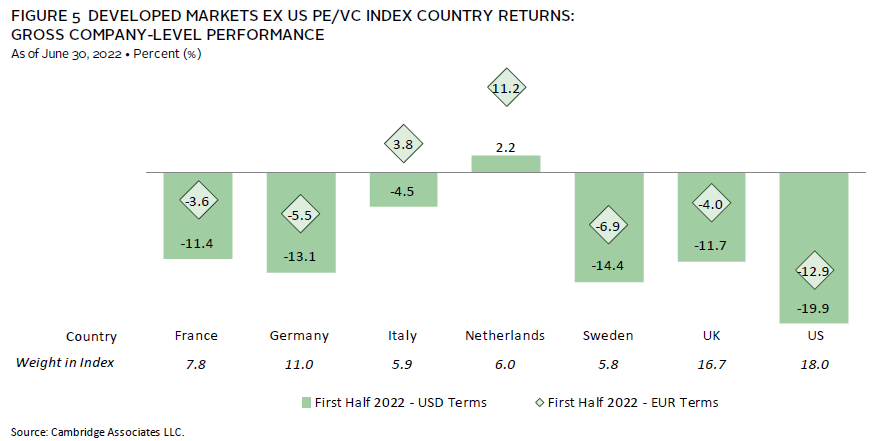
Companies in the Netherlands garnered over 4% of the capital invested during the first six months of the year, right in line with its historical trend. US businesses attracted slightly less than 16% of the invested capital, which is about 3% higher than its long-term allocation.
Emerging Markets Private Equity and Venture Capital Performance Insights
Vintage Years
Like the developed markets, all eight meaningfully sized vintage years in the emerging markets index (those that represented at least 5% by capital weight) suffered losses in first half 2022 (Figure 6). Performance ranged from -1.0% for funds with a first cash flow in 2019 to -8.4% for 2014 funds. Combined, the eight vintage years (2011, 2013–19) accounted for 79% of the index and earned a pooled return of -4.9% in the period, slightly better than the full index return of -5.9%.
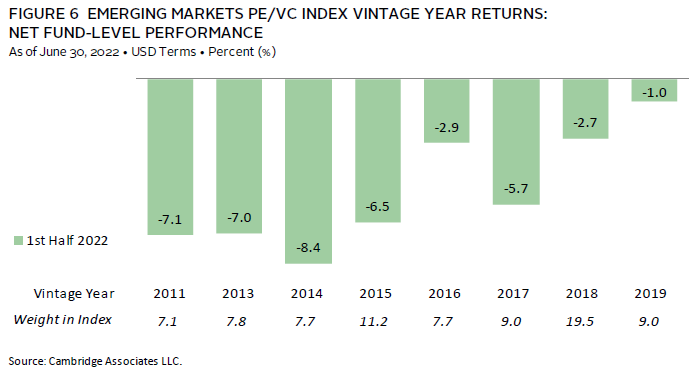
The best-performing vintage year, 2019, was driven by mixed results from its largest sector exposures. Mark-ups in healthcare, industrials, and IT slightly outpaced write-downs in consumer discretionary and communication services. However, on a net basis after fees, the overall return for the vintage was negative. On the bottom of the list, 2014 funds were pulled lower by an overweight to healthcare and IT, two sectors that performed poorly in the first six months of the year. At the close of the second quarter, the largest vintage year by far was 2018, representing 19.5% of the index. It posted the second-best return (-2.7%) among the eight major vintages, buoyed by negative, but better, returns than other years in IT and healthcare.
Contributions and distributions declined by roughly the same degree in the first half of the year from the prior period. Emerging markets PE/VC funds called $12.1 billion from and distributed $15.8 billion to LPs, representing a 36% and 34% drop, respectively. Both cash flows hit their lowest levels since 2020, which was marked by the onset of the COVID-19 pandemic and limited investment activity. However, contributions were right in line with their ten-year average for all two-quarter periods, and distributions were considerably higher than theirs. Since 1986, distributions only outpaced contributions in approximately 20% of any rolling six months, but they outpaced contributions in all but one of the 11 recent periods.
About 88% of the capital called in the first six months was from managers that started investing funds in 2018 to 2021. All four vintages drew down at least $1.9 billion, with 2018 funds calling $3.5 billion, by far the most of any group. Distributions were much more widespread, as six different vintages returned over $1 billion to investors. Notably, the 12-year-old funds from 2011 returned the most capital, $3.1 billion.
Sectors
Figure 7 shows the GICS® sector breakdown of the Emerging Markets PE/VC Index and a public market counterpart, the MSCI Emerging Markets Index. The chart highlights the significant overweights in the PE/VC index, such as in healthcare, for which exposure is more than four times higher than in the public index. Previously, the PE/VC index also had considerably more capital allocated to consumer discretionary and IT than the public benchmark, but exposure to those sectors has recently increased in the MSCI Emerging Markets Index. The private underweights are most significant in financials, followed by materials and energy (which is now included in the “other” category).

Returns in first half 2022 were negative for all seven meaningfully weighted sectors (Figure 8). The more growth-oriented industries did worse; communication services experienced an 11.1% decline, IT fell by 8.6%, and healthcare by 7.5%. On the contrary, none of the cyclical sectors (industrials, consumer staples, financials, and consumer discretionary) lost more than 4.6%.
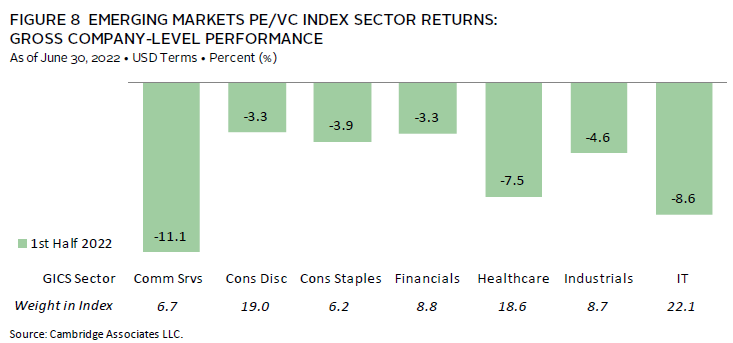
Consumer discretionary companies performed the best of the major sectors but were still in the red. Valuations for investments made by funds in all but four vintage years (2007, 2011, 2014, and 2020) were written down or kept flat. However, almost a quarter of the value for consumer discretionary businesses resided in 2015 funds and those had only a slightly negative return. Conversely, all vintage years with sizable communication services weightings, the worst-performing sector, wrote down the values of those companies. Communication services companies in the 2011 funds fell the most, suffering over a -26% return. On a gross, dollar-weighted basis, the three largest sectors by market value—IT, consumer discretionary, and healthcare—accounted for 60% of the index and together returned -6.6%, just below that of the full index.
The investment pace in first half 2022 declined to its lowest levels since 2010 as valuations fell and LPs pivoted more toward developed markets. Companies in healthcare, IT, and consumer discretionary garnered over 77% of the capital invested. Since the inception of the emerging markets index, managers have only allocated 47% of capital to these three sectors. The discrepancy is due to a recent significant increase in healthcare investment reaching 34% of capital (compared to 14% long term) and IT, which received 28% (compared to 13% long term).
Countries
China remained the largest country in the Emerging Markets PE/VC index by a considerable margin as of June 30, 2022. The four meaningfully weighted countries ranged from China at 41.6% to South Korea at 5.1%; India and the United States made the cut, representing 9.6% and 8.5% of the index, respectively (Figure 9). Hong Kong and Japan were just shy of the 5% threshold, two countries that often remain within one percentage point of the list.
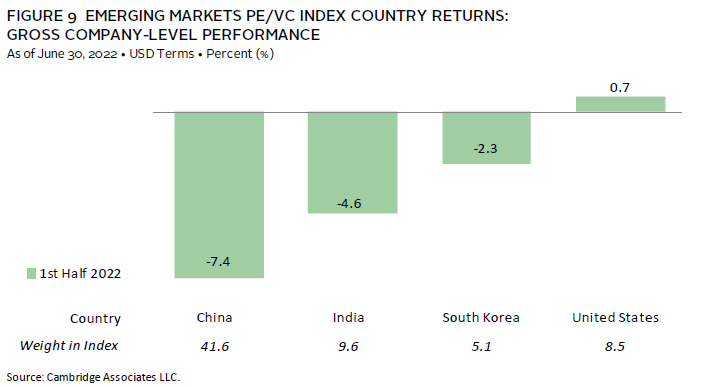
Companies in India received 16% of the capital, significantly more than its long-term norm of 9%. This increased allocation is indicative of a growing shift away from China amid its slowing economy and geopolitical tensions, and interest in an expanding private investment landscape in India. After attracting 50% of the capital invested during first half 2021, China-based companies garnered only 45% and 29% in the following two six-month periods. Within the same timeframe, India’s allocation grew from 5% to 14% to 16% in the most recent period. About 13% was invested in each of the other two meaningfully weighted countries, South Korea and the United States.
On a gross dollar-weighted basis, when combined, companies based in China, India, South Korea, and the United States returned -5.6%, beating out the full index by about 50 basis points in first half 2022.
Caryn Slotsky, Senior Investment Director
Wyatt Yasinski, Senior Investment Associate
Drew Carneal, Investment Associate
Figure Notes
Private equity includes only buyout and growth equity funds.
Global ex US Private Equity and Venture Capital Index Returns
The PE/VC indexes are pooled horizon internal rates of return and are based on limited partners’ fund-level performance; the returns are net of fees, expenses, and carried interest. Because the indexes are capitalization weighted, performance is mainly driven by the largest vintage years.
Public index returns are shown as both time-weighted returns (average annual compound returns) and dollar-weighted returns (mPME). Returns are annualized, with the exception of returns less than one year, which are cumulative. The CA mPME replicates private investment performance under public market conditions. The public index’s shares are purchased and sold according to the private fund cash flow schedule, with distributions calculated in the same proportion as the private fund, and mPME net asset value is a function of mPME cash flows and public index returns.
Vintage Year Returns
Vintage year fund-level returns are net of fees, expenses, and carried interest.
Sector Returns
Industry-specific gross company-level returns are before fees, expenses, and carried interest.
Country Returns
Industry-specific gross company-level returns are before fees, expenses, and carried interest.
GICS Sector Comparisons
The Global Industry Classification Standard (GICS®) was developed by and is the exclusive property and a service mark of MSCI Inc. and S&P Global Market Intelligence LLC and is licensed for use by Cambridge Associates. Other includes sectors that make up less than 3% of the CA benchmark.
About the Cambridge Associates LLC Indexes
Cambridge Associates derives its Global ex US Developed Markets Private Equity and Venture Capital Index from the financial information contained in its proprietary database of global ex US private equity and venture capital funds. As of June 30, 2022, the database comprised 1,023 global ex US developed markets buyouts, growth equity, and venture capital funds formed from 1986 to 2022 with a value of about $485 billion. Ten years ago, as of June 30, 2012, the benchmark index included 620 global ex US developed markets funds, whose value was roughly $239 billion. The funds in this index invest primarily in developed markets in Australia, Canada, Israel, Japan, New Zealand, Singapore, and Western Europe.
Cambridge Associates derives its Emerging Markets Private Equity and Venture Capital Index from the financial information contained in its proprietary database of global ex US buyouts, growth equity, and venture capital funds. As of June 30, 2022, the database comprised 784 emerging markets private equity and venture capital funds formed from 1986 to 2022 with a value of about $331 billion. Ten years ago, as of June 30, 2012, the benchmark index included 468 emerging markets funds, whose value was about $99 billion. The funds in this index invest primarily in Africa, emerging Asia, emerging Europe, Latin America & Caribbean, and the Middle East ex Israel.
The pooled returns represent the net periodic rates of return calculated on the aggregate of all cash flows and market values as reported to Cambridge Associates by the funds’ general partners in their quarterly and annual audited financial reports. These returns are net of management fees, expenses, and performance fees that take the form of carried interest.
About the Public Indexes
The MSCI All Country World Index (ACWI) is a free float–adjusted, market capitalization–weighted index designed to measure the equity market performance of developed and emerging markets. As of June 30, 2022, the MSCI ACWI consisted of 49 country indexes comprising 23 developed and 25 emerging markets country indexes. The developed markets country indexes included are: Australia, Austria, Belgium, Canada, Denmark, Finland, France, Germany, Hong Kong, Ireland, Israel, Italy, Japan, the Netherlands, New Zealand, Norway, Portugal, Singapore, Spain, Sweden, Switzerland, the United Kingdom, and the United States. The emerging markets country indexes included are: Argentina, Brazil, Chile, China, Colombia, Czech Republic, Egypt, Greece, Hungary, India, Indonesia, Korea, Malaysia, Mexico, Pakistan, Peru, the Philippines, Poland, Qatar, Saudi Arabia, South Africa, Taiwan, Thailand, Turkey, and the United Arab Emirates.
The MSCI EAFE Index is a free float–adjusted, market capitalization–weighted index that is designed to measure large- and mid-cap equity performance of developed markets, excluding Canada and the United States. As of June 30, 2022, the MSCI EAFE Index consisted of the following 21 developed markets country indexes: Australia, Austria, Belgium, Denmark, Finland, France, Germany, Hong Kong, Ireland, Israel, Italy, Japan, the Netherlands, New Zealand, Norway, Portugal, Singapore, Spain, Sweden, Switzerland, and the United Kingdom.
The MSCI Emerging Markets Index is a free float–adjusted, market capitalization–weighted index that is designed to measure large- and mid-cap equity performance of emerging markets. As of June 30, 2022, the MSCI Emerging Markets Index included 25 emerging markets country indexes: Argentina, Brazil, Chile, China, Colombia, Czech Republic, Egypt, Greece, Hungary, India, Indonesia, Korea, Malaysia, Mexico, Pakistan, Peru, the Philippines, Poland, Qatar, Saudi Arabia, South Africa, Taiwan, Thailand, Turkey, and the United Arab Emirates.
The MSCI World Index represents a free float–adjusted, market capitalization–weighted index that is designed to measure the equity market performance of developed markets. As of June 30, 2022, it includes 23 developed markets country indexes: Australia, Austria, Belgium, Canada, Denmark, Finland, France, Germany, Hong Kong, Ireland, Israel, Italy, Japan, the Netherlands, New Zealand, Norway, Portugal, Singapore, Spain, Sweden, Switzerland, the United Kingdom, and the United States.